$COST Costco - Breaking Out of Consolidation$COST Breaking out of consolidation today to fresh all time high.
Assuming a close today >$325 expecting to see a strong follow-through move in the near term.
Near term target: $350.00
Note: Not investment advice.
0-COST

$MNS breakout to new ATHs Great ER forecast catalyst$MNST beverage co. hit ATHs this AM then sold off into the afternoon. Stock moves slow but steady. Monster should be in line to report a terrific quarter with monthly sales #'s at all time highs and CFO said they are in line for highest profit quarter in their company history. Positive technical signals w the MACD crossover to positive, above all MAs, volume increasing as earnings approach. Stock has been consolidating for some time but has made a nice move up lately. Another consumer discretionary/consumer staple stock that could be late to the party like a $WMT and $COST too. Think this can hit 80+ with a ER crush and they do have the greatest returns out of any public company traded on the NYSE in the past 20 years! $MNST Monster Beverages kills it.

COST has signaled twice. First target is $303According to our signals, the target prices are $303 and $307. I hopped in today and grabbed a couple options. We've got a potential morningstar forming. Let's see

Triple Bottom or Inverted H&S?I have placed 3 green arrows representing the triple bottom, which is also the head of an inverted H&S.
The RSI looks healthy, I see no reason why Costco won't perform bullishly going forward.
A triple bottom is a visual pattern that shows the buyers (bulls) taking control of the price action from the sellers (bears).
A triple bottom is generally seen as three roughly equal lows bouncing off support followed by the price action breaching resistance.
The formation of triple bottom is seen as an opportunity to enter a bullish position.
The triple bottom chart pattern typically follows a prolonged downtrend where bears are in control of the market. While the first bottom could simply be normal price movement, the second bottom is indicative of the bulls gaining momentum and preparing for a possible reversal. The third bottom indicates that there's strong support in place and bears may capitulate when the price breaks through resistance levels.
An inverse head and shoulders is similar to the standard head and shoulders pattern, but inverted: with the head and shoulders top used to predict reversals in downtrends
An inverse head and shoulders pattern, upon completion, signals a bull market
Investors typically enter into a long position when the price rises above the resistance of the neckline. The dark Blue line on the chart represents the neckline.

Costco (COST) Buy trade, stop below DAILY 200 MAThis is a very nice risk/reward trade as the price could potentially hit the target and then also break out the ascending triangle for even greater profits.
The stop just below the 200 day MA and the loss of the trend-line is a clear stop and a tight stop

Long Term UpdateThe situation hasn't changed much since the last update apart from the halving that brought the average cost of mining 1 btc to $13500, it's an average world value but it means that at the moment few miners are at profit. Considering the minimum possible value of the CBEI index the cost to mine a single bitcoin drop to 7400$. Few miners are at profit at the moment, for more info about the CBEI go to www.cbeci.org


Should We Fill Our Oversized Cart 🛒 With COST? | COSTCO ($COST)🔥🛒🔥 Costco's fundamentals have us thinking about buying enough COST to feed a family of 8... but do we really need all this COST now?
While the trend looks good, Costco isn't as cut and dry as some other COVID impacted stocks. Still, we expect revenue and earnings to be up again since last quarter and we expect people getting back to life after COVID to choose Costco. This should ultimately give COST a boost, and that has us looking at some levels for bulls who want to buy COST like a way too big tub of dip.
First, before we look for lower levels, we need to be aware of R1. R1 is currently acting as resistance but should flip and act as support if and when COST can break above it.
Below we have S1 - S3 for support. S1 is the first place to look for support if the broader market pulls COST down, if earnings are underwhelming, or if we generally see consolidation before a move up for any reason. S2 - S3 are levels to watch if S1 can't hold.
Our general theory on COST can be seen in the chart. We are looking for similar price action here that was seen back in 2018 - 2019, that is a move up, consolidation, and another move up to new highs. We expect COST to continue its uptrend ultimately, and that means we are looking for a pullback to S1 or S2.
Lastly, while there is more support below, a move below S3 could make COST a much less attractive prospect for the bulls.
The bottomline here is this, we are bullish on Costco and expect earnings to be impressive, but we want to look for longs after a correction or after we break above current ATH's, not at as we consolidate under resistance.
Resource: www.earningswhispers.com + www.foxbusiness.com
✨ Drop a comment asking for an update, we do NEW setups every day! ✨
Like, Comment & Follow to help the community grow 🎉🎉
---
Good luck traders!


$WMT ahead of Earnings - May 19th is Walmart's earnings. No doubt numbers are already expected to be quite high.
That said, if you look at the YTD chart, there's little to write home about this stock. Expecting a gap fill, not sure I'll stay in after that.

$COSTBig red hammer, price bounced EOD.
Looking what seems like a potential morning star reversal.
Do not trade this. You will lose money.

This will be the most brutal Bitcoin Halving in history.Production cost is about to double to $14,000.
70% above the current price.
Last halving, price was just 10% below Production cost, and Price & Hash Rate collapsed -20%.
Bitcoin Production Cost script just updated with the latest data:
- CBECI electrical data as at 11 May 2020
- Now uses 2 week rolling data for finer granularity (while balancing TradingView load time).
- Uses 4c/kWh (lower end of CBECI and Coinshares global average Mining electrical cost estimates).
Without FOMO now (large price appreciation over next week), expect a big miner capitulation: 30%+ reduction in Hash Rates.


Costco Wholesale $COST#Costco Wholesale is approaching to pivot resistance but on 2 hourly chart already gives a signal for a pull back


COSTCO $COST playing to the script so far..go longCOSTCO $COST playing to the script so far.. Go long

Short Ideas: $COST $ARES $GOOG $FBDuring my last stock market analysis yesterday, I had identified some key indicators that showed this market is most likely headed lower. In order to take advantage of the possible flush back down to the lows, I have been looking for some good short ideas. The markets are currently consolidating and if we make new lows today or tomorrow, that would be a great time to start initiating new shorts.
COST:
Despite the relative strength, COST has been consolidating beautifully and is currently at the low of this consolidation. COST rejected and is now below the 200DMA. Good below 280 with a stop loss at previous lower high.
ARES:
ARES is currently consolidating after an impressive bounce. There is a clear level of support and resistance. ARES will be a good long above 31.70 or short below 29.00. Place stop losses at previous higher low if long and lower high if short.
GOOG:
GOOG has been pretty weak during the previous bounce and rejected the 20DMA. There is a rising wedge forming and GOOG is near the lower bound of this consolidation pattern. Good for a short below 1090 with a stop loss at 1129.
FB:
Same pattern as GOOG, rising wedge on the 30m timeframe. Good for a short below 155 with a stop loss above 161.50.

COST Doomsday prep?It has been a wild week so far on the market, with price swings up and down. Cryptocurrency seems to have a correlation with the US market, following the market. This is due to cryptocurrencies youth. In this post I want to see the share price of Costco will increase as demand increases with the current corona virus outbreak. The chart doesn't look great in the short-medium term with a double top and a strong horizontal resistance formed, however long term this would be a great entry point.

COST long opportunityCOST being accumulated over past 6 months. What may have looked like a failed breakout turned out to be a buying opportunity. Bullish setup here.

COST Looks Ready For a 5%-10% RunCOST seems to be about to break past resistance at 307.50 and make a run to $320-$330. Jan 1st $310 calls are only about $1. I think they will get up to $5-$10 by expiration.


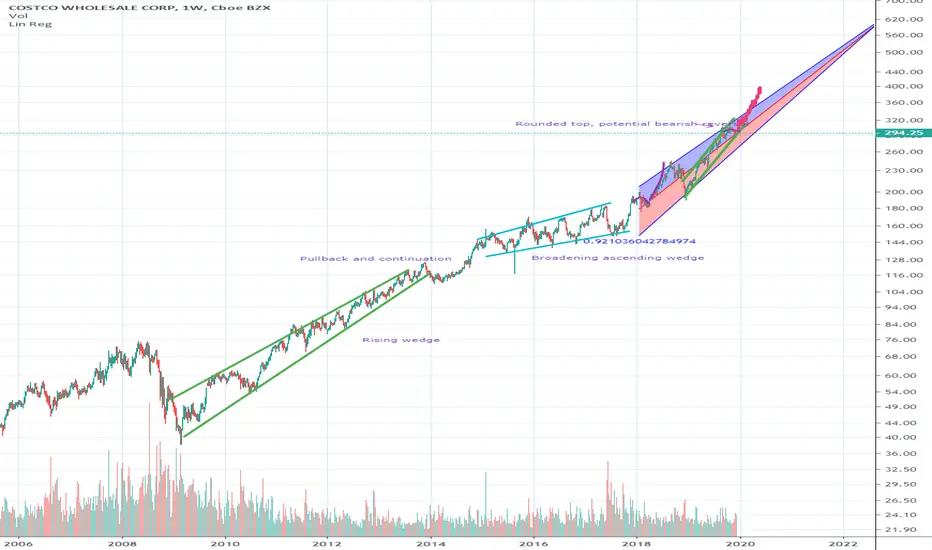
COST Regression analysisPresence of a rising wedge, broadening ascending wedge, Costco has been on a massive bull run. Rounded top also present which may be indicative of a bearish move, but with the strong rising channel and regression trend of 0.92 (strong regression trend according to Pearson's R value) the chart appears definitely more bullish rather than bearish.