SasanSeifi 💁♂️MANAUSDT /LONG VIEW 👉3D ⏭0.80/ 0.94⬆HI TRADERS ✌The possible scenario of MANAUSDT is specified.As you can see, the price faced buying pressure from the range of 0.29 and was able to grow by 170% until the supply area of 0.80. Currently, the price has been corrected by about 40% from the supply range and is trading in the range of 0.61.
The scenario that we can expect the price after slight fluctuation and VOLUME gathering by maintaining the range of 0.47 in the long term will grow again to the supply area of 0.80 and the FVG range of 0.94.considered the possibility of a new HIGH. . Then, by filling the gap, we will see the price correction.🔱
We have to see how the price will react to the 0.80/0.94 range.
Keep in mind that it is very important to maintain the range of 0.47.
❎ (DYOR)...⚠⚜
What do you think about this analysis? I will be glad to know your idea 🙂✌
IF you like my analysis please LIKE and comment 🙏✌
3d

NYSE - VISA - BREAK & RETEST - MOMENTUMBeginning testing phase using my system in the stock market!
Aiming for being able to use it for my own personal longer term investments, ideally to diversify and sow multiple income streams!
The strategy is simple but very systematic and well defined and it's taken me many years to really put together every part of successful trading down to the most intricate detail. If it can work in other markets as well as forex, then the proof will be in these public ideas that everyone has access to and that can't be deleted once posted so there will be no doubt of the authenticity and quality of the system. Which in turn, might open the door later on for potential educational material to diversify income streams which will in turn bring a higher quality of execution in the markets because there will be less financial pressure to perform.
Anyways before any of that takes place, I must see if the system can achieve a positive expectancy in stocks so be on the lookout for future stock posts as well.
Starting out with V using my bread and butter! The classic B&R play that appears throughout my ideas in forex. As far as timeframes, from pure observation in past instances with the stock market, I've found the 3 Day candle chart to be particularly clean in terms of price action so that will become my default timeframe for stocks for this first testing phase.
Lets see how this plays out over the next few weeks!

GBPUSD Looks Ready for Long.Hi I hope all are doing well
Gbpusd looks very bullish
wait for more Confirmation like inverted H&S.

NOT THE BEST TIME TO HOLD BTC PT.2 Btc continues to decline and some people seems to forgot what the defenition of bear market is. How to know if this is a bear market? 50MA goes below 200MA and price is below 200MA. Simple rules right? Usually it works for 1D charts. And what about 3D charts?
Bigger timeframe = less false signals. And we about to have our 3rd death cross somewhere in the middle of May. Are you ready? As I said earlier it's not the best time to hold btc and other crypto as well. Maybe this time would be different? Maybe, but I would not ignore such thing.
Here is what happend after the death cross in 2014 - 55% decline
And this is 2018. Quite noticable corrections right?
Are we going to get another -50% dicount? Summer is going to be hot 😈

Bitcoin 3D chart and MTF projectoryBitcoin reclaimed the weekly levels and is showing some strength on the LTF. Volume is shit however and I'm not convinced this is the reversal we'd been hoping for.
I'm expecting a LTF relief bounce. This level could bring as to levels as high as 50k. A lower High will form there and the dump will probably continue.
Until we will have the capitulation level volumes we've seen many times during significant dumps I'm expecting the downtrend to continue.
Feel free to ask me questions if you have one.

SPX500USD on a H&S pattern? 🦐SP500 on the 3d chart creates a possible Head and shoulder pattern at the top of a long bullish trend.
After the left shoulder, the market forms the head with a double top over the monthly trendline at the 4800 melt to the support.
The price then reacted at the support area and tested twice the resistance area at the 4590 level creating the right shoulder.
Furthermore, the market reacted to our beloved 0.618 Fibonacci level of the previous impulse.
How can we approach this scenario?
We will monitor the market during the day and if the market will break below the H&S neckline we will move to the higher timeframe.
If then the price will satisfy the Planctons's academy rules we will set a nice short order.
––––
Follow the Shrimp 🦐
Keep in mind.
• 🟣 Purple structure -> Monthly structure.
• 🔴 Red structure -> Weekly structure.
• 🔵 Blue structure -> Daily structure.
• 🟡 Yellow structure -> 4h structure.
• ⚫️ Black structure -> >4h structure.
Here is the Plancton0618 technical analysis , please comment below if you have any question.
The ENTRY in the market will be taken only if the condition of the Plancton0618 strategy will trigger.

DDDGood consolidation. Strong support at ~$20 range. RSI in oversold region.
Getting ready for bounce back to ~$27.5. potential upside ~$7.5 (~38%).
Good rate for EPS & revenue exceed in earnings.
Post 27.5 it may re-test support level before any break out.
Note : Please do your dd before any position. This is my personal opinion and can be wrong completely.
Regards,
Subhash

Coin - POC in 3DThe right side of the ATH Reversal Diamond has a POC well above at 251. A 5-Hour Broadening Pattern has taken shape for BTC as the consolidation continues.

Bitcoin 3D timeframe bullishWe are just an hour from 3D candle close!
Even with modest volume we broke mid-term descending structure (bullish).
Also we got rsi pointing upwards, BB %B returning to the bullish zone from below and market cipher bullish fractal.
Being 3 days from weekly close we must close with a good engulfing candle in order to confirm another local uptrend.
Important resistance zone between 56-58.5k
BEAR SCENARIO:
If we bounce back from 58-60k this can be sign of weakness.
DISCLAMER: not a financial advice

10 Year Note - Support Bear Back-Test in 3DA Market Metaverse - Vix remains above 20 with NQ1! finding resistance at the 16400-16450 zone for the 13th time on the 2h since November 23rd. The Fixed Range Volume Profile (11/23 - 12/16) - Point of Control (POC) is 16286, 2.54% above the current price. The 10Y bond back-tested, bear, the 1.43 support break.

Coinbase - Symmetry IICoinbase found support at the 5 Min MBB throughout the day. Approaching 2H 50 SMA with the UBB opening up above.

$HEXO DD & Technical Analysis (2021)such a Wicked Quarterly Report >>> here is a good analysis of the recent Merger ( www.youtube.com )
On the recent 2021-Q3 Conference Call: it seems like HEXO recent revenue doesn't include Revenue from REDECAN, since the merger happened at the end of August . . .
>>> so How much this Company Worth Today ?
>>> assuming HEXO and REDECAN did 50/50 Merger . . . the next January/March 2022 Quarterly Report should have at-least $250 million/year combined revenue (from HEXO + REDECAN) . . . hopefully, this time, HEXO will bounce back to $10 (per share) by Christmas
>>> Christmas Quarter is normally the best Quarter for Mari Juana, instead of shorting the stock, hopefully this Christmas HEXO will finally reward its Shareholders

go long Desktop Metal $DMTechnical Thesis:
-double bottom
-20 day MA on the verge of a steep cross up through the 50 day MA
-average volume is trending upwards
-it broke out with significant volume
Fundamental Thesis:
-YoY Profit margins are trending upward
-from 2018 to 2020 their debt to assets has fallen significantly
-on the Macro side, with the ability of large-scale production and companies now needing to diversify their suppliers, Desktop Metal should benefit from growing their amount of clients, increasing cash flow allowing for more R&D, paying off debt, and improving margins.
-possibility of being acquired, possibly by an automaker to improve the speed that they can produce. (like Tesla trying to acquire Velo3D)
-currently the 2nd largest holding in Cathie Wood's PRNT ETF at the time of this post. in-flows will help the stock
-they are figuring out a way to 3D print synthetic wood, which would make them an ESG play since it would reduce the need to cut down trees. Becoming an ESG play will only result in more in-flows.
-Oppenheimer and Credit Suisse initiated coverage. The street is starting to take notice.
Price Targets:
Credit Suisse: $14
Oppenheimer: no target
Sources:
www.forbes.com
www.dailyadvent.com
www.streetinsider.com

10 Year Note - Rising Wedge in 3DES1! Challenging an ATH as the everything rally continues. The 10 Year continues it's ascension as volatility is found in the small caps. NAS leading the way up. Thank you to "openclipart' for providing the open source Bond Classic.

BTC in 3D - Ascending Channel .786 Resistancetracking the .5 of Ascending Channel #2 for support signals; and a potential Higher Low.

BTC - In 3D - Bounced Dueling FiftiesDownslope continues with support found at a convergence of channel midlines.

BTC - in 3D - Scouting 4 hour Inversethe price action has yet to support the inverse pattern as the trend is down. The triangle compression continues. Would need a break and back test of both necklines to provide confirmation for a move up.


Waiting for $DDD explosionVolume gap (small purple zone) is broken and we have a road to the next one near $34. This stock bound to be successful.

ETH/USD 15mAlthough some think this may be the top, I personally do not believe so based on what I am seeing, we clearly just broke out of a major resistance zone , I believe we may be on the way to higher highs again.

COIN : STUCKCOIN is still stuck in the downward channel that it's been in for awhile now
(atleast, from this perspective).
It shifted upwards a bit yesterday, and is currently lodged underneath the 0.50 fib.
The 0.50 fib appears to be COIN's heaviest resistance within the channel
(and although COIN did break through the 0.50 fib temporarily twice before,
it was rejected at the 0.618 fib just above).
The 0.50 fib also hasn't offered much in terms of support when retested...
it appears that most of the support is coming from the 0.382 and 0.236 fib levels.
As with everyone else (I suppose) who might be considering COIN,
I'm still keeping an eye out for some significant upward price action,
or atleast something that resembles a price base.
I discovered a fascinating horizontal at $291.11,
but I'd obviously still need more before confirming anything.
Who knows, it could be weeks before it stops dropping...
or one day soon it could just start rolling uphill,
while I'm still looking for a bottom, never to come back.
No matter... for now, I'm still learning and having fun charting COIN.
And my outlook on COIN is still long long-term.
Enjoy!
// Durbtrade

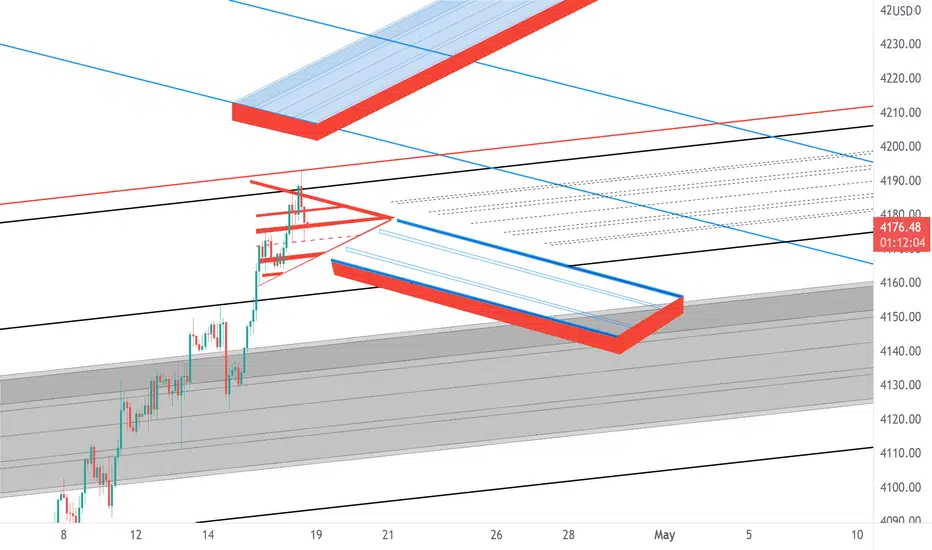
SPX in 3D - April Showers Editionsupported by the 2 hour 2nd deviation LBB with the 50 SMA there as well. The daily 8 EMA is at 4142 with the daily 4 EMA offering support. A back test of the daily MBB is 4055. The 4 hour 8EMA offered a supporting wick with the UBB 2nd dev res.
SPX 2021 Q1 - A Bull Market in 3DSPX setting HH and HLs as it crosses the 4000 barrier. The week ahead will focus on the NAS and it's triangle break.
