Will BNB stay above the current support?Hello everyone, let's take a look at the BNB to USDT chart over the 4 hour timeframe. As you can see, the price is moving below the local downtrend line.
Let's start with the designation of the support line and as you can see the first support in the near future is $ 290, if the support breaks down, the next one is $ 277 and $ 266 and $ 255.
Now let's move from the resistance line as you can see the first resistance is $ 317, if you can break it the next resistance will be $ 339 and $ 371 and $ 414.
Looking at the CHOP indicator, we can see that in the 4-hour interval we have a lot of energy, but the MACD indicator shows that the blue line is under the red line, which may result in a downward trend.
4hrchart

US30 4HIn my opinion we will go up in the next weeks ahead us.First target is above 32757 . Second target will be above 34135 and the final target will be 34947 to 35188. So I will go long for swing.

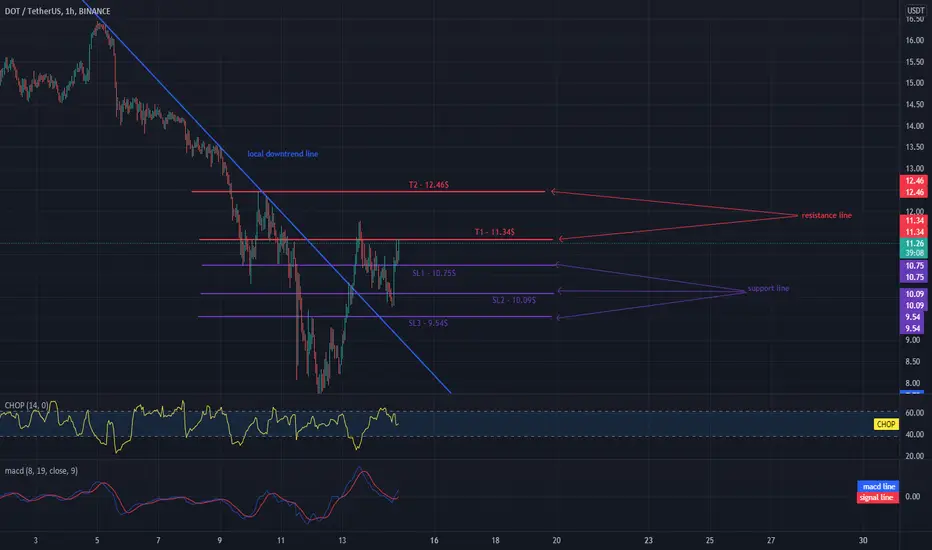
Will DOT handle the first target?Hello everyone, let's take a look at the DOT to USDT chart over the 1 hour timeframe. As you can see, the price broke above the local downtrend line.
It is worth starting with determining the stop loss that we should take into account in the coming hours. As you can see, we chose 3 stop loss: SL1 - $ 10.75, SL2 - $ 10.09, SL3 - $ 9.54.
Now let's move on to determining the targets that the price has in front of it and as you can see, the first one is at T1 - $ 11.34 with which the price is currently fighting, the next one is at T2 - $ 12.46.
Looking at the CHOP indicator we can see that in the 1 hour interval some energy has been used up, but we have a little bit to continue the movement. On the other hand, the MACD indicator shows an upward trend.
BTC on the border of the support zoneHello everyone, let's take a look at the BTC to USDT chart over the 4 hour timeframe. As you can see, the price is moving in a downtrend.
Let's start with the designation of the support line and as you can see the price has dropped below the support zone and the first support in the near future is SL1 - $ 28,373, if the support breaks down, the next is SL2 - $ 27,596 and SL3 - $ 26,716.
Now let's move on to setting targets for the coming hours and you can see that T1 - $ 29,250, if you can break it, the next T2 - $ 29,594 and T3 - $ 29,867 and T3 - $ 30,139.
Looking at the CHOP indicator, we can see that there is still a lot of energy in the 4-hour interval, while the MACD indicator is just before the red line crosses from above, which would confirm the downward trend.

Targets and stop loss for ADA / USDTHello everyone, let's take a look at the ADA to USDT chart over the 4 hour timeframe. As you can see the price tried to break the downward trend line but unfortunately fell just below it.
Let's start by setting short-term stop losses, as you can see
SL1 - $ 0.5296,
SL2 - $ 0.5048,
SL3 - $ 0.4801
and
SL4 - $ 0.4429.
Now let's move on to identifying the goals that we should consider in the coming hours:
T1 - $ 0.5936,
T2 - $ 0.6520,
T3 - $ 0.7122,
and
T4 - $ 0.7971.
Looking at the CHOP indicator, we can see that in the 4H range, energy starts to rise again, while the MACD indicator shows an uptrend.

Targets and stop loss ETH for the coming hoursHello everyone, let's take a look at the ETH to USDT chart over the 4 hour timeframe. As you can see, the price is moving in the triangle of the downturn channel.
Let's start by designating short term stop losses, as you can see:
SL1 - $ 2014,
SL2 - $ 1973
and
SL3 - $ 1933.
Now let's move on to determining the targets that we should take into account in the coming hours:
T1 - $ 2,085,
T2 - $ 2,153
and
T3 - $ 2,225.
Looking at the CHOP indicator, we can see that at the 4H interval, the energy starts to rise again, while the MACD indicator shows an uptrend.

Ace of Waters - 4 HR BTC Oanda 800% 1year, 1.37% max drawdown. I have no words for this back test. Over 800% profit in the previous year, within just over 100 trades. Only a max drawdown of 1.37%??? My jaw is literally on the floor right now. It has always been my dream to find a reasonable solution to market volatility on BTC.... The test includes the .005% fee Oanda charges PLUS the 30 tick average spread or 'slippage'. Honestly, I dont know what to do. Its been 4 years and 100's of hours trying to find something simple, sustainable and for gods sakes understandable. I think mitigation of such a huge profit potential with such a small draw down is THE holy grail I was looking for. IT IS NOT FOR SALE. DONT ASK. LOOK AT THE CHART, FIGURE IT OUT FOR YOUR SELF. PS. The settings and calculations derived are NOT arbitrary or discretionary. Its dynamic and relative. I dont claim to hold any superior math skills BUT ive done enough to know the dangers of second guessing. Ide be happy trading this algorithm on autopilot and dont profess any knowable future results BUT who cares, your going to likely win 3/4 trades and the trades you loose will likely only be 1/7th the trades you win. Be like water my friends. BINANCE:BTCUSDT OANDA:BTCUSD

LINKUSDT 4H time framePrice is in the descending trend line and under ichimoku span but the last trend line is weak so we expect that after touching the next resistance and a short falling down we have a ascending line to break descending trend line.
#crypto #future #bitcoin #link #trader #spot #danamond

BTC is gathering energy, MACD confirms the uptrend.Hello everyone, let's take a look at the BTC to USDT chart over the 4 hour timeframe. As you can see, the price is moving in the uptrend channel marked by the blue lines.
Let's start with the designation of the support line and as you can see the first support in the near term is $ 39,311, if the support breaks down, the next one is $ 38,184 and $ 37,056.
Now let's move from the resistance line as you can see the first resistance is $ 41,093, if you can break it the next resistance will be $ 42,693 and $ 44,039.
Looking at the CHOP indicator, we can see that we collect a lot of energy in the 4-hour interval, and it is also worth paying attention to the MACD indicator, which indicates that we are starting an upward trend.

SHIB possible quick move to earn 5.5%Hello everyone, let's take a look at the SHIB to USDT chart over the 4 hour timeframe. As you can see, price is moving above the local uptrend line.
Let's start with the designation of the support line and as you can see the first support in the near future is $ 0.00002389, if we manage to keep it, we can move quickly to the resistance point, which will give about 5.5% profit. However, if the support breaks down, the next one is $ 0.00002216.
Now let's move from the resistance line, as you can see, the first resistance is $ 0.00002556, if you can break it, the next resistance will be $ 0.00002672 and $ 0.00002768 plus $ 0.00002863.
Looking at the CHOP indicator, we can see that in the 4-hour interval some energy was used, while there was some left for the next move.

SOL fights with resistance at $ 106Hello everyone, let's take a look at the SOL to USDT Chart on the 4H Interval. As you can see, price is moving above the local uptrend line.
Let's start with the designation of the support line and as you can see the first support in the near future is $ 102 if the support is broken, the next one is $ 92 and another one at $ 78.
Now let's move on from the resistance line, as you can see, the first resistance is $ 106 which the price is currently struggling with, if it manages to break it, the next resistance will be $ 113 and $ 119.
Looking at the CHOP indicator, we can see that in the 4-hour interval most of the energy has already been used.

NOTE! BTC a lot of energy at 4H.Hello everyone, let's take a look at the BTC to USDT chart over time. As you can see, the price is moving in an uptrend channel marked with blue lines.
Let's start with the designation of the support line and as you can see the first support in the near future is $ 39,808, if the support breaks down, the next one is $ 37,558.
Now let's move from the resistance line as you can see the first resistance is $ 41,429, if you can break it the next resistance will be $ 42,779 and $ 43,769.
It is worth paying attention to the CHOP indicator, we can see that in the 4-hour interval we have a lot of energy and we can expect movement in inspiring hours.

SHIB a lot of energy in the 4H interval!Hello everyone, let's take a look at the SHIB to USDT chart at 4H. As you can see, the price is moving along the local uptrend line.
Let's start with the designation of the support line and as you can see the first support in the near future is $ 0.00002534, if the support breaks down, the next one is $ 0.00002425, and the next one is $ 0.00002269.
Now let's move from the resistance line as you can see, the first resistance is $ 0.00002629, if you can break it, the next resistance is $ 0.00002795, the next one is $ 0.00002973 and the next one is $ 0.00003214.
Looking at the CHOP indicator, we can see that in the 4H interval we have a lot of energy, if BTC remains calm, we can observe an increase in the SHIB price in the coming hours.

btcudst 4H If the Bearish Trend of BTC is starting , This is the wave counting of bearish wave 1 .
In my prespective this will be the leading diagonal and leading diagonal allways accures in wave 1
where the small wave 4 making the overlap with small wave 1

EURAUD BUY Intraday Opportunity Welcome back! Here's an analysis of this pair!
**EURAUD - listen to video analysis.
We recommend that you keep this pair on your watchlist and enter when the entry criteria of your strategy is met.
Please support this idea with a LIKE and COMMENT if you find it useful and Click "Follow" on our profile if you'd like these trade ideas delivered straight to your email in the future.
Thanks for your continued support!
Brian & Kenya Horton, BK Forex Academy

BTC - #BTC $BTC (New Update in 4H)Dear Friends
Similar description to the previous post (daily timeframe).

EUR.USD bearish flagHello Traders,
The EUR.USD has been falling on the daily chart for a while, but has also formed a bearish flag on the 4 HR.
If the price breaks the flag to the downside, it could indicate a trend continuation on the daily time frame to the downside.
I will update this post idea if my bias is correct or not.
Until then, happy trading.
Samantha

BTC Bullish Flag has formed on 4hr chartonce again bitcoin is forming a bullish flag pattern on 4hr chart, the resistance range is coming from 42730 to 42550 and the support range is coming in the range of 41900 to 41450, if it break out successfully then the technical price is coming in around 44800 to 45400.

Cardano looks ready to trigger an Adam & Eve double bottomWe can see considerable amount of volume has accompanied the current big green candle that has broken above the Adam and Eve double bottom neckline here. This type of volume impulse usually signifies that a breakout of a pattern has been confirmed. However, this being only a 4hr timeframe, we must be prepared as always for the first breach of the neckline to potentially be a fakeout. For now though, it is looking like it wants to validate and head up to the $1.28 region.

ADA/USDT 4H Long positionwe expect a bullish swing we set a trigger @0.852
Hope We enjoy
#Long #analysis #SWing

BTC Update Binance 4h chartBTC Update
The depth of this retracement means our B wave is likely complete already if this is a triangle structure- now a standard triangle (like we had at 10k) rather than running. Daily demand at 38k is still the key to hold for this idea to remain valid. Next support are 38k , 36.5k,35k ,34.8k , Resitances are 40k, 41.5k , 42k , 43.5k ,44k , 45k . If btc don't break frist support then we may see bullish momentum otherwise bearish , News will also effect in this regard .

BTC Bullish Flag has formed on 4hr chartcurrently bitcoin is forming bullish flag pattern in 4hr time frame, the technical resistance is coming in 38300, if it breaks the resistance and closed above 38300 at day closing candle, then the technical predicted price is coming in around 40100.

MY THOUGHTS ON USD/JPYIn my analysis of USD/JPY on the 4HR CHART, This currency pair is moving BEARISHLY to the next level of resistance at price of $114.302. In this analysis, I used the Fib and Trendline Analysis. OANDA:USDJPY
