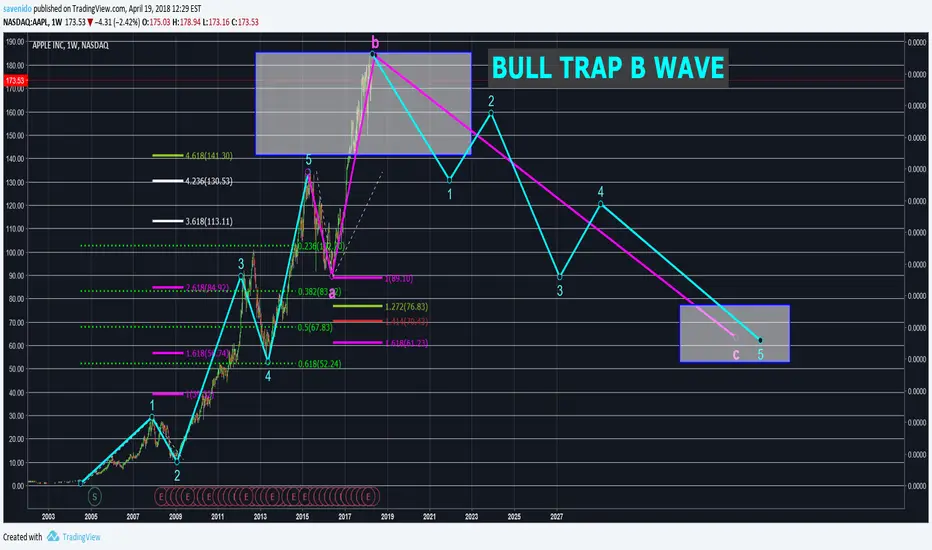
Apple Dropped From The Tree. EUREKA..This chart suggest me Here We Have A BUBbbLLEE..
aNY NEW tech from apple ?
Phone same phone.
So what the stock price is that man.
Come on. BUBBBLEE..
BiG SHort.
Aaple


AAPL long opportunity, Retrace into support.AAPL long from $170.34. Looking for $190.00 over the next few weeks. AAPL hit a major support level, bounced and has now retraced back down to the support level. Along with that, the market staged a nice reversal day yesterday closing only slighty lower, signaling a SHORT TERM low is in place. I am expecting to see a move up into the end of the year, then down we go again.

Nasdaq [Daily] Santa Claus rally ? Let's think againLooks like dead cat bounce for now.
Bears took that post G20 rally as selling opportunity.
more fake news needed as bulls have to retake 7200/7400


$CAT Fibonacci & SVE Pivot PointsFibonacci Pivot $123.68
SVE Pivot (TOS) $123.61
1HR 9eMA $123.62
Fibonacci Pivot S1 $119.40
SVE Pivot (TOS) S2 $119.33
COG Mean Retrace $119.40
Fibonacci Pivot R2 $127.96
SVE Pivot (TOS) R2 $127.91
Monthly Chart to 2009 + Fibonacci Retracement shows $115.38 critical (Monthly Chart not identified here)
- China/Tariff news or activities has immediate directional impact (Scalping Opps)
- 11/1/18 – Trump/China have ‘Nicely’ Tone of progress gave strength in China or Tariff impacted tickers
If Apple pull back impacts DOW & additional positive sentiment not rec’d for China Talks by open...
#tekmunnee strategy for 11/2/2018 thru weekend on $CAT
- Note 9 eMA on 1HR at $123.62; is same range as Fib/SVE Pivot $123.68/61
- If below $123.68/61 Fib/SVE Pivot, will look for Short/Puts to test Fib Pivot S1 $119.40 & SVE Pivot S2 $119.33; COG Mean is also $119.40 (Max Pain 11/2 = $120; if relevant we may see this price level into closing)
- If above $123.61/68 Fib/SVE Pivot, potential upside to $127.91/96 Fib/SVE R2, however, strong news/catalyst, or market sentiment (China) to upside, w/ volume needed
Looking to scalp/swing intraday to overnight & recycle until we have conviction/directional tone on China/Tariffs. If China/Tariff talks ease and/or stabilize, $CAT becomes extremely bullish, with many others impacted by it this year, i.e. $BA

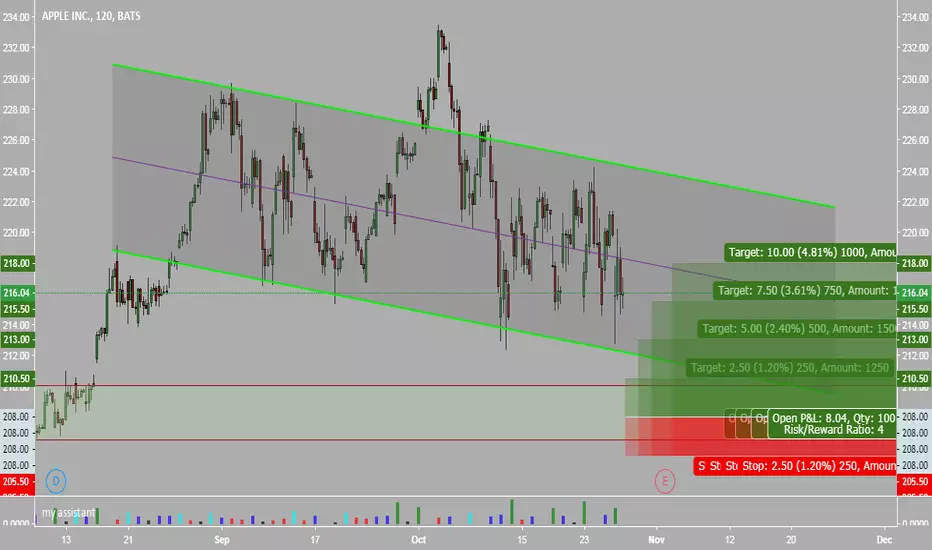

$AAPL Bearish Credit Spread ( 2 day exp )Bearish Credit Spread on AAPL . Watching the current support at 216.5 for a breakdown into the end of this week.
Entry 216.60
Max profit 215.00
Break even 216.38
0.78:1 risk/reward

AAPL Jan 155 put optionsNASDAQ:AAPL broke resistance following a lower high. Next week it might be the perfect storm for AAPL to touch or 154 or lower
dissapointing Iphone X sales with earnings report on May 1st '18 at 4pm bgr.com
general market direction NASDAQ:QQQ
Technical analysis shows no resistance until $154
Bought put options today , will update next week.

AAPL : Looks like Bearish !!Hits the upper trendline resistance !!
On Monthly Charts Aapl unable to close above 180 for past 2 months !!
MACD -- Turning Bearish -- May be Repeat of 2012 move !!
CLose below 165 on weekly would be bearish and close above 180 on monthly would be bullish / overbought !!
AAPL : Short Around 180 -- Target 132 Last Breakout -- Stop Any Close above 180 on weekly !!
Time Line -- 3-4 Months !!


Aapl Apple 4hr Long 3 bar setupBouncing off the 20 ema great 3 bar setup. good news with warren buffet. i am long


AAPL @ 1h @ this week back into new terrotirity above 120USD ?Take care
& analyzed it again
- it`s always your decision ...
(for a bigger picture zoom the chart)
This is only a trading capability - no recommendation !!!
Buying/Selling or even only watching is always your own responsibility ...
Best regards :)
Aaron

AAPL @ daily @ closed higher last 3 weeks (trend still friendly)This is only a trading capability - no recommendation !!!
Buying/Selling or even only watching is always your own responsibility ...
.zip (with PDF`s) @ my Google Drive
drive.google.com
4XSetUps for next week - friday close (DOW 30 Index & all shares)
Best regards :)
Aaron

AAPL @ 1h @ the trend is your friend! But around 120 also?Take care
& analyzed it again
- it`s always your decision ...
(for a bigger picture zoom the chart)
Best regards :)
Aaron
