ADA – Downtrend Dominates, Risk of Deeper PullbackHello everyone,
On the chart, the downtrend remains clearly intact, with a persistent sequence of lower highs and lower lows extending from October to the present. Price is trading entirely below EMA34 and EMA89, both of which are sharply sloping downward. This confirms that sellers continue to control the market, with no meaningful signs of exhaustion so far.
Throughout November and December, all rebound attempts have been weak, short-lived, and repeatedly rejected around the EMA34 near the 0.45 USD area. This behavior suggests that buying pressure is purely technical in nature and insufficient to form a reversal structure. At the moment, ADA is hovering around the nearby support zone of 0.37–0.39 USD. However, the current D1 candle structure — small bodies, short lower wicks, and declining volume — indicates fading momentum, a pattern that often precedes a breakdown of support.
From an EMA perspective, the widening gap between price and EMA34 (0.452) as well as EMA89 (0.560) further confirms that the downtrend is expanding rather than contracting. To shift the market’s bias, ADA would need at least a daily close above 0.45 USD. At this stage, there are no early signals supporting such a scenario. Volume has continued to dry up over recent weeks and is concentrated mainly on bearish candles, implying a lack of fresh inflows, while sellers still require relatively little pressure to push prices lower.
Based on the current technical picture, the highest-probability scenario remains a breakdown below the 0.37–0.38 support zone, followed by an extension of the decline toward deeper support around 0.30–0.33 USD. This area represents a significant liquidity zone that previously acted as a major support, where price could eventually see a technical bounce or begin forming a new accumulation base. Until ADA approaches that region, there is still insufficient evidence to expect a genuine trend reversal.
Wishing you all a successful trading day!
Adausd

ADAUSD Bearish sideways consolidation capped at 4,590The ADAUSD pair continues to display a bearish outlook, in line with the prevailing downward trend. Recent price action suggests a corrective pullback, potentially setting up for another move lower if resistance holds.
Key Level: 4,590
This zone, previously a consolidation area, now acts as a significant resistance level.
A failed test and rejection at 4,590 would likely resume the bearish momentum.
Downside targets include:
3,580 – Initial support
3,160 – Intermediate support
2,830 – Longer-term support level
Bullish Scenario (breakout above 4,590):
A confirmed breakout and daily close above 4,590 would invalidate the bearish setup.
In that case, potential upside resistance levels are:
4,880 – First resistance
5,350 – Further upside target
Conclusion
ADAUSD remains under bearish pressure, with the 4,590 level acting as a key inflection point. As long as price remains below this level, the bias favours further downside. Traders should watch for price confirmation around that level to assess the next move.
This communication is for informational purposes only and should not be viewed as any form of recommendation as to a particular course of action or as investment advice. It is not intended as an offer or solicitation for the purchase or sale of any financial instrument or as an official confirmation of any transaction. Opinions, estimates and assumptions expressed herein are made as of the date of this communication and are subject to change without notice. This communication has been prepared based upon information, including market prices, data and other information, believed to be reliable; however, Trade Nation does not warrant its completeness or accuracy. All market prices and market data contained in or attached to this communication are indicative and subject to change without notice.

ADA - Bearish Expanding TrianglePrice is trading within a broadening (expanding) triangle , with higher highs and lower lows indicating increasing volatility and distribution. The structure favors a bearish resolution , and I’m expecting a breakdown below the lower trendline to confirm continuation to the downside.
Expectations:
Breakdown from the expanding triangle → acceleration lower.
Downside Targets:
🎯 $0.25
🎯 $0.15
As long as price stays below the upper boundary, the bearish scenario remains dominant.
What I think is going on with Cardano right nowThis is my personal opinion and update regarding Cardano. It is not a financial advice.

ADAUSD Bearish sideways consolidation capped at 4,590The ADAUSD pair continues to display a bearish outlook, in line with the prevailing downward trend. Recent price action suggests a corrective pullback, potentially setting up for another move lower if resistance holds.
Key Level: 4,590
This zone, previously a consolidation area, now acts as a significant resistance level.
A failed test and rejection at 4,590 would likely resume the bearish momentum.
Downside targets include:
3,580 – Initial support
3,160 – Intermediate support
2,830 – Longer-term support level
Bullish Scenario (breakout above 4,590):
A confirmed breakout and daily close above 4,590 would invalidate the bearish setup.
In that case, potential upside resistance levels are:
4,880 – First resistance
5,350 – Further upside target
Conclusion
ADAUSD remains under bearish pressure, with the 4,590 level acting as a key inflection point. As long as price remains below this level, the bias favours further downside. Traders should watch for price confirmation around that level to assess the next move.
This communication is for informational purposes only and should not be viewed as any form of recommendation as to a particular course of action or as investment advice. It is not intended as an offer or solicitation for the purchase or sale of any financial instrument or as an official confirmation of any transaction. Opinions, estimates and assumptions expressed herein are made as of the date of this communication and are subject to change without notice. This communication has been prepared based upon information, including market prices, data and other information, believed to be reliable; however, Trade Nation does not warrant its completeness or accuracy. All market prices and market data contained in or attached to this communication are indicative and subject to change without notice.

The rally is back: from Ethereum to Toncoin!Recently, the pairs ETHUSD, TONUSD, LNKUSD, ADAUSD, and AAVUSD have been climbing amid improving market sentiment and inflows into ETFs — including spot ETFs (funds that buy the underlying asset itself rather than derivatives). Investors are reacting to ecosystem news and protocol upgrades that enhance the real utility of networks. As a result, the market has received fresh momentum: demand is expanding, and prices are following.
Five Growth Factors:
ETHUSD (Ethereum +15.3%) — Supported by inflows into spot ETFs and heightened developer activity around network upgrades, which strengthened buyer interest (spot ETFs are funds that directly hold ETH).
TONUSD (Toncoin +9.7%) — User growth driven by Telegram mini-apps and attention campaigns like SERA (a gaming/social ecosystem event; SERA is the initiative’s name) is expanding the user base.
LNKUSD (Chainlink +13.9%) — Adoption of CCIP (a cross-chain messaging and value transfer protocol) continues to grow, including through bridges (technology that transfers assets between networks) — on December 4, the Base–Solana bridge was announced (Base and Solana are blockchains; the bridge connects them).
ADAUSD (Cardano +16.2%) — December saw the launch of Midnight/NIGHT (Midnight is a privacy-focused sidechain — a separate network alongside the main one; NIGHT is its token). This gave Cardano a real new feature: private transactions and business-ready smart contracts.
AAVUSD (Aave +15.8%) — Progress toward protocol version v4 (the fourth major upgrade enhancing flexibility and reducing client risk): a public testnet and preparation for the mainnet are heating up expectations around functionality and token economics.
If interest in Ethereum ETFs remains strong, Ethereum can maintain its momentum. Toncoin benefits from easy access through Telegram apps; Chainlink gains strength as more services adopt its cross-chain “translator,” enabling secure data and token transfers; Cardano benefits from having a dedicated private network for business use cases; and Aave grows on expectations surrounding its upcoming core protocol upgrade.
FreshForex analysts note that in the coming weeks, the performance of ETH, TON, LINK, ADA, and AAVE will depend on three factors: sustained inflows into Ethereum-backed ETFs, real user and use-case growth (TON via Telegram mini-apps; LINK as the “connector” between blockchains), the pace of technological rollouts (the Midnight private network in the Cardano ecosystem and Aave’s transition from testing to the full v4 release). Investors are advised to maintain strict risk management and monitor the macroeconomic calendar.

ADAUSD testing pivotal resistance The ADAUSD pair continues to display a bearish outlook, in line with the prevailing downward trend. Recent price action suggests a corrective pullback, potentially setting up for another move lower if resistance holds.
Key Level: 4,590
This zone, previously a consolidation area, now acts as a significant resistance level.
A failed test and rejection at 4,590 would likely resume the bearish momentum.
Downside targets include:
3,580 – Initial support
3,160 – Intermediate support
2,830 – Longer-term support level
Bullish Scenario (breakout above 4,590):
A confirmed breakout and daily close above 4,590 would invalidate the bearish setup.
In that case, potential upside resistance levels are:
4,880 – First resistance
5,350 – Further upside target
Conclusion
ADAUSD remains under bearish pressure, with the 4,590 level acting as a key inflection point. As long as price remains below this level, the bias favours further downside. Traders should watch for price confirmation around that level to assess the next move.
This communication is for informational purposes only and should not be viewed as any form of recommendation as to a particular course of action or as investment advice. It is not intended as an offer or solicitation for the purchase or sale of any financial instrument or as an official confirmation of any transaction. Opinions, estimates and assumptions expressed herein are made as of the date of this communication and are subject to change without notice. This communication has been prepared based upon information, including market prices, data and other information, believed to be reliable; however, Trade Nation does not warrant its completeness or accuracy. All market prices and market data contained in or attached to this communication are indicative and subject to change without notice.

Cardano (ADA) UpdateADA is holding a key support zone after a clean reclaim of the range low. Momentum has shifted, but the market is still waiting for one thing: a clear CHoCH to confirm the trend reversal.
Price is compressing just under a high-volume node, and if buyers can flip this area into support, the next leg up opens quickly. Indicators are showing fresh upside momentum after multiple sweeps of liquidity below the range.
For now, it’s simple:
Hold the reclaim → Break structure → Trend shifts.
Lose the level and ADA slides back into the lower range.
Watching closely for that CHoCH confirmation.
What’s your bias here?

ADA: A Bullish SetupHey guys, ADA's testing some critical levels here at $0.4357 on the 4H timeframe.
Cardano's pushing right against the Bollinger Band upper boundary at $0.4364 after a solid rally from the $0.4106 low. The structure looks bullish - we've confirmed a higher low formation, price is holding above both EMA20 ($0.4254) and EMA50 ($0.4246), and ADX at 44.7 confirms we're in a legitimate trending environment rather than choppy consolidation. MACD just flipped bullish with a fresh crossover, adding momentum to the setup.
What caught my attention is the wick analysis showing 26.7% lower wick (strong buyer absorption) versus 65.1% upper wick (seller resistance at $0.4413). RSI at 66.8 gives us room to run before overbought territory, though Stochastic at 84.5 suggests we're getting stretched short-term. Volume's slightly below average which introduces caution - we'd ideally want expansion on the breakout attempt.
Key resistance sits at today's high of $0.4413, then psychological $0.4500 if we punch through. Support stacks at the EMA cluster around $0.4250 and BB middle at $0.4207. For entries, I'd prefer a slight pullback toward $0.4300-$0.4340 rather than chasing at current levels. Stop below $0.4190 (beneath EMA confluence) with targets at $0.4450 and $0.4550 sets up roughly 1:2.5 risk/reward.
The trend regime and bullish price structure tilt probabilities upward, but that upper wick rejection at $0.4413 means we need to see buyers step up with conviction. Watch how price reacts if we test the EMA20 support - a clean bounce there confirms continuation potential. How are you playing this move?

ADAUSD downtrend continuation below pivotal 4,590The ADAUSD pair continues to display a bearish outlook, in line with the prevailing downward trend. Recent price action suggests a corrective pullback, potentially setting up for another move lower if resistance holds.
Key Level: 4,590
This zone, previously a consolidation area, now acts as a significant resistance level.
A failed test and rejection at 4,590 would likely resume the bearish momentum.
Downside targets include:
3,580 – Initial support
3,160 – Intermediate support
2,830 – Longer-term support level
Bullish Scenario (breakout above 4,590):
A confirmed breakout and daily close above 4,590 would invalidate the bearish setup.
In that case, potential upside resistance levels are:
4,880 – First resistance
5,350 – Further upside target
Conclusion
ADAUSD remains under bearish pressure, with the 4,590 level acting as a key inflection point. As long as price remains below this level, the bias favours further downside. Traders should watch for price confirmation around that level to assess the next move.
This communication is for informational purposes only and should not be viewed as any form of recommendation as to a particular course of action or as investment advice. It is not intended as an offer or solicitation for the purchase or sale of any financial instrument or as an official confirmation of any transaction. Opinions, estimates and assumptions expressed herein are made as of the date of this communication and are subject to change without notice. This communication has been prepared based upon information, including market prices, data and other information, believed to be reliable; however, Trade Nation does not warrant its completeness or accuracy. All market prices and market data contained in or attached to this communication are indicative and subject to change without notice.

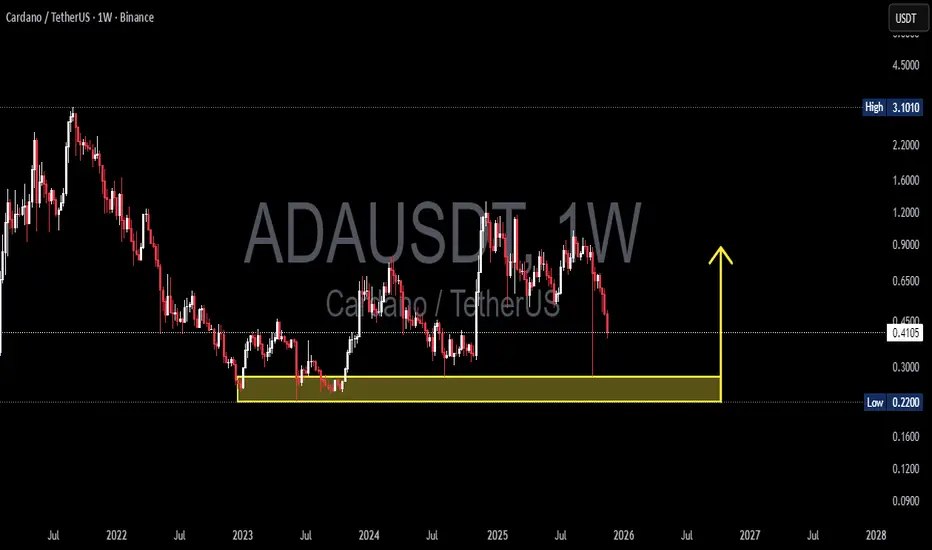
Cardano ADA price analysisIs a return to $2.70 realistic for CRYPTOCAP:ADA ?
The structure of OKX:ADAUSDT resembles OKX:ETCUSDT long-term behavior:
• A strong rally in 2020–2021
• A well-defined multi-year support zone that has repeatedly held
However, CRYPTOCAP:ADA ’s current market capitalization (~$16.5B) changes the equation.
A move back to $2.70 implies a valuation close to $100B, placing CRYPTOCAP:ADA in the same range as CRYPTOCAP:XRP , not CRYPTOCAP:ETC
#Cardano’s staking-based model aligns it more with CRYPTOCAP:ETH economic design than with PoW assets like CRYPTOCAP:BTC , CRYPTOCAP:LTC , CRYPTOCAP:ZEC etc. If network usage expands, price appreciation remains possible.
Key levels to watch:
• $0.60 — requires a confirmed breakout and hold
• Long-term outlook depends heavily on market recovery and ecosystem activity
Where do you position CRYPTOCAP:ADA ’s fair value in the next 6–12 months?
______________
◆ Follow us ❤️ for daily crypto insights & updates!
🚀 Don’t miss out on important market moves
🧠 DYOR | This is not financial advice, just thinking out loud

ADAUSD trend continuation key level at 4,590The ADAUSD pair continues to display a bearish outlook, in line with the prevailing downward trend. Recent price action suggests a corrective pullback, potentially setting up for another move lower if resistance holds.
Key Level: 4,590
This zone, previously a consolidation area, now acts as a significant resistance level.
A failed test and rejection at 4,590 would likely resume the bearish momentum.
Downside targets include:
3,580 – Initial support
3,160 – Intermediate support
2,830 – Longer-term support level
Bullish Scenario (breakout above 4,590):
A confirmed breakout and daily close above 4,590 would invalidate the bearish setup.
In that case, potential upside resistance levels are:
4,880 – First resistance
5,350 – Further upside target
Conclusion
ADAUSD remains under bearish pressure, with the 4,590 level acting as a key inflection point. As long as price remains below this level, the bias favours further downside. Traders should watch for price confirmation around that level to assess the next move.
This communication is for informational purposes only and should not be viewed as any form of recommendation as to a particular course of action or as investment advice. It is not intended as an offer or solicitation for the purchase or sale of any financial instrument or as an official confirmation of any transaction. Opinions, estimates and assumptions expressed herein are made as of the date of this communication and are subject to change without notice. This communication has been prepared based upon information, including market prices, data and other information, believed to be reliable; however, Trade Nation does not warrant its completeness or accuracy. All market prices and market data contained in or attached to this communication are indicative and subject to change without notice.

ADA : LIVE TRADE
Hello friends
According to the channel in which the price is located, you can see that every time it reached support, we had a growth, and now that it has reached the same support, we can expect another growth.
This analysis is purely technically reviewed and is not a buy or sell recommendation, so do not act emotionally and observe risk and capital management.
*Trade safely with us*

$ADABTC Ugly Monthly CloseBINANCE:ADABTC Ugly Monthly close
This is another confirmation of the downtrend continuation

ADAUSD bearish sideways consolidation capped at 4,590The ADAUSD pair continues to display a bearish outlook, in line with the prevailing downward trend. Recent price action suggests a corrective pullback, potentially setting up for another move lower if resistance holds.
Key Level: 4,590
This zone, previously a consolidation area, now acts as a significant resistance level.
A failed test and rejection at 4,590 would likely resume the bearish momentum.
Downside targets include:
3,580 – Initial support
3,160 – Intermediate support
2,830 – Longer-term support level
Bullish Scenario (breakout above 4,590):
A confirmed breakout and daily close above 4,590 would invalidate the bearish setup.
In that case, potential upside resistance levels are:
4,880 – First resistance
5,350 – Further upside target
Conclusion
ADAUSD remains under bearish pressure, with the 4,590 level acting as a key inflection point. As long as price remains below this level, the bias favours further downside. Traders should watch for price confirmation around that level to assess the next move.
This communication is for informational purposes only and should not be viewed as any form of recommendation as to a particular course of action or as investment advice. It is not intended as an offer or solicitation for the purchase or sale of any financial instrument or as an official confirmation of any transaction. Opinions, estimates and assumptions expressed herein are made as of the date of this communication and are subject to change without notice. This communication has been prepared based upon information, including market prices, data and other information, believed to be reliable; however, Trade Nation does not warrant its completeness or accuracy. All market prices and market data contained in or attached to this communication are indicative and subject to change without notice.

DeGRAM | ADAUSD is testing the $0.4 level📊 Technical Analysis
● ADA/USD is testing the main long-term support zone after an extended decline, with repeated touches of the primary support line indicating exhaustion of bearish momentum.
● The pair is forming a falling-wedge–style compression toward resistance near 0.52–0.55, suggesting the potential for a bullish rebound if the 0.40–0.42 base continues to hold.
💡 Fundamental Analysis
● Market sentiment is stabilizing as altcoins see renewed accumulation and Cardano activity improves ahead of upcoming ecosystem upgrades.
✨ Summary
● Bullish bias above 0.42. Targets: 0.50 → 0.55. Support: 0.40.
-------------------
Share your opinion in the comments and support the idea with a like. Thanks for your support!

CARDANO Can it make a strong Bear Cycle rally?Cardano (ADAUSD) has been trading within a Channel Down since its December 02 2024 weekly top and undeniably has (long) started its new Bear Cycle.
This Channel Down has however bottomed (Lower Low) and with the 1W RSI hitting also its 3 year Support (essentially the Support of the whole Bull Cycle), it is possible to give us a strong Bear Cycle rally.
This rally would technically be the pattern's new Bullish Leg with the previous two both peaking on the 0.8 Fibonacci level. This time however, ADA is trading below its 1W MA50 (blue trend-line) and during Bear Cycle's, that is the trend's main Resistance.
As a result, we believe the rebound is limited at a maximum price of $0.6500.
---
** Please LIKE 👍, FOLLOW ✅, SHARE 🙌 and COMMENT ✍ if you enjoy this idea! Also share your ideas and charts in the comments section below! This is best way to keep it relevant, support us, keep the content here free and allow the idea to reach as many people as possible. **
---
💸💸💸💸💸💸
👇 👇 👇 👇 👇 👇

ADAUSD downtrend continuation below 4,590 resistanceThe ADAUSD pair continues to display a bearish outlook, in line with the prevailing downward trend. Recent price action suggests a corrective pullback, potentially setting up for another move lower if resistance holds.
Key Level: 4,590
This zone, previously a consolidation area, now acts as a significant resistance level.
A failed test and rejection at 4,590 would likely resume the bearish momentum.
Downside targets include:
3,580 – Initial support
3,160 – Intermediate support
2,830 – Longer-term support level
Bullish Scenario (breakout above 4,590):
A confirmed breakout and daily close above 4,590 would invalidate the bearish setup.
In that case, potential upside resistance levels are:
4,880 – First resistance
5,350 – Further upside target
Conclusion
ADAUSD remains under bearish pressure, with the 4,590 level acting as a key inflection point. As long as price remains below this level, the bias favours further downside. Traders should watch for price confirmation around that level to assess the next move.
This communication is for informational purposes only and should not be viewed as any form of recommendation as to a particular course of action or as investment advice. It is not intended as an offer or solicitation for the purchase or sale of any financial instrument or as an official confirmation of any transaction. Opinions, estimates and assumptions expressed herein are made as of the date of this communication and are subject to change without notice. This communication has been prepared based upon information, including market prices, data and other information, believed to be reliable; however, Trade Nation does not warrant its completeness or accuracy. All market prices and market data contained in or attached to this communication are indicative and subject to change without notice.

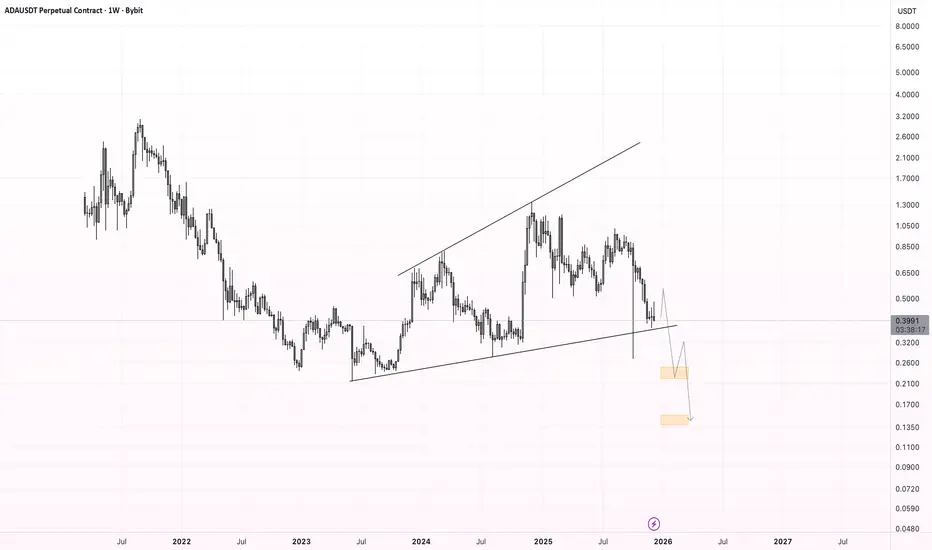
ADA/USDT — Major Reversal or Deep Breakdown?ADA/USDT on the weekly timeframe has returned to one of the most decisive zones since 2022.
The 0.275–0.22 region is not just another support — it is a historical demand and accumulation block where major reversals have repeatedly formed.
This week, ADA once again tapped this zone with a long downside wick, signaling a massive liquidity sweep. This is a clear indication that larger players are active here, collecting liquidity before choosing the next major direction.
This chart doesn’t reflect a simple pullback — it reflects the early stages of a major battle between long-term buyers and the dominant sellers who have controlled the trend since 2021.
---
🔥 Key Pattern & Market Dynamics
1. Long-term downtrend structure
Since the macro top, ADA has continued forming lower highs, maintaining bearish pressure in the weekly structure.
2. Strong accumulation demand (0.275–0.22)
This area has produced three major reversals in the past.
The latest reaction suggests either:
A liquidity hunt before a potential rebound, or
The beginning of a deeper breakdown if buyers fail to defend it.
3. Increased volatility
A wick of this size is rarely random.
It often precedes large directional moves, especially on the weekly chart.
---
📈 Bullish Scenario (If the Zone Holds)
A bullish continuation requires clear conditions:
✔ Strong rejection from 0.275–0.22
✔ Weekly close above the pivot zone at 0.40–0.45
✔ Formation of a higher-low structure
If confirmed, ADA may begin a structural trend reversal with:
Target 1: 0.65
Target 2: 1.00 – 1.20 (if volume expansion supports the breakout)
This would mark a shift from long-term weakness to medium-term recovery.
---
📉 Bearish Scenario (If the Zone Breaks)
A weekly close below 0.22 would be a significant bearish signal:
Historical demand fails
Market structure breaks down
A deeper markdown phase begins
Downside targets:
0.16 — next major psychological support
0.09 — historical accumulation zone
A loss of 0.22 would be one of ADA’s strongest bearish confirmations in years.
---
🧠 Core Message for Traders
This is not an ordinary support level —
this is a macro decision point that will define ADA’s direction for months ahead.
ADA now stands exactly where it stood in 2022–2023, and from this zone the market has only two paths:
➡ Hold the historical accumulation zone and reverse upward
or
➡ Break below it and enter a deeper long-term downtrend
Professional traders do not guess —
they wait for the weekly close, analyze volume, and watch how the market reacts to this key zone.
---
#ADA #ADAUSDT #Cardano #CryptoAnalysis #PriceAction #MarketStructure #WeeklyChart #SupportZone #CryptoTrading #CryptoOutlook

ONLY WAY IS UP - SUNDAEHear me now, the only way is up for SUNDAE. May drop down to the .004cent range but that will be a perfect buying opportunity.
- current market cap is 12million
- current TVL is 14.3million
- Sundae Labs is already familiar with Hydra (which is under construction) but would drastically reduce fees and increase transaction speed
- Governance to come
- Reduced fees for SUNDAE holders to come
SUPER UNDERVALUED. This will likely be a 200million DEX at minimum during the next bull run

ADAUSD downtrend continuation below 4,590 resistanceThe ADAUSD pair continues to display a bearish outlook, in line with the prevailing downward trend. Recent price action suggests a corrective pullback, potentially setting up for another move lower if resistance holds.
Key Level: 4,590
This zone, previously a consolidation area, now acts as a significant resistance level.
A failed test and rejection at 4,590 would likely resume the bearish momentum.
Downside targets include:
3,580 – Initial support
3,160 – Intermediate support
2,830 – Longer-term support level
Bullish Scenario (breakout above 4,590):
A confirmed breakout and daily close above 4,590 would invalidate the bearish setup.
In that case, potential upside resistance levels are:
4,880 – First resistance
5,350 – Further upside target
Conclusion
ADAUSD remains under bearish pressure, with the 4,590 level acting as a key inflection point. As long as price remains below this level, the bias favours further downside. Traders should watch for price confirmation around that level to assess the next move.
This communication is for informational purposes only and should not be viewed as any form of recommendation as to a particular course of action or as investment advice. It is not intended as an offer or solicitation for the purchase or sale of any financial instrument or as an official confirmation of any transaction. Opinions, estimates and assumptions expressed herein are made as of the date of this communication and are subject to change without notice. This communication has been prepared based upon information, including market prices, data and other information, believed to be reliable; however, Trade Nation does not warrant its completeness or accuracy. All market prices and market data contained in or attached to this communication are indicative and subject to change without notice.

Cardano - This coin is holding strong!🔋Cardano ( CRYPTO:ADAUSD ) still remains bullish:
🔎Analysis summary:
Despite this month's massive crypto crackdown, Cardano already recovered about +100%. We simply saw a perfect rejection of a major confluence of support, pushing price higher. Soon, Cardano will break out of the triangle and a bullish breakout remains rather likely.
📝Levels to watch:
$0.8
SwingTraderPhil
SwingTrading.Simplified. | Investing.Simplified. | #LONGTERMVISION
