ADA : LIVE TRADE
Hello friends
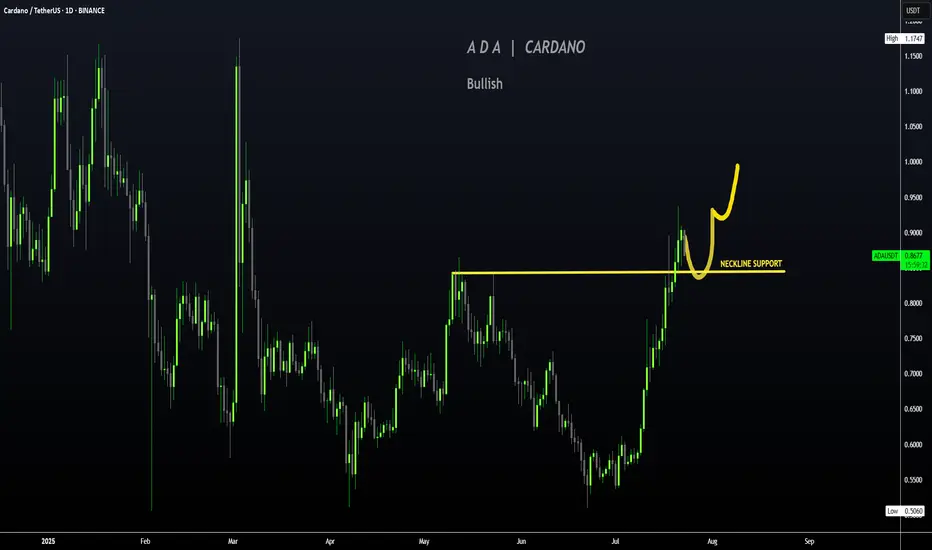
According to the channel in which the price is located, you can see that every time it reached support, we had a growth, and now that it has reached the same support, we can expect another growth.
This analysis is purely technically reviewed and is not a buy or sell recommendation, so do not act emotionally and observe risk and capital management.
*Trade safely with us*
Adausdtlong

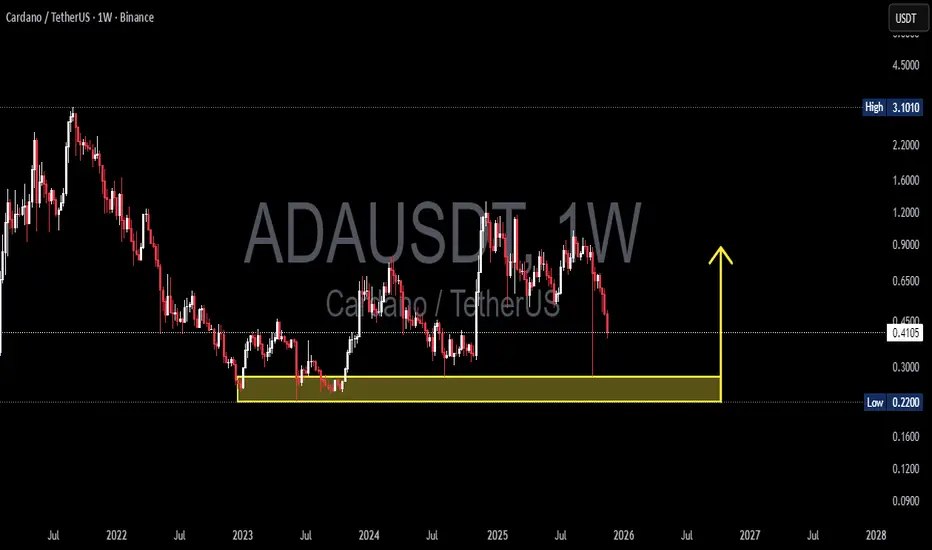
ADA/USDT — Major Reversal or Deep Breakdown?ADA/USDT on the weekly timeframe has returned to one of the most decisive zones since 2022.
The 0.275–0.22 region is not just another support — it is a historical demand and accumulation block where major reversals have repeatedly formed.
This week, ADA once again tapped this zone with a long downside wick, signaling a massive liquidity sweep. This is a clear indication that larger players are active here, collecting liquidity before choosing the next major direction.
This chart doesn’t reflect a simple pullback — it reflects the early stages of a major battle between long-term buyers and the dominant sellers who have controlled the trend since 2021.
---
🔥 Key Pattern & Market Dynamics
1. Long-term downtrend structure
Since the macro top, ADA has continued forming lower highs, maintaining bearish pressure in the weekly structure.
2. Strong accumulation demand (0.275–0.22)
This area has produced three major reversals in the past.
The latest reaction suggests either:
A liquidity hunt before a potential rebound, or
The beginning of a deeper breakdown if buyers fail to defend it.
3. Increased volatility
A wick of this size is rarely random.
It often precedes large directional moves, especially on the weekly chart.
---
📈 Bullish Scenario (If the Zone Holds)
A bullish continuation requires clear conditions:
✔ Strong rejection from 0.275–0.22
✔ Weekly close above the pivot zone at 0.40–0.45
✔ Formation of a higher-low structure
If confirmed, ADA may begin a structural trend reversal with:
Target 1: 0.65
Target 2: 1.00 – 1.20 (if volume expansion supports the breakout)
This would mark a shift from long-term weakness to medium-term recovery.
---
📉 Bearish Scenario (If the Zone Breaks)
A weekly close below 0.22 would be a significant bearish signal:
Historical demand fails
Market structure breaks down
A deeper markdown phase begins
Downside targets:
0.16 — next major psychological support
0.09 — historical accumulation zone
A loss of 0.22 would be one of ADA’s strongest bearish confirmations in years.
---
🧠 Core Message for Traders
This is not an ordinary support level —
this is a macro decision point that will define ADA’s direction for months ahead.
ADA now stands exactly where it stood in 2022–2023, and from this zone the market has only two paths:
➡ Hold the historical accumulation zone and reverse upward
or
➡ Break below it and enter a deeper long-term downtrend
Professional traders do not guess —
they wait for the weekly close, analyze volume, and watch how the market reacts to this key zone.
---
#ADA #ADAUSDT #Cardano #CryptoAnalysis #PriceAction #MarketStructure #WeeklyChart #SupportZone #CryptoTrading #CryptoOutlook
#ADAUSDT: Two Targets Both Possible, Let's See How Price MoveADAUSDT collapsed following the announcement of new tariffs on China, which caused fear in the cryptocurrency market and affected minor currency pairs. This led to a significant drop in the price of ADAUSDT. A minor decline may occur before the price reverses. There are two potential targets for the price to reach.
Entry area:
- We have identified the key area where a price reversal is likely to occur.
We wish you the best of luck and trade safely.
Team Setupsfx
ADAUSDTBINANCE:ADAUSDT is wait for breakout trendline for start bullish trend so we wait for this breakout and ADA give best signal for buy.

ADAUSDTNothing special, after October 10, we found a "bottom" in this cycle, where it will probably move in a chaotic direction, shedding shorts and longs on its way. The yellow dotted line indicates the area where a "turn" is possible (it is possible to make some decisions, political or drastic regulatory changes or in that spirit)
Red showed resistance zones in case of a possible reversal. And a break of the negative trend on TF 1D.There is also weak support, which may act as a "hope" zone with a possible slight increase and a rapid decline in price to the lows that we have already tested on October 10, and clearly rested in the support zone.
But I wouldn't be surprised if we're in the near future, it will bounce back significantly below October 10th.

ADAUSDTIn this week’s BINANCE:ADAUSDT analysis, after a bearish reaction from the 0.85 USD zone, the price remains consolidating below previous highs, showing weakness in bullish momentum on the daily timeframe. If the current support fails, a move toward lower zones is likely before a potential bullish correction begins from support levels.
Supports:
* 0.59 USD
* 0.51 USD
Resistances:
* 0.69 USD
* 0.85 USD

#ADA/USDT Spot LONG#ADA
The price is moving within a descending channel on the 1-hour frame, adhering well to it, and is heading for a strong breakout and retest.
We have a bearish trend on the RSI indicator that is about to be broken and retested, which supports the upward breakout.
There is a major support area in green at 0.6335, which represents a strong support point.
We are heading for consolidation above the 100 moving average.
Entry price: 0.6721
First target: 0.6868
Second target: 0.7001
Third target: 0.7184
Don't forget a simple matter: capital management.
When you reach the first target, save some money and then change your stop-loss order to an entry order.
For inquiries, please leave a comment.
Thank you.

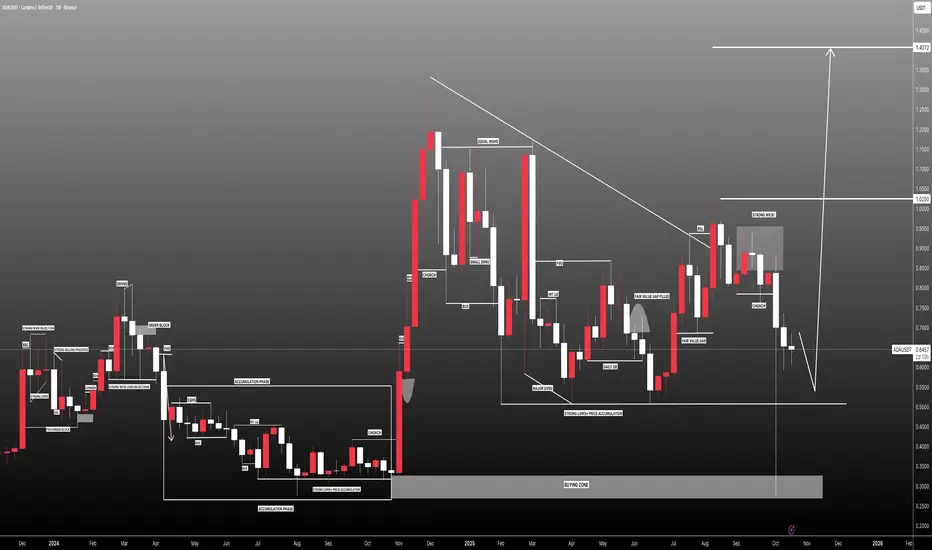
ADA/USDT — at a Make-or-Break Zone: Will Bulls Defend?Cardano (ADA) is now sitting at a critical decision point, testing the major demand zone between 0.55–0.625 USDT — a key level that has acted as the foundation for multiple rallies since early 2024. This zone represents the battlefield between long-term buyers and sellers, where price reactions have historically triggered large directional moves.
Recently, ADA experienced a deep liquidity sweep, leaving a long wick below the zone — a common sign of stop-loss hunting or institutional accumulation. Such moves often occur before a trend reversal, making this area one of the most strategic zones to watch in the coming weeks.
---
Pattern and Market Structure Analysis
The yellow block (0.55–0.625) is a macro demand/support zone, repeatedly tested and defended by buyers.
Main resistances are located at 0.9239, 1.2075, and 1.3264, forming the upper bounds of ADA’s broader trading range.
The overall structure shows a wide consolidation phase, potentially signaling re-accumulation if the current zone holds.
The long wick beneath support reflects a liquidity grab, often used by smart money to fill large buy orders before an upward move.
---
Bullish Scenario — Potential Start of a Major Rebound
1. Price holds and rebounds from 0.55–0.625 with a strong bullish reversal candle (bullish engulfing, hammer, or pin bar).
2. Increasing buying volume confirms accumulation interest at this level.
3. A clean breakout and daily close above 0.9239 would confirm bullish continuation toward 1.20 and 1.32.
4. Formation of a higher low above 0.625 will further validate a new uptrend structure.
🎯 Bullish Targets:
TP1: 0.92
TP2: 1.20
TP3: 1.32
📉 Suggested Stop Loss: Below 0.53 (outside the demand zone).
Narrative:
If this pattern confirms, ADA could begin a new major recovery wave, potentially marking the start of a strong uptrend cycle heading into 2026.
---
Bearish Scenario — Breakdown and Failed Retest
1. Price fails to hold above 0.55 and closes decisively below the yellow zone.
2. High selling volume confirms continuation pressure.
3. A failed retest of 0.55–0.625 as new resistance strengthens bearish momentum.
4. The next key downside targets are 0.40 and 0.27, both major liquidity levels.
🎯 Bearish Targets:
TP1: 0.40
TP2: 0.27
📈 Confirmation: Daily candle close below 0.55 with strong volume.
Narrative:
If this support collapses, ADA could enter a mid-term redistribution phase, potentially setting a new bottom before the next macro bull run.
---
Conclusion and Strategic Outlook
The 0.55–0.625 zone is ADA’s make-or-break region — a critical level that will likely define its direction for the months ahead.
Holding the zone could trigger a strong reversal rally toward 0.92–1.32.
Losing it would confirm a bearish continuation toward 0.27.
Traders should wait for confirmation through daily candle closes and volume surges before committing to major positions.
This zone offers both a high-risk accumulation opportunity for patient investors and a decisive pivot area for short-term traders.
---
#ADA #Cardano #ADAUSDT #CryptoAnalysis #TechnicalAnalysis #PriceAction #SupportZone #ReversalZone #Altcoin #CryptoMarket #DemandZone

#ADAUSDT: Is the crypto hype finally over? ADAUSDT is likely to drop first then it can reverse and continue the bullish move upwards of previous all time high. Before we can confirm any entry on this pair we need strong confirmation which will allow us to predict a correct and accurate swing move.
If you like the work then do consider liking and commenting on the idea.
Team Setupsfx_❤️

BUY AND HOLDHello friends
You see that after the good rise we had, the price is correcting, which is a natural thing and there is no need to worry, and in these corrections, you can buy in steps with capital and risk management and move with it to the specified goals.
Note that the holding period is at least 3 months, so be patient and observe capital management.
*Trade safely with us*

ADA/USDT; FREE SIGNALHello friends
According to the market cycle, you can see that every time after the price growth we had a correction and now it seems that the price wants to exit the correction and have a new growth. If the support levels continue, the price can move to the specified targets.
*Trade safely with us*

ADA/USDT: Bullish Rise to 0.96?BINANCE:ADAUSDT is gearing up for a bullish move on the 4-hour chart , with an entry zone between 0.87-0.85 near a key support and trendline.
The target at 0.96 aligns with the next resistance, signaling strong upside potential. Set a stop loss on a close below 0.8450 to manage risk effectively.
🌟Entry is suitable even right now with proper risk management.
📝 Trade Plan:
✅ Entry Zone: 0.85 – 0.87 (support + trendline area)
❌ Stop Loss: Daily close below 0.8450 to manage risk
🎯 Target: 0.96 (next resistance)
Ready for this lift-off? Drop your take below! 👇

$ADA - bullish area above 0.800$ support. CRYPTOCAP:ADA - bullish area above 0.800$ support.
Back to 1.00$ soon? 📈

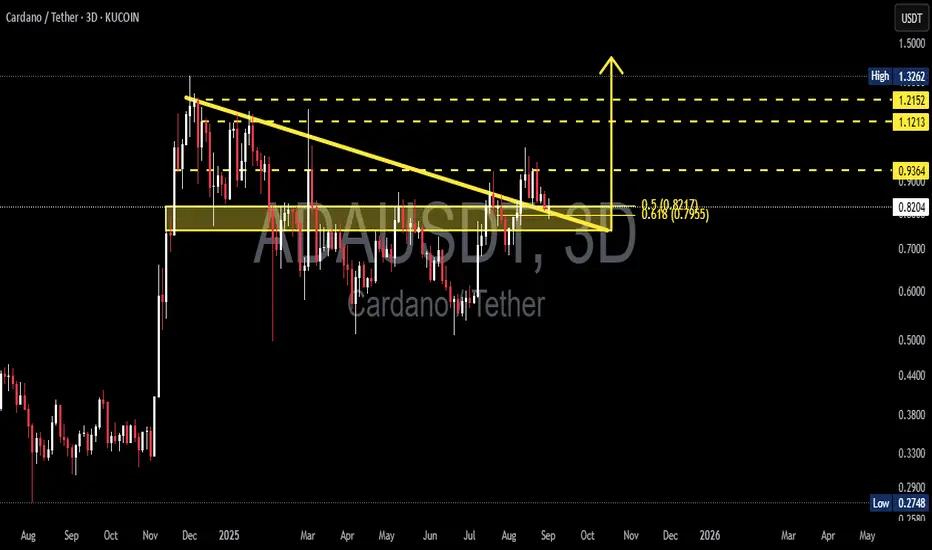
ADA/USDT — Breakout & Retest at a Critical Fibonacci Zone!
Currently, Cardano (ADA/USDT) is at a decisive point on the 3D timeframe, where price has just broken out of a mid-term downtrend line and is now retesting a very strong support area.
---
🔎 Technical Structure & Pattern
Downtrend line has been broken to the upside → sign of trend reversal.
Price is retesting a confluence support zone (0.78 – 0.83) consisting of:
Historical support/resistance (yellow box).
Fibonacci retracement 0.5 (0.8217) and 0.618 (0.7955).
This setup forms a classic “breakout & retest” pattern — where old resistance potentially flips into new support. If it holds, ADA could confirm a mid-term bullish continuation.
---
🟢 Bullish Scenario
If the price holds and closes above 0.795–0.821, bullish momentum remains valid.
Potential upside targets:
R1 = 0.9364 (short-term swing target).
R2 = 1.1213 (strong confirmation of trend shift).
R3 = 1.2152 (key resistance before major highs).
R4 = 1.3262 (major high & psychological zone).
In this scenario, ADA could stage a significant rally if market sentiment supports it.
---
🔴 Bearish Scenario
If the price breaks down below 0.7955 (Fib 0.618), the bullish setup may turn into a false breakout.
Downside targets to watch:
Previous consolidation range around 0.60–0.70.
Deeper support near 0.44.
Worst-case scenario: retesting the major low at 0.27.
---
📌 Conclusion
ADA is currently at a make-or-break level.
As long as price holds above 0.795–0.821, the bias remains bullish with targets at 0.94 – 1.12 in the mid-term.
A failure to hold this zone would shift bias to bearish, opening the way for deeper corrections.
Traders should closely monitor price action & volume around this retest, as it will determine ADA’s next big move.
---
📝 Notes
Always apply risk management (stop-loss & position sizing).
Wait for 3D/weekly candle close confirmation.
This is technical analysis, not financial advice.
#Cardano #ADA #ADAUSDT #CryptoBreakout #CryptoTrading #TechnicalAnalysis #PriceAction #Altcoins #CryptoSetup
ADA : BUY OR SELL?Hello friends
Well, after the decline we had, the price was able to create a small channel in the specified support area, which indicates the accumulation of the price, and if the support is maintained and the channel is broken, the price can move to the specified targets.
Otherwise, and if the support is broken, the decline will continue with a valid formation...
*Trade safely with us*

ADA Long to 2$ADA Long to 2$
as this coin is in the channel I expected to move to the top of channel again and then it will reached to 3$.

ADAUSTBINANCE:ADAUSDT is up-trend. We open buy in any pollback. If keep price trend above $0.9120 we see next level in $1.1310 and more.
Support: 0.9120 - 0.8240 - 0.7600 - 0.6970
Resistance: 0.9980 - 1.1310 - 1.2400
Please control risk management in your trades.⚠️

#ADA/USDT Trading Strategy ( ADAUSDT ) Buy Trade Setup.#ADA
The price is moving within an ascending channel on the 1-hour frame, adhering well to it, and is on track to break it strongly upwards and retest it.
We have support from the lower boundary of the ascending channel, at 0.6712.
We have a downtrend on the RSI indicator that is about to break and retest, supporting the upside.
There is a major support area in green at 0.6736, which represents a strong basis for the upside.
Don't forget a simple thing: ease and capital.
When you reach the first target, save some money and then change your stop-loss order to an entry order.
For inquiries, please leave a comment.
We have a trend to hold above the 100 Moving Average.
Entry price: 0.7395.
First target: 0.7634.
Second target: 0.7943.
Third target: 0.8324.
Don't forget a simple thing: ease and capital.
When you reach the first target, save some money and then change your stop-loss order to an entry order.
For inquiries, please leave a comment.
Thank you.

ADAUSDT - buy it before it's too late!If you’re looking for safe trading with solid guaranteed profits, then your main focus should be on major coins — and when we talk major coins, ADA should definitely be on your radar.
ADA just completed a Falling Wedge breakout on the 3-day timeframe, followed by a successful retest.
It also broke and retested the 0.618 Fibonacci level — what more confirmation do you need to buy?
Your next target from here?
At least +100% gain.
Best regards:
Ceciliones🎯

CARDANO | ADA Creeping UP to $1Cardano has made a big move in recent weeks, boasting a 77% increase.
If you were lucky enough to buy in around 30 or 40c, this may be a great TP zone:
Looking at the Technical Indicator (moving averages), we can see the price makes its parabolic increases ABOVE - which is exactly where we are currently beginning to trade. This could mean more upside is likely, and the 1$ zone is a big psychological resistance zone:
A continuation of the current correction may look something like this for the next few weeks:
_____________________
BINANCE:ADAUSDT
ADAUSDT Breaks Long-Term Downtrend – Critical Support Retest!The ADAUSDT pair is showing a compelling technical setup. The price has successfully broken out of a long-term descending trendline (yellow line) that had been acting as dynamic resistance since late 2024. This breakout came with strong momentum, signaling a potential shift from a bearish trend to a bullish reversal.
After the breakout, price managed to rally up to minor resistance around $0.90, but is now pulling back and retesting the key support zone (highlighted yellow box) — a previous strong resistance area now potentially flipping into support.
---
🟢 Bullish Scenario:
If the price holds above the $0.80 - $0.83 support zone, the break-and-retest structure will be validated.
A successful bounce from this area could push ADA back toward:
$0.90 (current minor resistance)
$1.13 (psychological and horizontal resistance)
$1.23 (previous supply zone)
$1.32 (recent local high)
A confirmed bullish continuation will be more convincing if the price forms a higher low and breaks above $0.90 with strong volume.
---
🔴 Bearish Scenario:
If ADA fails to hold the $0.8281 support and falls back below the descending trendline, then:
It may re-enter the previous range and test lower support around $0.75 or even $0.65.
This would suggest a potential false breakout and return to bearish territory.
Watch for bearish candlestick confirmations below $0.80 as an early warning.
---
📌 Pattern Insights:
Descending Trendline Breakout: Suggests a possible long-term trend reversal.
Break & Retest Structure: Price is currently testing the previous resistance zone as new support.
Layered Resistance Zones: Several clear resistance levels above provide logical targets for a bullish rally.
---
📊 Conclusion:
ADAUSDT has printed an early signal of a bullish reversal by breaking out of a long-standing downtrend. However, the sustainability of this trend depends heavily on the ability of price to hold the $0.80 - $0.83 support zone. Look for bullish confirmation candles in this area for a safer long entry.
#ADAUSDT #Cardano #CryptoBreakout #TechnicalAnalysis #Altcoins #BreakoutSetup #BullishRetest #CryptoChart #SupportAndResistance #PriceAction #TrendReversal

ADA / USDT lying on support ,ready to bounce and break trendlineADA/USDT broke above horizontal resistance and is now retesting from the trendline above. If it holds this support and bounces, a strong move toward $1.00, $1.20, and even $1.40 could follow. One to watch closely in the coming days.

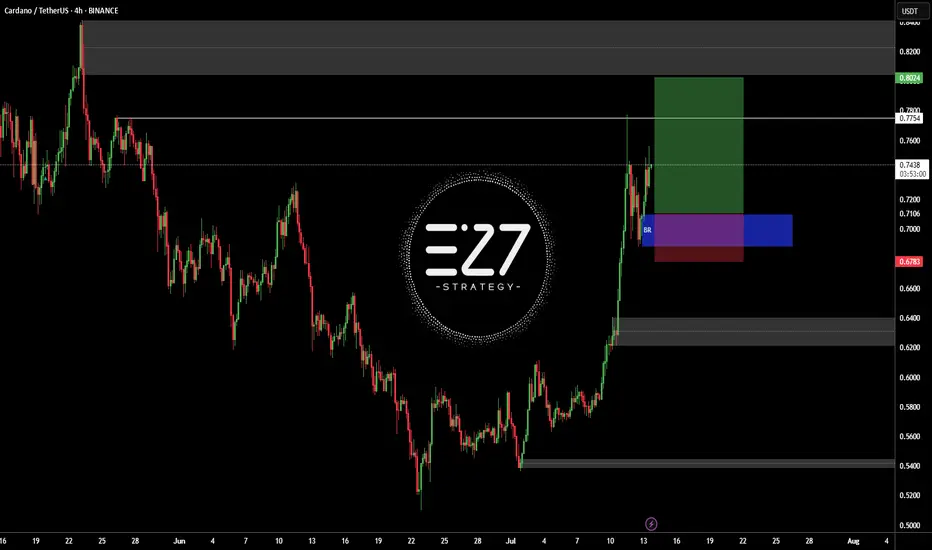
ADAUSDTBINANCE:ADAUSDT in up-trend and my open position buy in latest sowing low.
Best entry: 0.6952 - 0.7259
Target: 0.7754 - 0.8024
Stop loss: 0.678
Please control RISK management