XAR- AEROSPACE AND DEFENSE 🚀one of our favorite ETFs 🚀Apologies for the many 'rockets' lately, we have been using the rocket on our Bitcoin chart but originally the rocket things started from and belongs to XAR AEROSPACE AND DEFENCE ETF.
Fundamentally, with the huge amounts being invested in aerospace (and defense), this sector is expected to fly and to thrive.🚀
Our market segmentation analysis has proved to help us 'Buy the strongest' and 'sell the weakest', for years now.
XAR is an ETF which can deliver excellent returns for us in 2021 to 2025.
FROM STATE STREET:
The SPDR® S&P® Aerospace & Defense ETF seeks to provide investment results that, before fees and expenses, correspond generally to the total return performance of the S&P® Aerospace & Defense Select Industry® Index
Seeks to provide exposure to the Aerospace & Defense segment of the S&P TMI, which comprises the following sub-industries: Aerospace & Defense
Aerospace

Strategy on how to trade Lockheed MartinHey guys! Hope this analysis finds you having an incredible week, and ready for an even better weekend!
Please kindly like this chart if you found this content helpful!
Ok let's dive in!
Lockheed Martin is still officially in a bear market. It is still 30% away from its all time high, with the technicals on the weekly indicating very tough days ahead for LMT holders.
Tale of two stories here when it comes to very good fundamentals but very poor technical indicators.
Ratio Time
• P/E 14.64 (Very attractive)
• Forward P/E 13.08 ( Boeing Forward P/E is 156.29 !!)
• P/ FCF 27.57
• Debt/Eq 2.56 (Normally I would say this is really high in a different sector, but money is cheap right now and these guys are in a field that requires massive capital output...this is why if I see a level this high in a utility provider I am ok, but if I see a level this high in a financial or tech I run!)
• EPS 23.4
• EPS this Y +25.8%
• Sales Q/Q +8.7%
• ROE +171% (again justifies that debt/equity level as they use debt very...prudently)
• ROI +47%
• Gross Margin 13.3%
• Net Margin 10.2% (Stunning) ..especially when we see the rise in price recently in Boeing . Boeing has a 2.9% GM and a -7% Net Margin guys. Yes BA are losing money with a forward P/E of 156??
Holder Metrics
• Insiders Own 0.08%
• Insider Transactions over past 3 M (0.00)
• Institutions Own 77.9%
• Institution 3 Month Transactions -0.42%
So what do we do when the technicals say run and the fundamentals say buy? We listen to both!
The strategy I like to take ahead a potential trade when I see two conflicting tales are either run. Or wait for the technical indicators to display signs of a potential bottoming pattern. Next Chart will display pivot points . Finding a position at a lower price heading into the mean with good underlying fundamentals is a much better approach, although it takes patience and time as I think the idea of playing a short off the TA or a long strictly off the FA would be... short sighted. Best tactic is to embrace both and wait.
Pivot points below!
Friend please share with me & the wonderful TradingView community how you think we should trade Lockheed Martin! If you have a LMT chart yourself please be especially sure to share it with me!

Virgin Galactic SPCE Long 60%+Long idea for SPCE.
I identify a double bottom pattern on the daily chart, that may be doing a retest on the neckline (red rectangle area), which happens to be the 0.618 retracement and also a weekly support at around 23 USD.
If the retest is successful we may be looking for a 60% upside on this trade in the long term. Invalidation of this idea, is if it does not hold weekly support.
Virgin Galactic recently had a test flight, and the mission was to get VSS Unity to the space, unfortunately the objective of the mission was not achieved, but the spaceships and crew flown back and landed successfully on the spaceport without any problems, but that caused the recently price drop.
If the following test is successful SPCE will soar.
Please let me know what you think on the comments below.
Happy new year everybody!

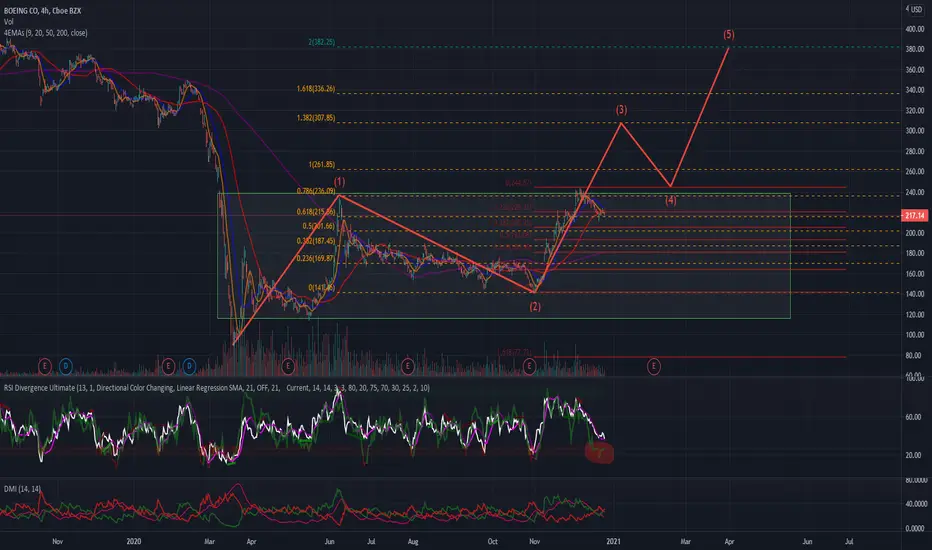
Boeing Update with FIB Levels & 5 Wave SequenceIt appears BA is currently in Wave 3 of a possible 5 Wave sequence. Each wave has it's own series of impulse waves within the larger overall wave. Key areas to look for as the chart develops:
215.37 has been a good area of supports and any drop below this could bring the following retracement levels:
Retracement Levels:
(.382) - $205.25 - Hit this level in pre-market on 12/21/20 and immediately sprung to 223.65
(.50) - $193.08 - For FIB Level traders, this is generally the level they look to take a "starter position"
(.618) - $180.90 - Considered a great FIB level for taking a long position to the upside.
*** Any break below the .618 level would be a major concern and not healthy ***
Most FIB traders are looking for "profit taking" at the following extension levels:
(1: $261.85)
(1.382: $307.85)
(1.618: $336.26)
The MFI ( Money Flow Index) continues to be oversold on both the 4HR & 1 Day timeframes signaling a bounce could be coming soon. The weekly chart is setting up a possible Cup & Handle so keep your eyes on it as the charts progress.
GL
XAR - We took take profits but attempting a small SELLTime for a correction here as the asset did us extremely well, we Bought it at 91.3 and it's not out of steam at 115!

Howmet Aerospace: Hugely Undervalued with Promising Upside(Pt.1)Howmet manufactures components for the aerospace, ground transportation, defense, and industrial sectors including aluminum sheet, plate, extrusions, and other specialized parts.
November's Q3 earnings report showed a 37% decrease in revenue Y.O.Y compared to Q3 2019. This was likely due to the pandemic's impact on commercial air travel and aircraft manufacturing as well as Boeing's decision to halt production of the 737 Max.
Currently trading just under $25.60, it is massively undervalued given its high profile contracts with giants like Boeing, Airbus, and Daimler. Distribution of the vaccine and a return to normalcy with increased air travel will raise demand for its products used in commercial aircraft production. Boeing also recently announced that it has resumed production of its 737 Max model, which will help Howmet's aerospace division further.
The global economic recovery and subsequent rise in household income(followed by consumer spending), will likely lead to a bump in new car purchases and production. This would bolster its already strong ground transportation division.
The Daily Chart shows decently high volume and a strong uptrend. With the 50 day moving average of closing prices recently crossing above(and staying above) the 200 day moving average, things look very promising.

Hexcel corp w 48 2020. Long 48-72 till 2023Mothly
Restoration after Covid + postitve news from Vaccine
Weekly
Uptrend confirmed
Daily
Open LONG 48
SL 43
TP 72
RR 5

Spirit Aero. LONG 34-50-62.Monthly
Strong Downtrend due to Covid and lost of orders on Boeing.
Weekly
Strong uptrend with Gaps
Restoration of industry.
After retest ( Double Bottom)
Daily
Uptrend
OPEN LONG 34
SL 29
TP 50 and 62
RR 6

AerojEt Long from 37. w49 2020Monthly
Corretion in uptrend.
Could be bought
Weekly
Dowrntrend
Wave 4.
RSI good to buy
Daily
Due to vaccine i expect growth of aerospace and AJR in particular.
Open 37
SL 33
TP 54
RR 4.3

XAR AEROSPACE AND DEFENCE 🚀our favorite ETF is in Orbit 🚀We have been doing so well on AEROSPACE AND DEFENCE ETF and happy to say it has just broken 2 majpr resistance levels in 1 session!
We are keeping our buy positions until it reached record highs and will be keeping an eye on this for the future.. for a long time
Fundamentally, aerospace and defence are industries that have a bright future and are becoming increasingly important

XAR ETF-Time to increase our BUY positionsXAR AEROSPACE AND DEFENCE ETF -
Been doing really well with our previous BUY ideas. Time to increase our Buy positions here

Northop Grumman a buy near trend line supportDefense contractor Northop Grumman fell hard toward trend line support both before and after its earnings report last Friday, despite a solid beat of analyst expectations. The fall has occurred as analysts adjusted forward estimates of earnings and sales downward for the next two years. Despite the downward revisions, Northop Grumman remains a growth company, with PEG ratio of 1.8.
The share price has fallen much faster than earnings expectations, making NOC a very attractive buy as it approaches support. Let's look at NOC's current price ratios compared to its three-year median price ratios on earnings dates. Here is the implied upside from the current price ratio to the median price ratios on earnings dates over the last three years:
P/E: 21%
Fwd P/E: 18%
P/S: 17%
Fwd P/S: 21%
P/D: 17%
Fwd P/D: 23%
P/B: 31%
P/FCF: 81%
Sentiment on NOC is positive, with an 8.3/10 analyst summary score (average rating Buy). The news environment for the company is good, thanks to several US government contracts recently signed, and several others recently successfully completed. Open interest on NOC is about evenly split between bulls and bears, but the 30-day average of trading volume favors the bulls.
NOC is nearing support from July lows and a seven-month trend line. I will look to make a buy around 287.

Collecting Premium on UALPre-market the UAL 20NOV20 $40 call shows an Open interest of 2608. The Probability of the option being in the money is only 27.5% and there is also a 72.25% implied volatility included in the price. With a 72.5% chance that this option will expire worthless we can create a simple spread to be able to collect the premium of the option that is around 30 days to expiration.

XAR (Aerospace and Defense) ETF for a BUYLong awaited recovery of aerospace and defense sector, probably time for a recovery here as the Feds are examining to support this industry in the next round of stimulus.
Let's see if we finally have a proper lift-off

monthly and daily both say short lousy trend line indicator tool
upside down cup & handle
Perfectly Rounded top
Monthly chart to daily chart
I'm not a professional but I'm probably right on this one

Trading within the rangeUsing previous candles to aid in understanding what the patterns have been within a certain underlying can assist in being able to identify high correlation areas that contain a greater probability of price action.
Using a mixture of fibonacci retracement tools, standard deviation and trend lines we can create a high correlation area that allows us to be able to have a target price with our trading strategy and exit price points as well.

Boeing Range boundStruggling to pick a direction many airlines stocks have been stuck in a range bound pattern which is also seen here in Boeing (BA). Currently back towards the center of the range there is an equal opportunity for both sides to see some price action. Although As volume starts to dwindle and less activity is seen for new orders of aircraft, the outlook is unclear for whats to come next.
Playing uncertainty in your favor can be of benefit when shorting options spreads.

RTX - LONG - 5YR+ HOLD - VALUE! NOT A FINANCIAL ADVISOR NOR IS THIS FINANCIAL ADVICE. DO YOUR OWN RESEARCH BEFORE BUYING AND SELLING. TRADE AT YOUR OWN RISK.
MILITARY INDUSTRY IS STEADY CONTRACTS -- EVEN DURING A PANDEMIC
SOLID TREND UPWARDS TOWARD ATH'S
TRADING AT A MASSIVE DISCOUNT -- 100%+ GAP BETWEEN ATH AND MARCH LOW
SL AT 56-52
T1 67
T2 75
T3 84

LHX long playLHX has a nice set up, ready for a swing upward. The Bollinger band is the tightest it's been for months, and other companies in this industry have been rallying nicely. I'm considering a straddle, but I honestly think LHX will be majority upside move.
Target price is $200
9/18 185 Calls
10/16 190 Calls

Boeing finally showing a trendTechnical analysis
Boeing showing support at the trend-line forming since the march lows.
A close below $152 is a break of the lower highs trend
Sentiment, technicals, and fundamental views for Boeing are weak. However:
risk-reward-ratio is very attractive
Still a global duopoly (Boeing and Airbus)
Heavy support from the government to help it succeed

RTX Long into EarningsPlaying for a sector rotation from big tech into value. The Aerospace sector has been beaten down and I think there is some short-term opportunity here as drug makers enter phase 3 trials at lightning speed.
Not to mention defense spending could continue higher.

DFEN Poised to Strike3x Aerospace & Defense ETF
Increase in volume w/ bullish divergence.
This is our play of the week for the week of 7/20.

UAV TechHoneywell is expanding their drone technology services. Growing their satellite network and increasing the services which they provided geared towards drones.
