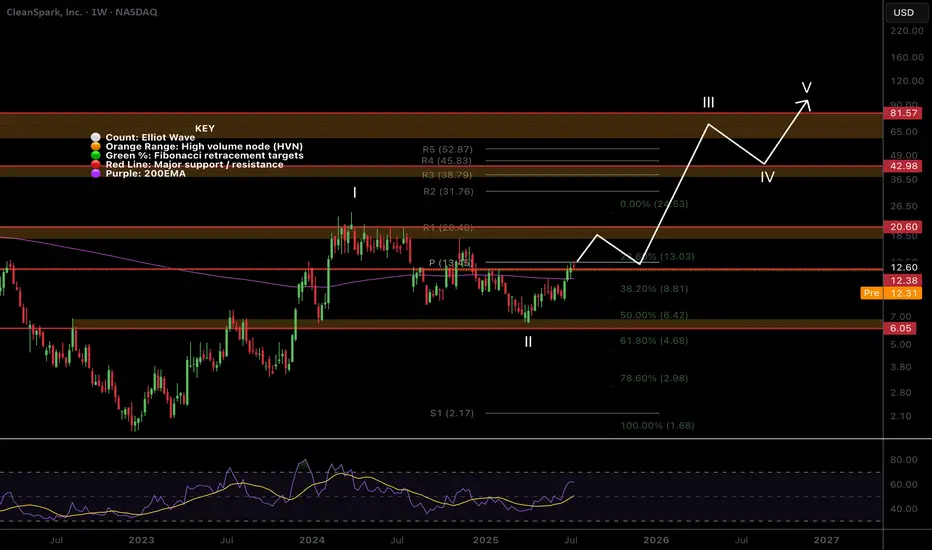
$CLSK Trapped between Critical Resistance and Support?NASDAQ:CLSK Shot through the weekly 200EMA and hit the weekly pivot resistance and was rejected into the High Volume Node (HVN) just below.
If the count is correct we should see price breakthrough in wave 3 after some consolidation and continue up after wave 2 tested the .618 Fibonacci retracement and HVN as support.
Heavy resistance HVN coupled with the R1 pivot at $20.40 will prove another challenge to overcome. Ultimately, if the count is correct AND Bitcoin doesn't tank we can expect a challenge of the all time highs up at $60.
I already closed partial take profit myself at the weekly pivot on a recent trade and will be looking to go long again to the those targets. Make sure to always be taking profits on the way as nobody has a Crystal ball!
RSI is currently printing a bearish divergence on the weekly so we need to see that negated.
Analysis is invalidated below $6.
Safe trading
AI
Earnings HFT gapsThe gaps that form during earnings season on or the next day after the CEO reports the revenues and income for that past quarter are always HFT driven. The concern over the past 2 previous quarters was the fact that the High Frequency Trading Firms were incorporating Artificial Intelligence into their Algos to make automated trading decisions on the millisecond scale. These small lot orders fill the ques milliseconds ahead of the market open in the US and any huge quantity of ORDERS (not lot size) causes the computers of the public exchanges and market to gap up or gap down, often a huge gap.
This can be problematic for those of you who use Pre Earnings Runs to enter a stock in anticipation of a positive to excellent earnings report for this upcoming quarter.
The HFT algos had several major flaws in the programming that did the opposite: The AI triggered sell orders rather than buy order causing the stock price to gap down hugely on good earnings news.
Be mindful that normal gaps due to a corporate event are far more reliable and consistent.
When you trade during earnings season, be aware that there is still added risk of an AI making a mistake and causing the stock to gap and run down on good news.
It is important to calculate the risk factors until it is evident by the end of this earnings season that the errors within the AI programming have been corrected and that the AI will gap appropriately to the actual facts rather than misinterpreted information.

FET – HTF Setup Primed for ExpansionFET is looking strong here from a high time frame perspective — currently sitting around $0.739, well into the discount zone of the macro trend channel.
We’ve got:
✅ Price holding monthly demand
✅ A clear swing higher low forming on the weekly and 3W
✅ Already seen the first expansion leg out of demand
✅ Now potentially loading the next move higher
Zooming out, price is still trading below the midline of the long-term uptrend channel — and a move back to the upper boundary puts targets in the $6 region, aligned with a new higher high.
📈 HTF Structure
Midline rejection flipped support
Demand tested and respected
HL printed after clean retest
370% upside just to retest the prior HH at $3.50
HTF trend structure still fully intact
This setup is also supported by the broader HTF bullish bias across BTC, ETH, and majors, which adds confluence to a potential larger expansion phase for alts — especially strong narratives like AI.
🎯 Targets
🎯 $3.50 = prior high
🎯 $6.00+ = upper channel target / next HTF extension zone
From current levels, risk/reward looks very clean.
1W:
3W:
3M:

Key Insights: Financial Markets Transformation by 2030For years, this page has been my space to share in-depth market research and personal insights into key financial trends. This post reflects my perspective — a strategic outlook on where I believe the digital finance industry is heading.
The financial world is evolving at an unprecedented pace, and it's easy to overlook subtle shifts. But the undeniable fact is that we are now standing at the intersection of three powerful industries — financial markets, blockchain, and artificial intelligence. We are positioned at the cutting edge of technology, where innovation is not a future concept but a present reality.
This post serves as a reference point for future trends and a guide to understanding the transformative forces shaping financial markets by 2030. These are not just facts, but my vision of the opportunities and challenges ahead in this rapidly converging digital ecosystem. Staying ahead today means more than following the market — it means recognizing that we are part of a technological shift redefining the core of global finance.
📈 1. Electronic Trading Evolution
Full transition from traditional trading floors to AI-driven digital platforms.
Integration of blockchain and smart contracts ensures transparency, automation, and risk reduction.
Real-time data analytics democratizes market access and enhances strategic decision-making.
🤖 2. Algorithmic Trading Growth
Accelerated by AI, machine learning, and big data analytics.
High-frequency trading (HFT) boosts efficiency but introduces new volatility factors.
Adaptive algorithms dynamically adjust strategies in real time.
Strong focus on regulatory compliance and ethical standards.
🔗 3. Tokenization of Real World Assets (RWA)
Transforming asset management with projected growth to $18.9 trillion by 2033. (now 18.85B)
Enhances liquidity, accessibility, and transparency via blockchain.
Institutional adoption is driving mainstream acceptance.
Evolving regulations (DLT Act, MiCA) support secure tokenized ecosystems.
🏦 4. Institutional Adoption & Regulatory Frameworks
Digitalization of fixed income markets and exponential growth in institutional DeFi participation.
Key drivers: compliance, custody solutions, and advanced infrastructure.
Global regulatory harmonization and smart contract-based compliance automation are reshaping governance.
💳 5. Embedded Finance & Smart Connectivity
Embedded finance market to hit $7.2 trillion by 2030.
Seamless integration of financial services into everyday platforms (e-commerce, mobility, etc.).
AI, blockchain, and IoT power real-time, personalized financial ecosystems.
Smart contracts reduce operational friction and enhance user experience.
🛡 6. Financial Crime Risk Management
Market expected to reach $30.28 billion by 2030.
AI-driven threat detection and anomaly monitoring strengthen AML compliance.
Blockchain ensures data integrity and automates cross-border regulatory adherence.
Global collaboration (FATF, EU AML) fortifies defenses against evolving financial crimes.
🌍 7. Consumer Behavior & Financial Inclusion
Digital banking bridges the gap for underbanked populations, especially in emerging markets.
Mobile solutions like M-Pesa revolutionize access to financial services.
Biometrics, microfinance, and AI-powered engagement tools foster inclusive economic participation.
🚀 Conclusion
By 2030, financial markets will be defined by technology-driven efficiency, regulatory adaptability, and inclusive growth.
Success will favor those who embrace innovation, leverage automation, and engage in cross-sector collaboration.
The future belongs to agile stakeholders navigating a landscape shaped by AI, blockchain, tokenization, and smart finance connectivity.
Best regards, EXCAVO
_____________________
Disclosure: I am part of Trade Nation's Influencer program and receive a monthly fee for using their TradingView charts in my analysis.

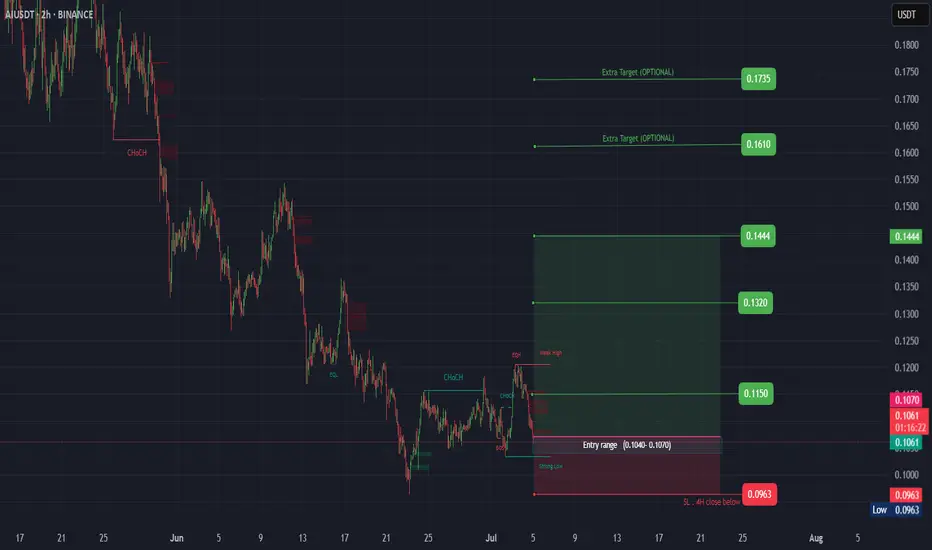
AI ( SPOT )BINANCE:AIUSDT
#AI/ USDT
Entry( 0.1040- 0.1070)
SL 4H close below 0.0963
T1 0.1150
T2 0.1320
T3 0.1444
_______________________________________________________
Golden Advices.
********************
* collect the coin slowly in the entry range.
* Please calculate your losses before the entry.
* Do not enter any trade you find it not suitable for you.
* No FOMO - No Rush , it is a long journey.
AI Looks Bullish (12H)The AI correction has started from the point marked as "start" on the chart.
It seems that wave C has completed, as its time cycle has finished and the price has reclaimed key levels.
As long as the green zone holds, the price can move toward the targets and the red box.
The targets are marked on the chart.
A daily candle closing below the invalidation level will invalidate this analysis.
For risk management, please don't forget stop loss and capital management
Comment if you have any questions
Thank You

#AIXBTUSDT #4h (ByBit) Descending trendline breakout$AIXBT just regained 100EMA support and looks ready for short-term recovery.
BYBIT:AIXBTUSDT.P aixbt.tech

$CLSK Resistance Ready to break?NASDAQ:CLSK is attempting to push above the resistance at $12.4 continuing the path from the recent analysis.
A breakthrough could push it rapidly to the High Volume Node resistance at $18.
Safe trading

JD.cm | JD | Long at $33.16Like Amazon NASDAQ:AMZN and Alibaba NYSE:BABA , I suspect AI and robotics will enhance JD.com's NASDAQ:JD automation in warehousing, delivery, and retail. There is some risk here, like other Chinese stocks, that they could be delisted from the US market if trade/war tensions rise. But I just don't think that is likely (no matter the threats) due to the importance of worldwide trade and investment. I could be way wrong, though...
NASDAQ:JD has a current P/E of 8.1x and a forward P/E of 1.2x, which indicates strong earnings growth ahead. The company is healthy, with a debt-to-equity of 0.4x, Altmans Z Score of 2.6, and a Quick Ratio of .9 (could be better).
From a technical analysis perspective, the historical simple moving average (SMA) band is still in an overall downtrend but starting to level out (accumulation of share area). It is possible, however, that the price may drop into the $20s to close out the existing price gaps on the daily chart as tariff threats arise. But that area is another personal entry zone if fundamentals hold.
Thus, while it could be a bumpy ride and the risk is there for delisting, NASDAQ:JD is in a personal buy zone at $33.16 (with known risk of drop to the $20s in the near-term).
Targets into 2028:
$44.00 (+32.7%)
$52.00 (+56.8%)

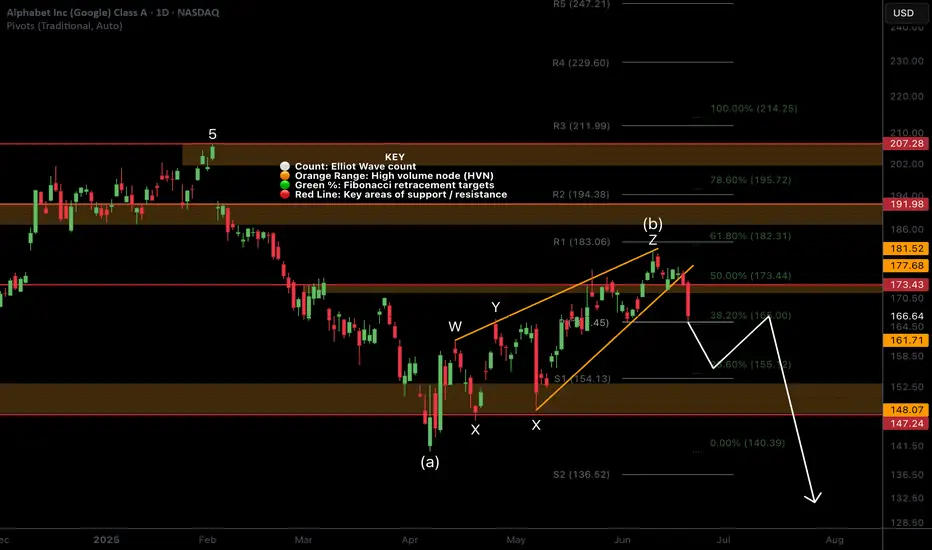
GOOGLE Count changed, Bullish outlook.I have adjusted NASDAQ:GOOG NASDAQ:GOOGL Elliot wave count with a wave 1 completing a leading diagonal backed up by a deep wave 2 correction into High Volume Node support (HVN). We potentially have another 1-2 with fast drop and recovery to the S1 daily pivot which would make long term outlook extra bullish by extending target.
Wave 3 is underway with a target of the all time hime high HVN for wave 5. The next resistance HVN is $191.
Price above the daily pivot and is continuing upwards after testing as support.
Analysis is invalidated below $162 swing low.
Safe trading

$RIOT Continues to Follow PathNASDAQ:RIOT Is sticking closely to the plan testing the bottom and top of the channel multiple times.
Price closing above the weekly 200EMA and weekly pivot Friday will be a very bullish signal. As we have over 4 tests of the upper boundary resistance there is a high probability we break through and continue higher in a high degree wave 3.
Initial targets are the weekly R5 pivot at $39 and all time high at range at $79.
Price tested the .618 Fibonnaci retracement in a complex correction for wave 2.
Analysis is invalidated below the channel support.
Safe trading

$WULF Critical Resistance!NASDAQ:WULF has had a great come back but has just hit a triple sword resistance: weekly 200EMA, weekly pivot and High Volume Node where I expect it to struggle for a while!
Are CRYPTOCAP:BTC miners the new altcoins?
Bullish continuation through these resistances will flip them to support and demonstrate fundamental resilience on an improving macro economic background overcoming technical analysis.
Long term tailwind potential can be as high a10x from here but more realistic targets are the R3 weekly pivot $17 and R5 weekly pivot at $25.
Analysis is invalidated below the high degree wave (4) of a leading (or ending) diagonal Elliot Wave pattern.
Safe trading

$IREN Killing It. More Upside?NASDAQ:IREN has poked above the true all time high range (Launch price dump excluded) in a high degree Elliot wave 3
Long term target remains the R5 weekly pivot at $40 but may over extend with a bullish Bitcoin and Macro economic tailwind, coupled with AI growth.
Many thought this was a greedy target at $5 but now that price is $16 it doesn't look so bad. You have to know when to let the runners run, that is were the big bucks are trading!
Any retracement of a decent degree should expect to find support at the weekly pivot $9.4 before continuing upwards and may present an excellent buying opportunity! I will be posting the signal levels on Substack.
As always ,all time high range will be the next support if price continues upwards from here.
Safe trading

SMCI Long Swing Setup – Positioned for AI-Driven Infrastructure Super Micro Computer, Inc. NASDAQ:SMCI is a critical player in the AI infrastructure boom, supplying high-performance servers to NVIDIA, AMD, and major data centers. With accelerating demand for compute power, SMCI is well-positioned for continued upside.
📌 Trade Setup:
• Entry Zone: Current market price or $40 – $43 support zone
• Take Profit Targets:
o 🥇 $70
o 🥈 $100
o 🥉 $120
• Stop Loss: Weekly close below $30

Rockwell Automation | ROK | Long at $268.96Rockwell Automation NYSE:ROK appears to be gaining upward momentum once again. With two price gaps above (highest near $333+) and the historical simple moving average lines showing a positive change, this company could be poised to fill the gaps soon. A strong billion-dollar company with rising revenue, but stay cautious of the slightly high debt, insider selling, and changing economy / tariff implications.
At $268.96, NYSE:ROK is in a personal buy-zone.
Targets:
$300.00
$333.00

INTC getting ready to start it's upward trajectoryINTC has been ranging and coiling since July of 2024. It finally, is starting to look like bullish movement is about to break upwards.
As you can see, INTC has just broken the downward trend line as well as the triangle pattern. A break and hold above $24.40 would indicate the start of a new uptrend in the chart.
Indications that the stock is gaining bullish momentum on the weekly chart:
The Williams %R is approaching and getting ready to break the 50 line.
The MACD is bullish and approaching the zero line.
The stock has bounced off of the volume shelf on the AVP 4 times and is now breaking out of technical patterns.
Money flow on market cipher B has crossed over green.
EMA's are starting to turn upward to flip bullish.
The marked move on this triangle pattern is approximately $40.
From a fundamental standpoint, Intel is trying to fix the business on two tracks at one time:
1)Near-term – ship competitive AI-centric products now (CPUs, GPUs, Gaudi accelerators) to put revenue and margins back on a growth path.
2) Long-term – reinvent itself as a contract chip-maker (Intel Foundry) so it can win outside customers and leverage its huge fab investments.
Think of it as “sell more chips today, sell more manufacturing tomorrow.”
Let's see Intel can build enough momentum to break this range for the bigger move up. The table is set from a technical standpoint.
Not financial advice. Do your own research.

$HUT Macro Chart Preparing for Breakout?NASDAQ:HUT looks poised for a strong breakout with a wave 3 long term target of $58 and a short term resistances of $21 and $33
HUT is moving strong almost up 100% from the recent swing low, overcoming its weekly 200EMA with ease. A test of the 200EMA as support is likely before continuation.
Price is consolidating under major resistance High Volume Node (HVN) and the weekly pivot point. Consolidation under resistance often leads to a breakout.
A series of 1-2s appears to be taking place on the Elliot Wave count finding support at the 'BTC-Miners golden pocket' of 78.6 Fibonacci retracement.
Analysis is invalidated below $10.10
Safe trading

$5 to $32 vertical over 500% $CYN🔥 $5 to $32 vertical over 500% since market open NASDAQ:CYN on news mentioning NASDAQ:NVDA

#RLCUSDT #1D (Binance Futures) Descending wedge on supportiExec RLC just printed a dragonfly doji which may have marked the bottom on daily.
A morning star is drawing now, recovery towards 100EMA resistance seems around the corner.
⚡️⚡️ #RLC/USDT ⚡️⚡️
Exchanges: Binance Futures
Signal Type: Regular (Long)
Leverage: Isolated (4.0X)
Amount: 5.9%
Current Price:
0.9126
Entry Targets:
1) 0.9002
Take-Profit Targets:
1) 1.1854
Stop Targets:
1) 0.7859
Published By: @Zblaba
GETTEX:RLC BINANCE:RLCUSDT.P #DePIN #AI #iExec iex.ec
Risk/Reward= 1:2.5
Expected Profit= +126.7%
Possible Loss= -50.8%
Estimated Gaintime= 1 month

SOARING 20's are you ready for the Blowoff of the century#SPX v Currency in circulation
#Cup&Handle
1929 Echo bubble
AI will increase earnings and GDP
as ASI enters the workplace and Robotics grow us out of Debt
GDP = Number of people * Productivity
Now add an autonomous workforce to this.

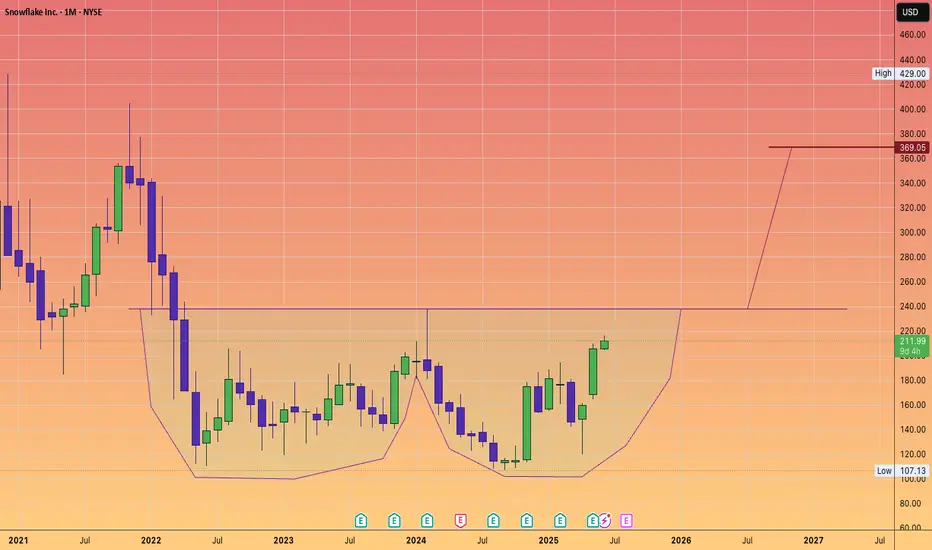
SNOWFLAKE to $369Snowflake Inc. is an American cloud-based data storage company.
Headquartered in Bozeman, Montana, it operates a platform that allows for data analysis and simultaneous access of data sets with minimal latency. It operates on Amazon Web Services, Microsoft Azure, and Google Cloud Platform.
As of November 2024, the company had 10,618 customers, including more than 800 members of the Forbes Global 2000, and processed 4.2 billion daily queries across its platform
#DoubleBottom
#Wformation
Google MUST hold this critical level!NASDAQ:GOOG local analysis update
📈 𝙇𝙤𝙣𝙜 𝙩𝙚𝙧𝙢 Further decline below the daily 200EMA, High Volume Node (HVN) and pivot point which it closed below on Friday could see google price fall back below $140.
📉 𝙎𝙝𝙤𝙧𝙩 𝙩𝙚𝙧𝙢 the bullish run has ended with Fridays bearish engulfing, first support below the support it is currently sat at is $156.
Irans conflict has investors shaken and not willing to hold assets over the weekend on the fear of worse news. However, if the conflict is resolved investors could have a great buying opportunity.
𝙏𝙚𝙘𝙝𝙣𝙞𝙘𝙖𝙡 𝘼𝙣𝙖𝙡𝙮𝙨𝙞𝙨
Price is challenging a triple shield: major support HVN, daily pivot and the daily 200EMA. Holding this level is critical and locks in a corrective Elliot Wave pattern from the $140 level completing between the 0.5-0.618 Fib retracement.
Daily DEMA Is about to produce a death cross while RSI is neutral with plenty of room to fall.
Safe trading