ETH Faces Deep Pullback After Liquidity SweepETH has undergone a sharp correction, dropping from the 3,380–3,400 zone directly into the 3,180–3,200 FVG, where price reacted firmly. This move signals a clear liquidity sweep — a deep probe to collect orders before bouncing at a key demand pocket, reinforcing this FVG as short-term support.
To the upside, the 3,300–3,360 bearish FVG remains a major barrier, where ETH previously saw strong rejection. Volume Profile shows thin liquidity in this range, explaining why sellers continue to dominate whenever price retests it. The broader market structure still leans bullish with higher lows intact, but the recent sweep places ETH in a deeper corrective phase. The 3,180–3,200 zone now acts as a crucial pivot: losing it would flip the short-term bias bearish and expose the high-volume 3,000–3,100 region.
Altcoin

SOL: Selling Pressure Rises After Fed SignalsHi everyone, Domic here.
The Fed’s decision to cut rates by 0.25% raised hopes for renewed capital inflows into the crypto market, but the Fed’s statement that no further cuts are expected in 2026 keeps sentiment cautious . This caused sharp volatility in Bitcoin and Ethereum, spilling over as selling pressure into altcoins, particularly SOL — which is highly sensitive to BTC corrections. Short-term capital continues to favor AI and meme coins, leaving SOL temporarily lacking momentum, even though its ecosystem remains solid in the medium term.
On the 2H chart, SOL has officially lost its uptrend structure as price closed strongly below both the 34 EMA and 89 EMA. Closing below these EMAs signals that the bullish momentum is broken and the short-term trend has turned bearish. The breakdown of the $134–135 support zone confirms a bearish Break of Structure, accompanied by a spike in selling volume — indicating that this is a real sell-off, not noise.
Currently, price is approaching the $127–129 support zone, seen as the first buffer that could trigger a reaction. However, if selling pressure persists, the $122–124 zone is likely to become the market’s next target.
Wishing you successful trading!

XRP - A Make-or-Break Battle at Major Support!!!📉XRP has been moving inside a falling channel , with sellers maintaining control for several weeks. However, price is now retesting a major weekly support zone around the 1.8–2.0 area, a level that has acted as a strong turning point in the past.
⚔️As long as this support zone holds, we will be looking for bullish reactions and potential long setups, expecting XRP to rebound inside the structure.
🏹If buyers step in, the first obstacle ahead will be the blue supply zone, which aligns perfectly with the upper channel trendline, creating a magnet-like area where price is likely to be drawn before the next decision.
Only a strong breakout above the supply zone would confirm a larger bullish reversal.
What do you think.. . will XRP defend this support and push higher? Share your view below 👇
⚠️ Disclaimer: This is not financial advice. Always do your own research and manage risk properly.
📚 Stick to your trading plan regarding entries, risk, and management.
Good luck! 🍀
All Strategies Are Good; If Managed Properly!
~Richard Nasr

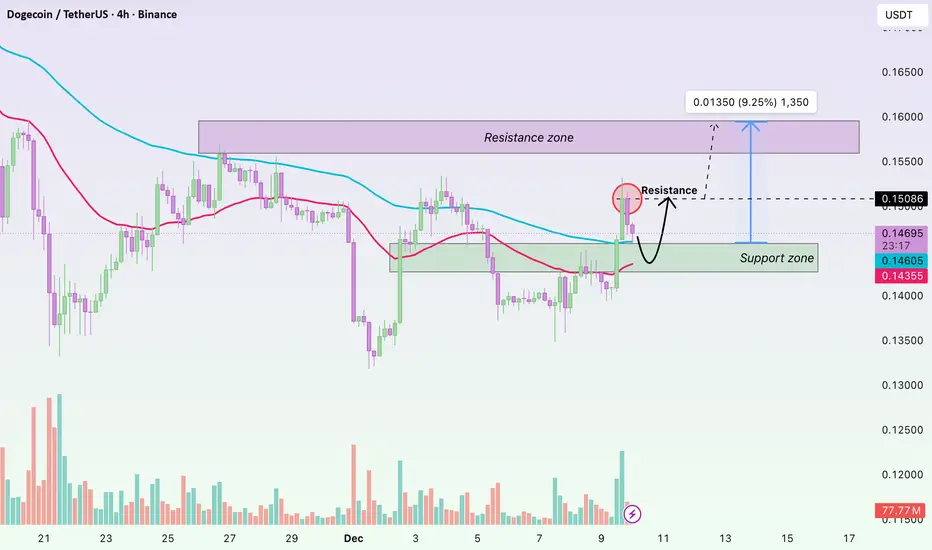
DOGE – Short-Term Breakout: EMA and Volume Support the UptrendHi everyone, Domic here. Dogecoin is showing a strong bullish move after breaking key EMA levels, accompanied by rising volume, indicating that buyers are in control. On the H4 chart, the 34 EMA (red) and 89 EMA (blue) serve as markers of the short-term trend. DOGE moving above both EMAs while forming higher lows suggests a high probability of continued short-term gains. Price is currently approaching the 89 EMA, a key technical resistance, and its reaction around this level will determine the next leg of the uptrend.
Trading volume on December 9 surged, reflecting active buying and support for the breakout from the accumulation zone around $0.146 to above $0.147. This signals that DOGE has the potential to extend its rally, but attention should be paid to its reaction near the $0.150 resistance level.
Currently, the market anticipates a clear breakout above $0.150. Positive sentiment from external factors — such as Elon Musk’s tweets, renewed interest in meme coins, DOGE adoption as a payment method, and expectations of a dovish Fed — is supporting inflows.
Wishing you all a successful trading day!
PIEVERSE — Rising Channel Exhaustion & Correction SetupThe price is moving inside a clean rising channel , forming a classic three-wave structure: (a) → (b) → (c). The upper boundary of the channel has now been reached, and wave (c) shows signs of exhaustion, which often precedes a corrective move.
Given the overextended structure and the repeated reactions from the channel resistance, the market is likely preparing for a downside correction. Once the local top is completed, the price may break down from the channel and retrace toward the $0.20–0.16 zone, where the next major support cluster sits.
This area also aligns with the expected correction depth after a completed ABC pattern.
Key Points:
Clean rising channel structure
Wave (c) is nearly completed
Expecting a correction after resistance rejection
Main target for the pullback: $0.20–0.16

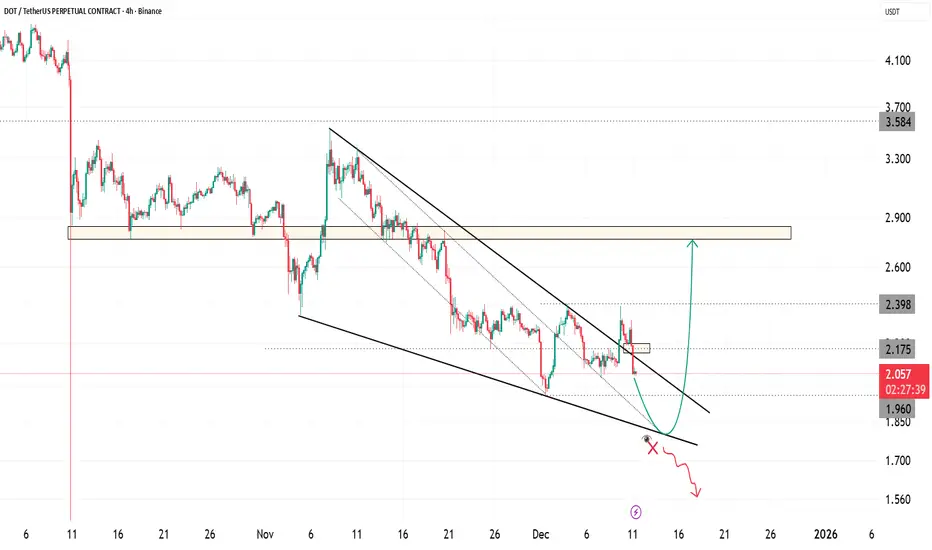
DOT Preparing for a Potential Relief Wave from Demand ZoneDOT continues to trade inside a well-defined falling wedge that has been guiding the market since early November. Price recently rejected from the mid-range and is now heading toward the lower boundary of the wedge. This area has acted as a liquidity pocket and a reaction zone several times in the past.
If price reaches the lower trendline and shows a stable reaction, a clean relief wave can start from this point. The next major objectives sit at two zones. The first is the mid-channel resistance near two point one seven. The second is the broader bearish rejection zone around two point nine where price failed multiple times during previous attempts.
A breakdown of the lower channel support will invalidate this bullish scenario and may open space toward deeper lows. The reaction near the wedge floor will decide the next directional leg.
This setup focuses on market structure, trendline behavior, channel dynamics, and liquidity sweeps. It remains a reaction-based outlook rather than a prediction.
Trade management and risk control remain essential in this environment.
LIGHT— Head & Shoulders Breakdown + Bear Flag TargetsA clear Head and Shoulders pattern has fully formed on the chart:
Left Shoulder
Head
Right Shoulder
After forming the right shoulder, the price created a bear flag , which is now breaking down — confirming bearish continuation.
This setup gives two downside targets:
1️⃣ Bear Flag Target: $0.55–0.47
The breakdown from the local rising structure (right shoulder flag) points to the first liquidity zone in the $0.55–0.47 range.
This is the nearest area where a reaction or short-term bounce may appear.
2️⃣ Head & Shoulders Target: $0.32–0.27
If the selloff continues and the full H&S pattern plays out, the measured move leads toward the deeper $0.32–0.27 zone — the main macro support area.
This confluence of a completed reversal pattern + a local bearish continuation structure significantly increases the probability of downward expansion.
Key Points:
Head & Shoulders fully formed
Bear flag breakdown on the right shoulder
First target: $0.55–0.47
Second target: $0.32–0.27

ZEC - From Exhaustion to Expansion!!!📉ZEC spent days trapped in a clear bearish phase on the left side of the chart, forming lower lows and lower highs. But everything changed once price tapped the major swing low, where buyers stepped in aggressively.
📈Since then, ZEC has been respecting a new rising channel , shifting the market structure from bearish to bullish. As long as price remains inside this channel, the bulls remain in control.
We will be looking for longs around the intersection of:
- the lower blue trendline, and
- the most recent higher-low zone
🏹This is where buyers have consistently reacted before, and where the next bullish impulse could start.
If this structure holds, ZEC may push toward the upper boundary of the channel once again.
Do you think ZEC is gearing up for another leg up? Let me know below 👇
⚠️ Disclaimer: This is not financial advice. Always do your own research and manage risk properly.
📚 Stick to your trading plan regarding entries, risk, and management.
Good luck! 🍀
All Strategies Are Good; If Managed Properly!
~Richard Nasr

The Market Awaits the Fed to Set the TrendHi everyone, Domic here again.
On the chart, ETH is still holding its short-term uptrend as the 34 EMA (red) remains above the 89 EMA (blue), but the bullish momentum has clearly slowed down. Price is hovering just above both EMAs without forming any widening angle, while the EMAs themselves are being squeezed — a classic signal that the market is losing momentum, moving sideways, and waiting for new catalysts. The declining volume further confirms that buying pressure is no longer strong enough to push ETH decisively toward the 3,150–3,200 zone. This explains why, despite the uptrend remaining intact, ETH is “waiting” rather than accelerating.
On the news side, ETH is directly influenced by upcoming macro events:
The Fed meeting on December 9–10 is the key driver, and crypto markets typically go quiet ahead of such events to await direction.
Meanwhile, the DXY is weak and moving below the 100 level, but volatility is low — not enough to trigger a strong risk-on wave across crypto.
At the same time, speculation around a potential Ethereum spot ETF continues, but without any confirmation from the SEC, expectations exist — yet large capital remains cautious.
Based on these factors, I expect ETH to continue consolidating or potentially pull back to retest the 3,060–3,080 zone before showing a clearer reaction after the Fed meeting.

ETH Pauses as Market Awaits Fed SignalETH on the H4 timeframe is moving sideways between 3,080–3,130 after a strong rebound from 2,750–2,800, signaling a shift into consolidation rather than continuation. The current zone overlaps a previous high-volume distribution area, while a flat Ichimoku cloud reflects indecision. Price hasn’t broken past the last high, and the lower FVG at 2,980–3,050 may still attract a retest. A clean breakout above 3,150–3,200 is needed to confirm upside momentum; until then, ETH remains in wait-and-see mode ahead of the Fed.

Altcoins \ Altseason Others / BTC ratio is in its lowest momentum zone in history...
Historic demand area has been tested once again, marking the final phase of capitulation.
Every major altcoin season has begun with just such silence.
What's coming will explain the silence.

BTC.D OutlookFalling down with the 2017's pattern is a possible scenario. If happens so, we can have Altseason Q1-Q2 2026 until BTC.D reaches 40%. It may be the final target, but it can reach 24% in Q1 2027 if it wants to do the complete pattern; however, the whole market is down probably by that time.

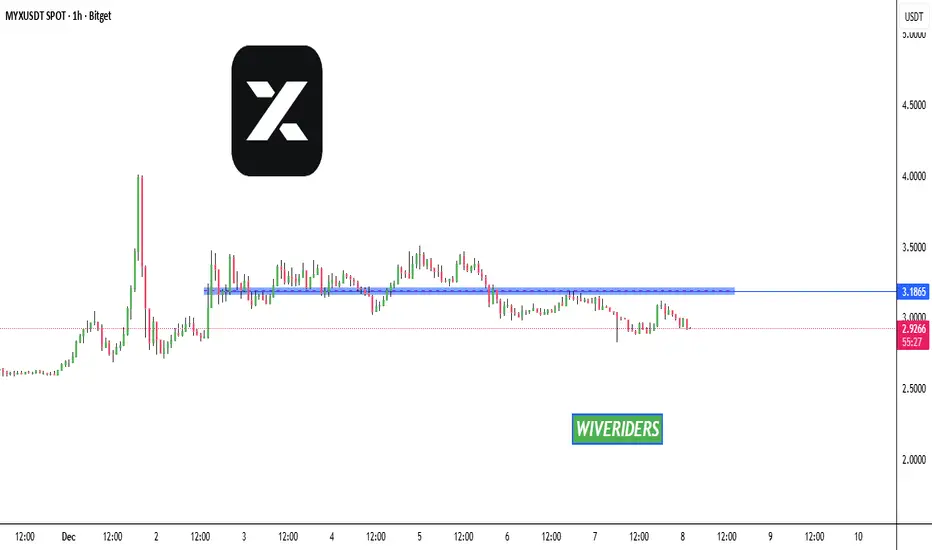
MYX has broken below the blue support level 🚨📊 MYX Update
MYX has broken below the blue support level 🔵⬇,
showing sellers are taking control of the move.
This breakdown increases the chance of further downside
unless buyers quickly reclaim this zone.
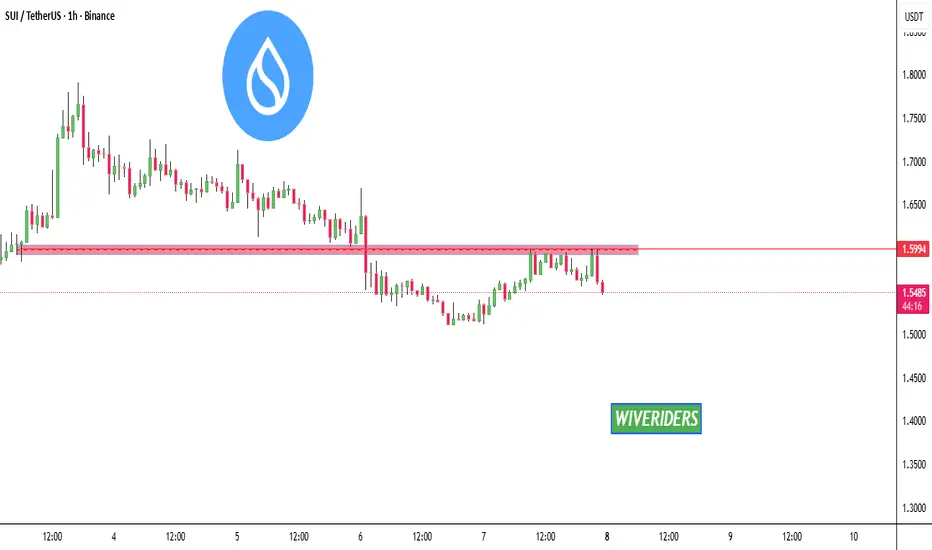
SUI failed to break out above the red resistance zone🚨📊 SUI Update
SUI failed to break out above the red resistance zone 🔴
and got rejected, confirming strong seller presence.
As long as price stays below this level,
upside remains limited.
LUNA OutlookRecently LUNA rose from $0.06 to $0.15. It is enough for now guys! Market didn't rise. Let's pump AXS (Axie Infinity) and ONE (Harmony) now. Thanks

Why Bitcoin Endures While 90% of Altcoins Are Born to… Die Over more than five years of observing the crypto market, one clear pattern stands out: Bitcoin survives every cycle, while most altcoins only last a few storms before vanishing. This is not a subjective impression but a reality that any serious investor must understand. Bitcoin and altcoins differ in origin, value, and market strength, and these differences are what allow BTC to endure while most altcoins fade away early.
Bitcoin was created with the mission of becoming “digital gold.” It has a fixed supply of 21 million, operates in a decentralized manner, is not controlled by any single organization, and is widely accepted as a global asset. In contrast, around 90% of altcoins are launched primarily to raise capital, for marketing purposes, or to chase technological trends. Bitcoin exists because of real value; altcoins exist on temporary expectations. When these expectations fade, altcoins die, while trust in BTC grows, allowing Bitcoin to continue evolving and remain a cornerstone of the market.
Another distinction lies in cycles. Bitcoin follows a four-year halving cycle, moving through stages of accumulation, boom, correction, and re-accumulation. BTC consistently surpasses previous highs thanks to its stable cycle and long-term capital, which ensures enduring vitality. Altcoins, however, often experience a short life cycle: launch, hype, pump, dump, and eventual oblivion. Most altcoins stop at the final stage and never return to previous peaks, while Bitcoin always finds a way to reach new highs, demonstrating superior resilience.
Capital backing is also a decisive factor. Bitcoin is accumulated by ETFs, major banks, financial institutions, certain countries like El Salvador, and large corporations such as MicroStrategy. This represents long-term, sustainable capital capable of withstanding market fluctuations. Altcoins, on the other hand, rely mainly on short-term traders, retail FOMO, or social media marketing, making their prices highly volatile when capital exits. Thanks to stable institutional flows, Bitcoin is continuously accumulated and is rarely at risk of “dying” in any cycle.
Token structure creates another clear difference. Altcoins often undermine their own value through tokenomics: early unlocks, large team allocations, high inflation, and weak real demand. Bitcoin is entirely different: fixed supply, no one can mint more, and halving reduces supply over time. This increasing scarcity acts as a shield for its value, explaining why Bitcoin endures over time.
The biggest distinction also lies in the role of each type of currency. Bitcoin serves as the standard and backbone of the market; altcoins are merely “experimental products.” When BTC rises, altcoins revive; when BTC moves sideways, altcoins pump along with the flow; when BTC drops sharply, altcoins crash the hardest. This is a crucial reason for investors to understand that Bitcoin is a real asset, whereas altcoins are interchangeable products that can fail at any time.
Smart investing starts with understanding this difference. Bitcoin survives because of trust, economic structure, and real value, while altcoins exist on expectations, marketing, and short-term capital. To thrive long-term in the crypto market, you should treat Bitcoin as a foundational, enduring pillar and view altcoins as short-term, high-risk opportunities. Once you grasp this rule, you will avoid being swept into “moonshot” projects or holding altcoins that never return to previous highs, and instead invest with strategic vision rather than emotion.
SOLUSDT – Gains Limited, Price Faces a Key Decision ZoneHello everyone, SOL experienced an impressive upward move over the past weekend, but the current momentum has noticeably weakened as the price hits the EMA 89 (blue), an area that has previously created strong selling pressure last month.
After bouncing around the 145 USD mark, SOL retraced to test both EMA 34 (red) and EMA 89, forming a critical convergence zone to determine the next direction. Recent candles show long upper wicks accompanied by decreasing volume, indicating that buyers are losing strength compared to the previous breakout while profit-taking pressure is rising. The market structure has yet to confirm an uptrend, as SOL has only slightly broken local highs without forming a clear higher-high, explaining why the price was rejected at EMA 89.
From a macro and capital flow perspective, over the past 48 hours, the Solana ecosystem has shown a positive recovery, with several DeFi projects and memecoins rallying. However, capital inflows into altcoins have paused as investors await updates from the Fed and US economic data. Bitcoin is currently moving sideways, meaning the primary market momentum supporting altcoins, including SOL, is insufficient to drive a breakout. Therefore, even positive news is not yet strong enough to establish a new trend.
Wishing everyone successful trading!

APT has broken below the blue support level🚨📊 APT Update
APT has broken below the blue support level 🔵⬇️,
showing clear weakness as sellers take control.
This breakdown increases the chance of further downside
unless buyers quickly reclaim this zone.

FIL Is Losing Bearish Momentum => Bullish Takeover Soon?📉FIL has been printing a series of progressively weaker bearish impulses, first a big drop, then a smaller one, and now a flat one.
This loss of bearish strength is happening while price is hovering above a major demand zone (orange), a level that previously triggered a massive rally.
📉📈Notice how the bearish swings are curving and flattening (dotted pink curve). This is often an early sign that sellers are exhausting.
⚔️As long as FIL remains above the demand zone, we will be looking for bullish reversal setups, especially if price retests the orange zone one more time and rejects it.
🏹For the bulls to take over entirely, price needs to break above the blue consolidation zone, confirming a shift in momentum.
Do you think FIL is gearing up for a bigger move? Let me know below! 👇
⚠️ Disclaimer: This is not financial advice. Always do your own research and manage risk properly.
📚 Stick to your trading plan regarding entries, risk, and management.
Good luck! 🍀
All Strategies Are Good; If Managed Properly!
~Richard Nasr

ZEC Update🚨📊 ZEC Update
ZEC is testing the red resistance zone 🔴.
If a breakout occurs, the next target will be the green line level 🟩🎯.

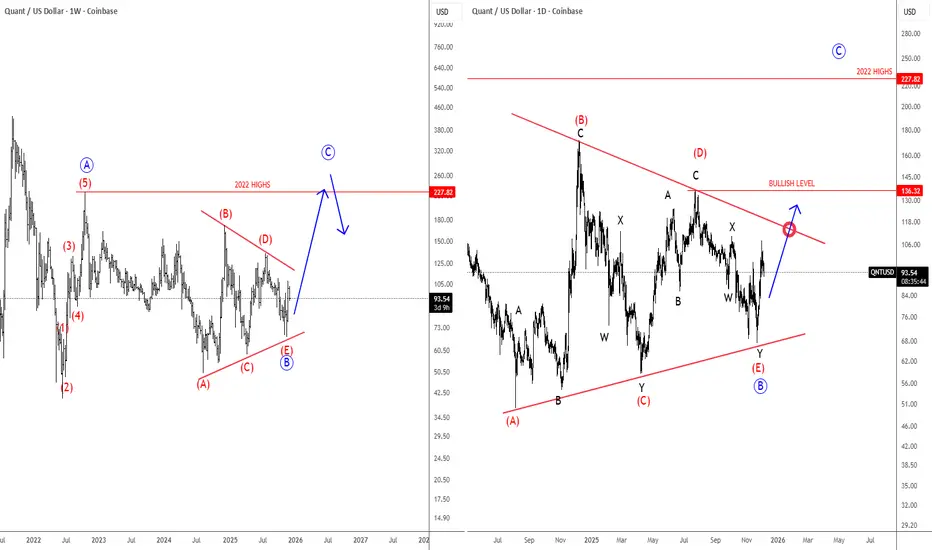
Quant Is Finishing A Bullish Triangle FormationQuant Network is a blockchain interoperability project that lets different blockchains communicate with each other. Its operating system, Overledger, allows developers and businesses to build apps that can run across multiple blockchains at the same time.
The token QNT is used to access and pay for Overledger services.
Quant with ticker QNTUSD is still holding up well above the lower triangle line, so bulls are still here. On the weekly basis, we can now see it finishing a bullish triangle pattern in wave B before we may see another rally for wave C. On a daily chart, it may actually have a completed complex W-X-Y decline within final wave (E) of B, but bullish confirmation for wave C is only above the upper triangle line and 136 level.
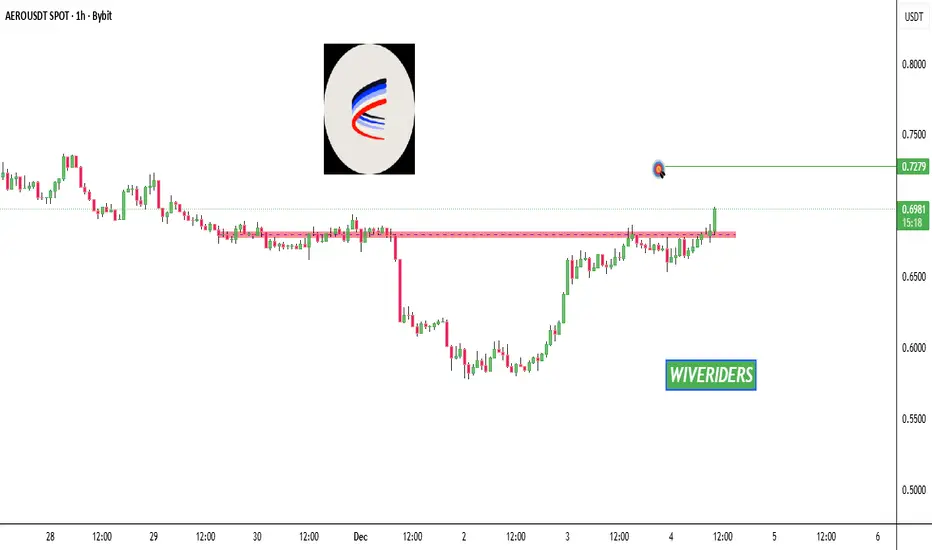
AERO Update🚨📊 AERO Update
AERO has broken out above the red resistance zone 🔴🚀.
If momentum continues, the next target is the green line level 🟩🎯.
LINK Update🚨📊 LINK Update
LINK has formed and confirmed a Double Bottom pattern 🔄📈.
Price is now approaching the first target 🟩.
If momentum continues,
the second target at the green line level becomes likely 🎯.
