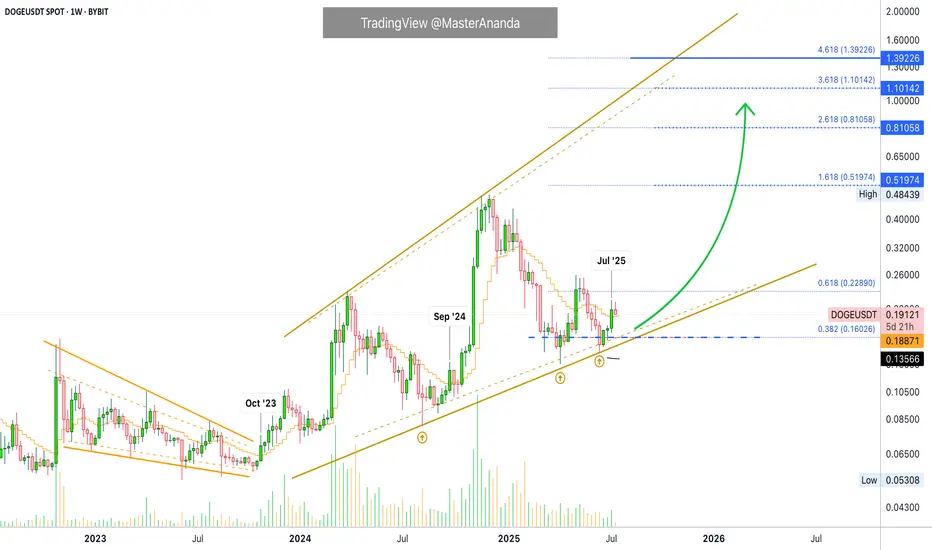
Dogecoin's Bullish Wave Over? Higher High Beyond $1.11111Nope, it is only getting started... Do you see that tiny speck of a black line on the chart? Way below the current candles around 0.135. That's MA200 weekly. Dogecoin is on the bullish zone 100% already confirmed. The bullish wave is only getting started.
DOGEUSDT is trading weekly above EMA13. Watch what happened in September 2024 when Dogecoin broke above this level. Or further back, October 2023. Both instances, there was a bullish impulse; both instances, a higher high.
Dogecoin moved and closed above EMA13 last week, July 2025. Guess what will happen next? A new bullish impulse and a strong higher high.
Patience is key, the market is set to continue growing long-term. No, the uptrend is not over, it is only getting started.
Thanks a lot for your continued support.
Namaste.
Altcoins
Ondo: The Bullish Wave is Over? 410% - 579% Profits PotentialONDOUSDT managed to produce three weeks closing green with the last one conquering EMA13. When this happened back in November 2024 there was a period of continued growth. Look at it in this way; the week is young and the market is taking a break, growth will resume in a matter of days. This same week more green and continued green long-term.
When ONDOUSDT broke above EMA13 last year, it produced a total of six weeks of straight up. Now, back then we were looking at a small jump, today we are looking at a very strong bullish impulse. The 2025 bull market in full force.
Three green weeks is only the start. We are about to experience 12-24 weeks of bullish action. We are looking at the bottom, bullish momentum is yet to grow. It is still early, but early won't be a reality for too long. Buy and hold.
We have two targets that are interesting: 410% and 579%. These can be hit within 3 to 6 months. Allow for retraces and swings on the way up.
Namaste.

Space and Time: Trading Strategy · 1 BTC = 2.5 BTC (PP: 150%)Are you interested in a double-up?
Let's use round numbers to keep it simple.
Trade: Buy 1 BTC STXUSDT = Get 2.5 BTC (150% profits).
Time duration: 20-40 days.
Risk: Very low (time).
The risk can be calculated in time. Since this is a spot trade, you cannot get liquidated. In the worst case scenario, you wait. This is the only risk if the chart breaks down. If it works as planned, you can get 150% profits (250% earnings) by selling on target.
Time duration is "short-term." Which is within 30 days. Here I set 20-40 days to allow for any unexpected variations.
The trade is any amount you want. $1,000 USDT bought at current price, say 0.0890, would result in $2,500 USDT if selling happens at 0.2229. This is just an example of course for illustration purposes.
The trick is to be ready to wait. If waiting is hard, one can be use diversification to be entertained. Say, $250 USDT on four different pairs that have good potential for growth. Can be $2,500 USDT by 4 if the capital is $10,000. Or $10,000 USDT by 10 if the capital is $100,000. There are many different ways to approach the market.
A different approach: $10,000 in. The market (pair in question) grows 25%. Close position (sell). Result = $12,500. Find new pair and repeat.
The stop-loss can be a tight one at 5%. If prices drop 5% close position. Result = $9,500. Try again with a different pair. The stop-loss can be set at 10%, 15%, 20%, based on the chart, etc.
There is also a trailing stop. Adjust the stop below a certain level as prices rise, after you catch the rising trend. This is a bit more advanced and it is mainly used by profitable traders.
Patience is key. If you can wait, you can win.
Space and Time (SXT) is set to grow. How you approach this market is up to you. Remember to do your own research and planning. This is not financial advice. I am sharing for learning and entertainment purposes only.
Thank you for reading.
Namaste.

XRP $6.5, $9.5, $12.5 & $15.5 · Which One?XRP broke a small local downtrend and managed to close above a small resistance zone around $2.76. It managed to do this on a full green candle with rising volume.
XRPUSDT weekly is currently trading above all moving averages, extremely bullish: MA200, EMA377, EMA233, EMA89 and the rest.
If we look at a bull market cycle as a series of three steps, we have the first two missing the last one. Compare current action with 2021 while noticing the 1,2,3 numbers on the chart. This leaves us wondering about the next target: How high can XRP go in its next bullish move?
It seems something extraordinary is brewing behind the scenes, I can feel it. What we've been saying all along but rather than just words, a new feeling came up. "It is not the same to live through an event vs talking about it." That kind of feeling.
I can continue to say that market conditions are extremely positive now especially when we compare it to several years ago. But we have not seen the effect this positive conditions will have on the market, the price of the different projects and the charts, but we are getting close.
XRP has big plans and continue to grow, expand and evolve.
The 2021 bull market from bottom to top produced more than 1,800%. In 2025, if we start counting from the July 2024 low, a target of $6.50 would mean a total of ~1,585% growth. Market conditions are better now so we can aim higher, expect more.
A target of $9.51 sounds great, this would mean a nice ~230% from current price and from the same low as before, a total of ~2,400%. This sounds better but we can do more.
The next two targets based on an extension of the current trend would lead to $12.5 and $15.5. I'll let you calculate the potential yourself.
$6.5, $9.51, $12.5 or more; whatever the market ends up giving us, we are happy to be part of this adventure and we are always grateful for the amazing results.
Aim high. I will be here reading the charts live when we are getting close to the top. There will be time to sell, time to adapt, time to decide. There will be enough time for everything if you start now. Prepare now and success is yours.
We are early for the last phase of the XRP 2025 bull market. The first half is in, we are due the second half; it will be great.
Namaste.

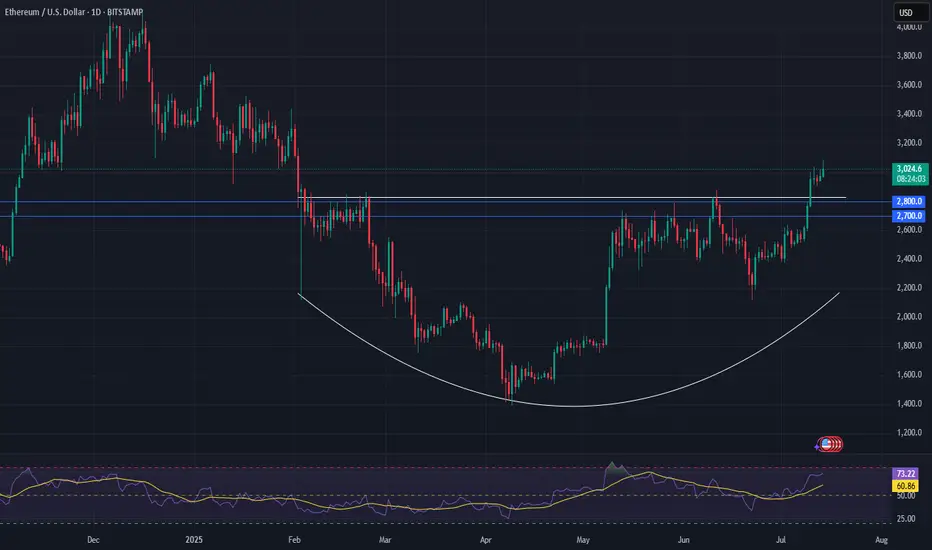
Can a Bear Market Start With Ethereum At $3,000?Ethereum produced sideways action for 49 days, 7 weeks. Immediately after seeing this I realized the next logical step was a bullish breakout, and the market moved up. But this isn't all. Ethereum is still trading at $3,000, more than $1,800 away from its all-time high.
Now, thinking about the doubt that always creeps up when the market becomes bullish confirmed, I want to clear things up if at least for you. While others can continue to doubt and will continue to do so, many others will even SHORT and lose everything, you will be happy knowing that the market will experience additional growth. You will also be making profits as the market grows. You will be happy because you know for a fact, based on data, that we are set to experience sustained long-term growth.
A bear market can only develop after a bull market. A bull market ends in a major high or new all-time high. Current conditions for ETHUSDT are far from being "peaky." There is no new all-time high. Actually, prices are still relatively low.
First Ethereum needs to challenge its previous all-time high, create a new one and then we can talk about a bear market or correction. We know for a fact that Ethereum is bullish based on recent price action and the chart. We know for a fact that Ethereum will grow because Bitcoin is already high up. Ethereum is the #2 Crypto and what Bitcoin does it tends to follow.
Bitcoin is super strong but this is not to be confused as weakness. Weakness comes when the market has been growing for too long, growth becomes heavy and a drop happens next. Strength happens when the market has been sideways for months, breaks up and produces a major advance (now). This type of pattern predicts additional growth.
Bitcoin is the king and what Bitcoin does the rest follows. You can expect additional growth.
The reason why the bullish cycle is not yet over is because prices are still too low. Many altcoins are trading near all-time lows. Think about it. A bear market develops from all-time highs and bull markets develop from all-time lows. We are only at the start of a major bullish cycle, phase and wave.
The proof is in the chart. A major low was hit 7-April 2025, the lowest since March 2023. This marks the end of the correction and the start of the 2025 bullish phase. I don't know if Ethereum will grow for years or only for a few months. I know with 100% certainty that the Cryptocurrency market will continue to grow. You can bet your house on it.
Thanks a lot for your continued support.
Namaste.

Altcoins Bull Market Confirmed —Fun TokenEvery time there is a strong rise immediately what follows is a correction, always, unless of course you are in a bull market. Here you have the most revealing signal of all: Price stability after a major rise, sideways rather than bearish.
Fun Token (FUNUSDT) produced a more than 340% bullish wave. What happens right after the peak? If you guessed a drop I don't blame you, that is what normally happens but here things are different. Since the market is growing and set to grow strong for long, after this major rise instead of a crash we have consolidation, sideways. This reveals that participants are not selling, they are not selling because they know the rise is not over, there will be additional growth.
Go back in time and look at 30-50 altcoins and see what happens after each strong bullish wave, a correction. Now, do the same but focus on a bull market; what happens after a strong bullish wave? Some consolidation followed by additional growth.
The altcoins bull market is already confirmed.
Thanks a lot for your continued support.
Namaste.

Sperax: Bullish pennant.Sperax is consolidating in a bullish pennant pattern after a strong recovery rally off the March lows. Price action has tightened between ascending support and descending resistance, forming a textbook continuation setup. Volume has decreased during this compression, which is often a precursor to explosive movement.
Fundamental Catalysts (Despite GENIUS Act Stalling):
Retail DeFi Narrative is Still Alive – While the GENIUS Act failed in the Senate, the momentum for regulatory clarity in the DeFi space continues. Future bills or executive actions could unlock capital flows to protocols like Sperax.
Deflationary Pressure —Over 13% of the total SPA supply has been burned, with more tokens locked and lost. The actual circulating supply is meaningfully lower than the total supply shown on aggregators.
SIP-70 has been passed , shifting SPA emissions from an automatic release model to a DAO-controlled emission schedule. This marks a significant milestone towards sustainable tokenomics and the preservation of long-term value.
Long-Term Accumulation – Wallet data and order books suggest that whales and long-term holders quietly accumulate during this sideways range.
Sperax remains a low-cap token with outsized potential in the next altseason if it secures even one meaningful partnership or fiat on-ramp.

SUIUSDT Weekly Chart Analysis | Breakout Confirmed!SUIUSDT Weekly Chart Analysis | Breakout Confirmed, Massive Liquidity at $4–$4.20
🔍 Let’s dive into the SUI/USDT weekly chart after a decisive breakout from the symmetrical triangle, highlighting the critical liquidity zone and what it means for price action.
⏳ Weekly Overview
SUI has broken out of its multi-month triangle pattern following a textbook fakeout, with volume dynamics confirming renewed bullish momentum. The breakout is now awaiting daily candle confirmation for full validation.
🔺 Bullish Breakout & Key Liquidity Zone
A major liquidity cluster sits between $4.00 and $4.20, with more than $140 billion in liquidity concentrated in this range. This zone is crucial for several reasons:
- It represents a significant area where large buy and sell orders are stacked, likely leading to heightened volatility as price approaches or breaks through.
- Clearing this liquidity could unlock rapid moves toward the next upside targets at $7.03 and $9.50, as shown on the chart.
📊 Key Highlights
- Symmetrical triangle resolved with a bullish breakout, confirmed by increasing volume.
- The $4.00–$4.20 range holds over $140B in liquidity, making it a pivotal battleground for bulls and bears.
- Daily candle confirmation remains essential for trend validation.
- SUI ecosystem has reached a new all-time high in DeFi TVL, adding fundamental strength to the bullish case.
🚨 Conclusion
The breakout above the triangle, combined with surging volume and a record DeFi TVL, sets the stage for a potential rally. Watch the $4.00–$4.20 liquidity zone closely—how price interacts with this level could determine the speed and magnitude of the next move. Stay alert for daily confirmation and be prepared for volatility as SUI tests this high-stakes region.
#SUI #CryptoAnalysis #TradingView #Altcoins #ACA

Orca Moving Fast, Altcoins Market Heats Up (Easy 275% PP)Think fast, act fast, move fast! The altcoins market is heating up and it is not for the faint hearted. Either you take action now, fast, or the market moves away. Low prices to be available never again...
Good afternoon my fellow Cryptocurrency trader, I hope you are having a wonderful day.
A bull market means up. It means growth, up, up, up, up and then higher. Yes, some pairs will retrace but that is because these pairs already moved ahead. Once the action stops on one group, another group moves forward and this pattern will continue to repeat long-term. What this means is that there will always be something going up. And this is awesome if you are a trader as more opportunities become available every single day.
Here ORCAUSDT is already bullish, we have the higher low and the full green candle above EMA55 on the daily timeframe. This is as good as it gets. An advance is confirmed so this becomes an easy hold. But, since we are looking at it short-term, after our target hits we collect profits and move on.
Not all trades are short-term not all trading works this way. We have long-term chart setups, leveraged positions, short-term spot and so on. Make sure not to confuse one with the other to avoid mistakes.
Some projects we catch the bottom and let the bull market unravel, others we enter "in-the-action" collect profits and move on.
Whichever way works for you, that's up to you. Some people like to be relaxed while trading others want to take action.
Thanks a lot for your continued support.
Namaste.

BERACHAIN Starts A Major Advance, Moving Fast (165% - 288% PP)The action never stops in a bull market. When one pair retraces a new pair starts to move forward. Choose wisely.
BERACHAIN (BERAUSDT) looks bullish to me. You can agree as I will show you the proof.
The downtrend has been broken and it is no surprise this happened after the 22-June low. We know this date to be a major turning point for many altcoins, it has been proven by the charts.
To keep it simple and short, because prices are rising fast, once the downtrend ends prices grow.
Here we have a short-term trade setup. We should see higher and higher in the coming hours and days. The bullish signals are fully confirmed; BERAUSDT is ready to move ahead. The main target can be seen on the chart. We are going for 165% but remember, it can go higher.
Thank you for reading.
Namaste.

Ethereum Set for a Major Move — Watch $2,700–$2,800Epic Base Forming:
Ethereum is building a powerful base, and the fundamental dynamics have shifted significantly in recent weeks. With ETF fund flows hitting new highs, institutional interest is clearly growing.
Tight Setup for a Short Squeeze:
Meanwhile, the futures market shows a near-record short position, creating a high-potential setup for a massive short squeeze. Even without the chart, this kind of positioning mismatch is rare—and explosive.
Technical Watch Zone:
Ethereum is pressing into key resistance from a rounding bottom. The critical level to watch is $2,700–$2,800. A clean breakout here could ignite a sharp rally, with $4,000+ back on the table in short order.
This is a textbook setup—fundamentals, sentiment, and technicals are aligning.
#Ethereum #ETH #Crypto #TechnicalAnalysis #ShortSqueeze #ETFFlows #MarketSetup #Bullish #Altcoins #CryptoTrading #WatchList
KuCoin Token (KCS) Full Analysis · Past Cycle & PresentKCS is preparing for something really nice, very similar to 2021. In 2021 KuCoin Token grew 5,655%. From 0.500 to 28.77. The entire move from bottom to top lasted 511 days, the bottom being around July 2020, then the market went sideways before the bullish phase. The meat of the move happened in a total of 329 days.
If we take the current cycle bottom to be around August 2024, 511 days gives us a date of 29-December 2025. In 2017 Bitcoin peaked around December. So this is a good date.
I cannot calculate the analog using the 329 days for the "meat of the move" because the bullish breakout is not yet in place. But, late 2025 is what we are aiming for mainly for the next all-time high across the market. We remain open to see this go beyond and reach 2026 but this is something that we will have to wait and see. For now our focus is on what the data provides.
Actually, many pairs, as we saw some weeks ago, are giving out strong signals pointing to Q1-Q2 2026 for their top. Others late 2025. So we have mixed signals and that's normal because the market is really big right now. Not everything can peak at the same time on the same date and not everything hit bottom at the same time.
KuCoin Token is a great example, here the market bottom happened August 2023 and we then see a clear change of dynamics. Ethereum bottomed June 2022 and many altcoins hit bottom just recently, on and on. I keep harping on this just so you know that we cannot generalize anymore. Each project needs to be considered individually if we want accurate results.
KuCoin Token (KCSUSDT) has been bullish growing from its base. A top happened March 2024 and a lower high late January this year, 2025. This does not invalidate the long-term bullish bias and potential.
One major resistance zone remains between $13 and $16, matching the last two peaks just mentioned. We will never wait for "confirmation" here as it would mean a lost opportunity. The market will grow and will break this resistance zone easily and continue higher likely to reach new all-time highs.
So this resistance range, rather than a level that needs to be conquered to confirm a bullish bias, can be taken as weak targets. By weak I mean that we do not sell here. We wait and sell only higher since the market is moving much higher it would be a waste to sell too early. One of the mistakes that can be made in this phase of the market cycle.
Hold strong. Everything looks good. There is huge potential for growth.
$44 is a great target but there is also $69. Which one to choose depends on how the overall market is doing and the date these targets are hit (or missed). For example, if KCS is trading near $40 in just two months, we can aim higher. On the other hand, if KCS is trading around $40 in December, then we can start to consider taking profits.
Of course, this is just a brush-off, you need to do your own research and thorough planning.
Namaste.

Gala Games · Let's Talk All-Time High & Potential TargetsThe truth is that a new all-time high is just us being optimistic. The truth is that there is not enough data for us to make such a prediction. The altcoins market is turning out to be super strong, Bitcoin is doing great and we expect amazing growth, but I cannot say that a new all-time high is a certainty on this chart, there is simply not enough data. I can't rule it out either, so that's the situation in which we find ourselves.
The next question: Can we make an educated guess based on the data that's available?
Yes! Absolutely.
» Standard projections based on mid-range price action opens up high probability targets around 0.10, 0.15 and 0.21.
» Long-term projections based on the previous cycle (2021-2022) gives us a minimum target of 0.33 and 0.52.
» A great bull market opens up 1.35 and 2.17. But even these numbers can be tricky because we are putting limitations on something that has no limits.
The way we extract these numbers is based on past action, the way the market works is based on present day events and what the future holds. Present day and the future are much different to the conditions we had just a few years ago. Just a few months ago (last year) the market was in such a different situation. A certain group of people whom I won't mention were trying to shutdown the market through capricious lawsuits and abuse of power, today, the market is fully encouraged to grow. This type of development is what can make the difference between a standard high and a major new all-time high. I would aim high just to be on the safe side.
The top will not be over in an hour or days. It can take weeks, sometimes even months. There is also the double-top possibility or in the least, the dead-cat bounce, lower high after the final peak. That is, there will be plenty of time to sell. We just need to become very alert, wise and active when the action is happening around major resistance zones.
We can tell if the top is in by tracking the rest of the market. I will be here sharing charts.
The market will decide, we can only speculate. With that said, we know we are going way beyond the standard and the minimum, the Cryptocurrency market is already doing great. Expect maximum growth; hope for the best, prepare for the best.
Namaste.

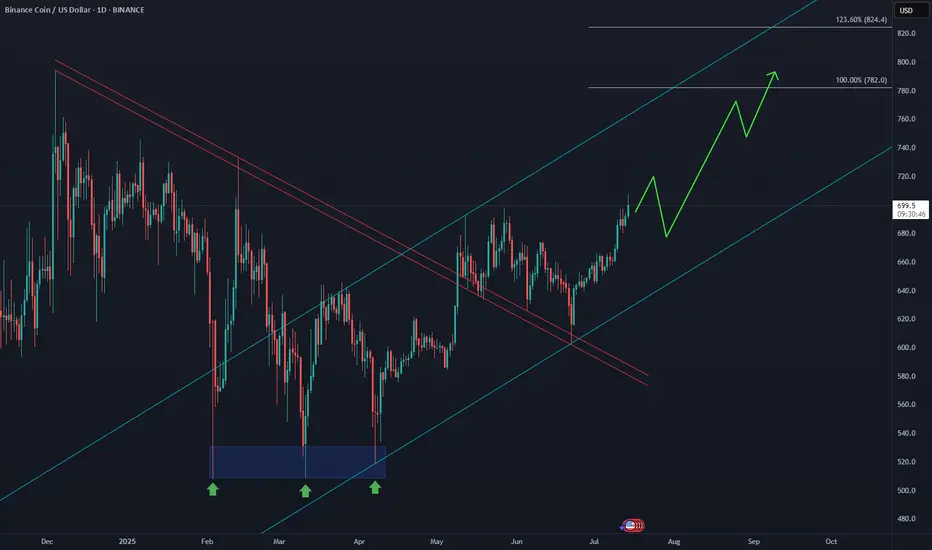
BNB Aiming for New All-Time Highs📈 After breaking above the May peak, CRYPTOCAP:BNB has activated a bullish sequence, with the equal legs target zone projected at $782–$824. This aligns with Elliott Wave extensions and confirms strong momentum from the June lows.
Top Altcoins Choice —Your Pick · Bitcoin Hits New All-Time HighBitcoin is once again trading at a new all-time high and as this happens the altcoins go boom.
The first instance circled around the fact that Bitcoin was strong and range trading between $100,000 and $110,000. When Bitcoin goes sideways within a bull market, the altcoins tend to blow up, and blow up they need. Now, when Bitcoin moves to hit a new all-time high and keeps growing; the 2025 Cryptocurrency bull market is fully confirmed.
» Which one is your favorite altcoin trading pair?
» Which project you think will grow the most in 2025 & 2026?
» What is your TOP ALTCOIN CHOICE?
Top Altcoins Choice —Your Pick
Leave a comment with some of your favorite altcoins pairs, the ones you like most and I will do a full analysis for you. I will publish in my profile and also answer directly in the comments section. I will pick and choose.
If you see other commentators that have a pair that you like, make sure to boost their comment and reply. The more boosts a comments gets, higher priority will be given to the project and trading pair.
Boost this publication and leave a comment, let's get started with your TOP ALTCOINS CHOICE!
Namaste.

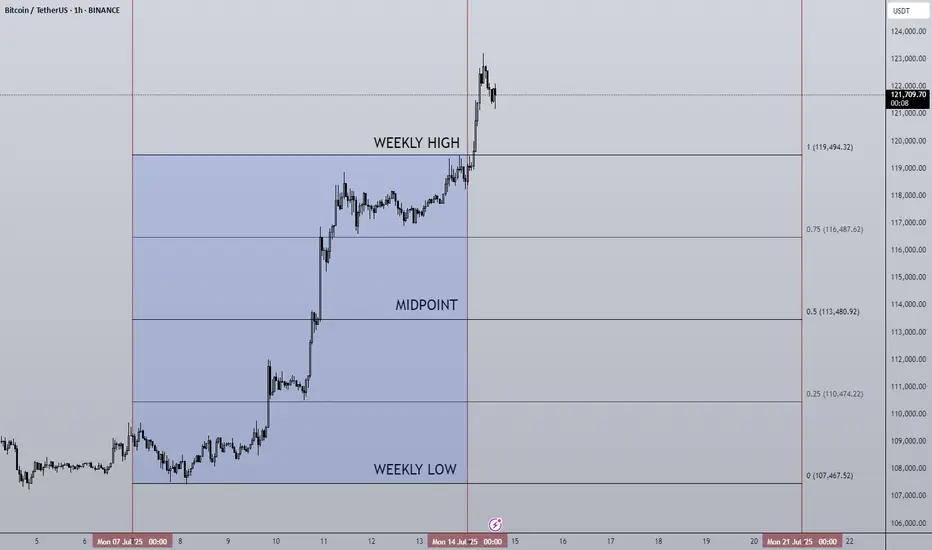
14/07/25 Weekly OutlookLast weeks high: $119,494.32
Last weeks low: $107,467.52
Midpoint: $113,480.92
NEW BTC ATH!
This is what we've all been waiting for, BTC breaks through resistance at $110,000-112,000 to set a the highest weekly close ever ($119,086). Thanks to a further $2.27B net inflows via BTC ETFs, the passing of the "big beautiful bill" flipping from a more deficit reduction stance by the US to an environment perfectly suited to risk on assets. Things are looking good for Bitcoin.
This week already in the Asia session BTC has broken above the weekly high to hit $123,100. Despite this incredible rally BTC.D has been falling since Thursday of last week. To me this signals altcoins have started to play catch up and we've seen that with ETH breaking $3000 (+14% relative to BTC).
I would like to see BTC consolidating here above the weekly high while altcoin majors break their choppy rangebound environments and shift to a trending environment just as BTC had last week.
There are also major data releases this week:
Tuesday CPI
Wednesday PPI
Thursday Euro CPI
Thursday US Initial Jobless Claims
I do not expect these data releases to have a major effect on the markets in their current state due to the risk appetite we've seen in both crypto and equities, such shallow pullbacks prove the demand is there to absorb and sell-side pressure for now.
Now is an excellent time to back strong projects with great fundamentals that are breaking out from downtrends/ranges in both their USD & BTC pairs, as BTC.D drops alts can print some great returns. Beta plays of ETH & SOL can offer higher returns than the majors themselves in these market conditions too.
Good luck this week everybody!
FET – HTF Setup Primed for ExpansionFET is looking strong here from a high time frame perspective — currently sitting around $0.739, well into the discount zone of the macro trend channel.
We’ve got:
✅ Price holding monthly demand
✅ A clear swing higher low forming on the weekly and 3W
✅ Already seen the first expansion leg out of demand
✅ Now potentially loading the next move higher
Zooming out, price is still trading below the midline of the long-term uptrend channel — and a move back to the upper boundary puts targets in the $6 region, aligned with a new higher high.
📈 HTF Structure
Midline rejection flipped support
Demand tested and respected
HL printed after clean retest
370% upside just to retest the prior HH at $3.50
HTF trend structure still fully intact
This setup is also supported by the broader HTF bullish bias across BTC, ETH, and majors, which adds confluence to a potential larger expansion phase for alts — especially strong narratives like AI.
🎯 Targets
🎯 $3.50 = prior high
🎯 $6.00+ = upper channel target / next HTF extension zone
From current levels, risk/reward looks very clean.
1W:
3W:
3M:

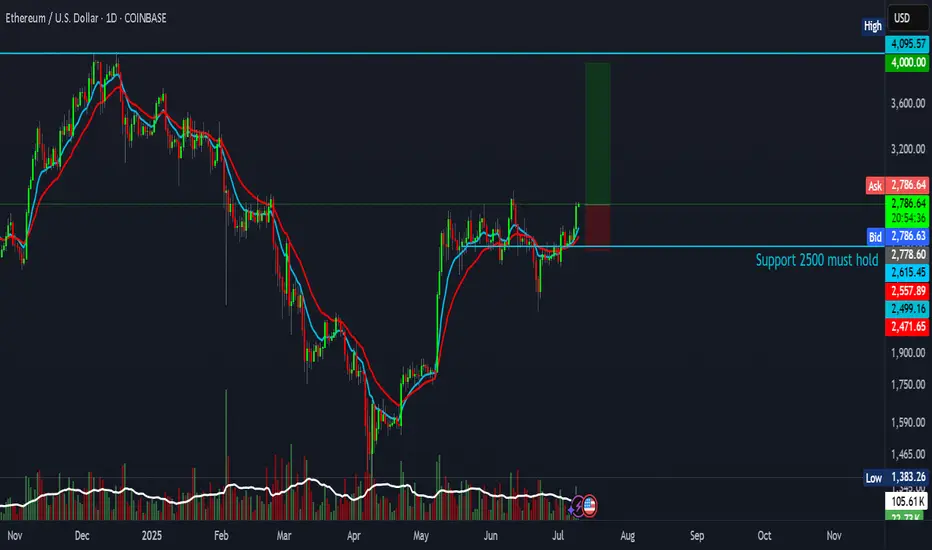
Ethereum trade setup with a 4:1 risk-reward ratioAnother attempt — and this one could be the real breakout.
This setup offers a 4:1 risk-reward ratio, targeting $4,000.
Entry: $2,780
Stop Loss: $2,471
Target: $4,000
Not financial advice.
Bitcoin Crash? No! The Bullish Wave Starts Now! $155,601 Next!Some people are still expecting for "Bitcoin to go down." Poor bastards, the advance is just starting. Bitcoin just broke out of a 210 days long consolidation phase. After this huge, long-term consolidation, expect a major advance. Next target is now set at $155,601.
This week is the first week green after the consolidation finally ends. The market was sideways for seven months, with some fluctuations, and the result is a bullish breakout. Why a breakdown? Why expect a drop? If the market just broke up—think about it—why would it go down?
If resistance is confirmed; you remember the range between $100,000 and $110,000. If resistance is confirmed then Bitcoin would start crashing down from $110,000. If the break of $110,000 does happen and Bitcoin moves to $112,000 as a bull-trap, then you would expect a major crash happening from $112,000 and no more. But, reality is saying, showing, something much different. We have a major advance. Resistance has been flipped into support.
Now, the first that is needed is the weekly close. It is still very early into this move but Bitcoin is showing maximum strength. Remember the altcoins? These confirm that the advance is just new, early, because these are recovering from all-time lows or major lows. There is still plenty of room for growth.
My people, wake up! Bitcoin is going up.
The next target is $155,601 and it can go higher, this is only the mid-term target based on the long-term. When Bitcoin consolidates for 7 months, it tends to grow some 137% on average, it can be less but it can also be much more. And it tends to grow at least for 1-2 months, but this also is just the average, Bitcoin can grow straight up for 4 months.
So, are you still bearish?
Oh please no! The bulls already won.
The 2025 bull market final phase starts now, soon you will experience a marketwide bull-run. We have not seen the euphoria phase, this is only the start. Prepare for additional growth.
I am calling out all of the bears, never bet down on Bitcoin; Bitcoin is going up.
Namaste.

Usual 1,122% Target Mapped · Can Go Higher Late 2025Usual grew 700% in one month, between November and December 2024. Then the market went on to produce a major lower low bottom and now everything is changing. I am sharing this one again because I believe it will produce a massive bullish wave.
Good evening my fellow Cryptocurrency trader, how are you feeing in this wonderful day?
A new week starts and with the new week we will have a new set of top performers. Remember that a rising tide lifts all boats. It is not only one project but the majority of the altcoins that are set to grow. It is a long drawn out process, do not be distracted by the illusion of easy or fast gains. If you can hold and do so strong, patiently, you can end up with big gains. The big wins accumulate after months. Buy the bottom, 7-April, 22-June and hold. Comeback in 2-3 months and see how the market is doing. Sell those trading high, buy those trading low.
USUALUSDT is now trading above EMA55 and EMA34. A strong candle and high volume came up to break each of these resistance levels. The same levels that rejected growth many times in the past three months.
In April, USUALUSDT tried to turn bullish but was rejected by EMA55 and EMA34. This same dynamic repeated once more in late April and then twice in May. When the market fails to conquer a resistance zone it tens to move lower looking for strength. That did it. After a major low and rounded bottom, we are now on the bullish zone.
USUALUSDT can easily grow 500% to 800% in the coming months. Without hitting a new all-time high, we have 1,122% potential for growth. From a previous chart, the 1,122% target gives us 1,950%. This is huge growth and it is possible that a new all-time high will be hit later during the bull run phase.
This is a friendly reminder. Opportunities are endless in this market.
Thank you for reading.
Namaste.

Sonic Moves Next · Expect Massive Growth Coming Weeks —300% EasyTwo pairs-projects will be moving strongly in the coming weeks, Sonic and Usual. This is the chart for SUSDT (Sonic) on the daily timeframe.
Notice how the action is moving back above the 3-February 2025 low (bullish). Notice the stop-loss hunt event recently. This events marks a bottom once it happens. After the event we see growth.
Finally, notice the very strong increase in trading volume. SUSDT is trading safely above EMA34. All these signals confirm strong growth in the coming weeks starting now basically, it is already happening as the action has been bullish since 22-June.
I am always giving you the best charts, the best timing in the Universe with the best results. I will continue to share daily but you need to follow. You can get notifications each time I publish and in this way you can be up to date with the Cryptocurrency market, the altcoins are moving ahead and this only happens once every four years. There are bullish waves in-between the bear market and transition years, but nothing like 2025.
The 300% on the chart is an easy target. This target can be achieved short-term maximum mid-term. Imagine the 100 years old index funds, it would take you 30 years to earn 300%. Oh my god! Leave that to your grandparents this is not for us.
My heart goes out to all the people still buying index funds related to the stock market. It is like using floppy disk still in the year 2025, we have USB sticks and smartphones, floppy disk were discontinued long ago. Buying SPX index funds and such stocks instead of Crypto is like buying CD-roms to store music, we streaming now not even MP3.
The future of finance is Crypto. Altcoins is the way to go. If you are already in this market you are ahead of the pack. You will look like a genius 10, 15, 20 years from now. For you and for me it is normal but actually, only the minority knows well enough the game. There is plenty of room left available for growth. Crypto is young.
Namaste.

bitsCrunch 608% & 1,619% Easy Targets · 2,630% Possible Or MoreI am going with a classic on this project and Cryptocurrency trading pair, the RSI bullish divergence.
We are going to be looking at bitsCrunch (BCUTUSDT) on the request of one of our great followers. This chart is awesome. A true bottom catch—all-time low just hit—with high potential for growth and strong bullish reversal signals. Let's get started.
BCUT's daily RSI bottomed around June 2024. Oversold. Red.
BCUTUSDT continued lower and set a low around September and then again November 2024 before a nice recovery. The late 2024 bullish wave might seen small here but it almost reached 900%.
Then came the correction, a strong one. BCUTUSDT broke it's 2024 support zone and hit a lower low. At this same time, the RSI produced a higher low compared to June 2024. This gives us the bullish divergence signal and this signal tends to support a change of trend.
BCUT went on after its 7-April low and produced a lower low, an all-time low, 10-July. A true market bottom. The candle for this session ended closing green with a long lower wick, which means bullish. Three days later we have a recovery. From now on, we can expect maximum growth.
The ~900% bullish wave in late 2024 shows that this pair can do wild numbers. If it can grow this much in just 26 days, imagine how much it can grow in 180 days. Good to visualize. Huge potential. A great altcoin choice.
1,619% and 608% are easy targets. The 2,630% target is do-able with a standard bull market.
Thanks a lot for your continued support.
Namaste.

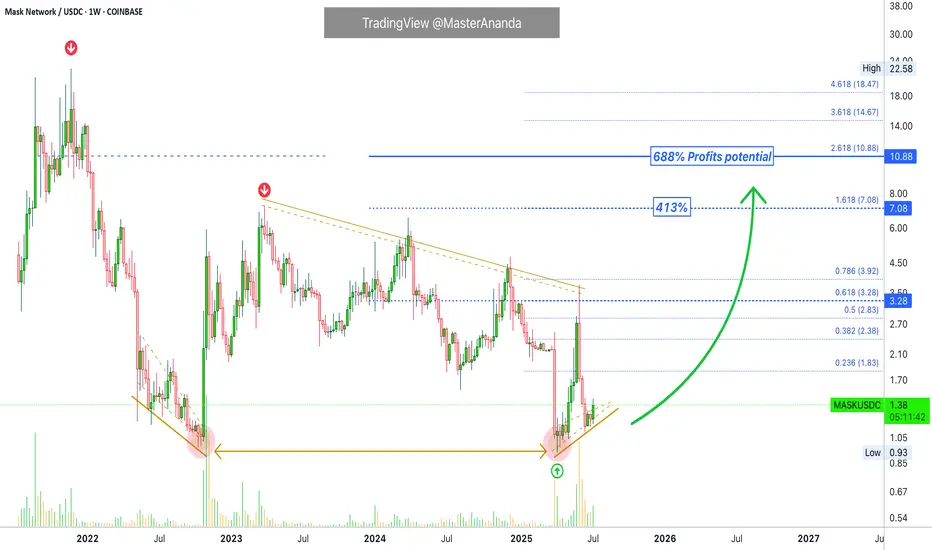
Mask Network Easy 688% Profits Potential Target ($10.88)The 2022 bear market for Mask Network ended October 2022. After a series of lower lows the project produced a bullish breakout until March 2023. It was the recovery wave with a total of 650% growth.
MASKUSDT went bearish again from March 2023 but instead of a bear market wave it produced a long drawn out distribution pattern.
The next major low happened 7-April 2025. More than two years producing lower highs and dropping, and I consider this low to be the end of the bearish period. MASKUSDT will now resume growing as part of a new bullish cycle and uptrend.
The 7-April low was followed by higher lows. Compare this to pre-October 2022 when the market was producing lower lows instead. Higher lows then a strong bullish breakout in May. Total growth for the initial recovery reached 300%. This is where the market is now. There was a retrace and now we are seeing signs of a bullish continuation after a higher low.
Mask Network is good as prices are still relatively low. Seeing the big candles in the past, another huge big-candle will show up.
Looking at the chart, I am mapping a 688% easy target within the next 3-6 months. Coming from the 7-April low, hitting this same target would produce a total of 1,070%. I believe the market is very healthy and even higher is possible in late 2025 and beyond.
This is a good chart if you are a buyer and looking for pairs that can grow strong in the near future. If you are a bull, this is an easy buy and hold.
Namaste.