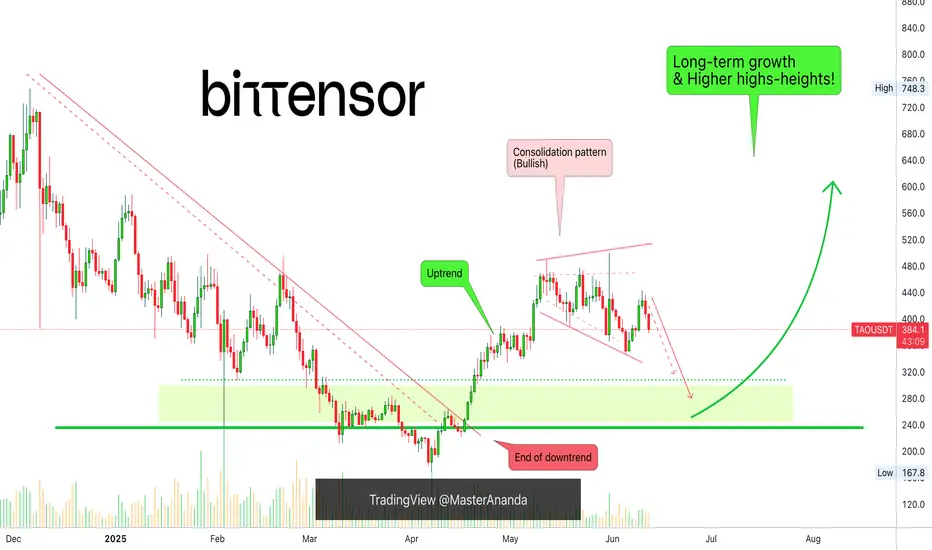
Bittensor Won't Go Much Lower (Long-Term Growth Explained)I am not concerned when looking at TAO (Bittensor) because I know that it won't go much lower and I also know, based on the chart, that it won't be bearish for much longer... And this is all great news.
Good... Good, good, good.
Good afternoon my fellow reader, I am happy to receive once more your undivided attention. It is my pleasure to receive your support.
Please, allow a minute of your time for me to read this chart.
It is the same pattern all over again, when the market is set to grow, it grows; but, long-term growth means months of prices moving higher and the market is never in a hurry to make you rich. So, it will grow but it takes time and time we have, time we want more, time we need but also we waste lots of time in things that are not productive, so let's use this time to plan for what will be coming next.
The moment is now, true. TAOUSDT and Crypto are bearish now and that's ok. You know why this is great news? Because being bearish now means that soon this phase will end. The market can only be bearish for so long. When it is bullish, at some point it turns bearish but, when it is bearish then again it moves back up.
TAOUSDT is already very close to strong support and this support will be the end of the bearish wave. Give or take one week and this will mark the start of the next bullish phase. Three months of sustained growth, another retrace and the more growth, on and on and on.
So, prepare now to be able to profit from the incoming bullish wave. The market will continue to fluctuate but with a strong bullish bias, and that is all that matters. We want to see our market grow because we will grow together with the market. If you are reading this, you are part of this market and that's very wise because Crypto is young.
Joining a new financial market in its early days... The opportunity of a lifetime and it was made for you to take.
Thanks a lot for your continued support.
It is truly appreciated.
Namaste.
Altcoins
Hyperliquid Correction Exposed, $16.6-$22.5 Range To Be TestedAfter a strong rise there is always a strong correction and I will call this normal market behavior.
Hyperliquid entered the TOP20 altcoins by market capitalization and now sits at #11. Amazing feat.
In a matter of 65 days, between 7-April and 11-June, HYPEUSDT grew a very nice 373%.
A correction can take prices back below the 0.618-0.786 Fib. retracement support range. Which means between $16.7 and $22.5.
As usual, after the bearish wave is over, we can expect a new wave of growth. This one should unravel fast.
Thank you for reading and for your continued support.
Additional details can be found on the chart.
Namaste.

Cardano, What To Expect!The action is turning bearish after a very weak bounce from "higher low" on the chart. There is a sequence of local lower highs on ADAUSDT daily. What to expect?
Expect a test of the "higher low" zone as support and this zone breaking. The next level that will come into question is the "main support" but this one isn't likely to be tested.
Picture the action going lower towards support and ending right in between 'higher low' and 'main support'. This is the main scenario.
This scenario will keep the broader bullish structure intact and at the same time would end as a major market flush. As many weak hands as possible are removed and yet the bulls will remain in control.
Make no mistake, whatever happens in the short-term, Cardano will continue to grow. This is only a temporary event. Patience is key.
Thanks a lot for your continued support.
Namaste.

Ethereum Set To Continue Lower, How Long?The drop is now confirmed and yet, it is still early...
Good afternoon my fellow traders, all is good when we consider the chart, Ethereum's price and the bigger picture, nothing changes. But we are witnessing a retrace. This retrace will end in a higher low and I am thinking of time now, duration.
Initially I was thinking about the Fed meeting and this event being the catalyst for change, but the Cryptocurrency market is following its own cycle and for it to be super bullish later this year, all bearish action, all weak hands, needs to be removed now, today.
So the bearish action can fluctuate between just a few days, 3-5 days, to 1-2 weeks. That's my analysis based on past history, chart data and experience.
The retrace might not last that long though, market conditions continue to improve and Ethereum might not produce a lower low compared to Bitcoin. Bitcoin is trading pretty high and a correction can develop any day. Since Ethereum is already low compared to its ATH, there is less room for prices to move lower, makes sense?
The downside is always limited, SHORTing is riskier than going LONG. It is wise to wait for a new entry before buying more. Experienced traders are recommended to SHORT. This chart setup will change in a matter of days, and then the market will turn bullish again, long-term.
Thank you for reading.
Namaste.

Bitcoin's Price Action Reveals A Bearish Ethereum—Back To BasicsBitcoin is bearish, top confirmed; we know Ethereum and Bitcoin move together in the exact same way. This means that Ethereum will also move lower.
Here we have a higher high but lacking strength, volume is dropping. There will be a continuation of the retrace.
Consider waiting (SHORT) until after the FED decision result. The market can remain slightly bearish until after the event. The drop will open the doors for new entry prices. Market conditions can always change.
We are live with a 20X SHORT on Bitcoin, Ethereum will do the same. Just a small drop (can be a strong drop) ending in a higher low followed by a new wave of growth. Not all charts/pairs/projects are the same. Some will move down while others move up. Sell at resistance, buy at support.
Namaste.

Bitcoin's Correction Confirmed, 93-97K Next TargetBitcoin's bearish continuation is now confirmed with three consecutive days of bearish action, today being a full red candle.
Good afternoon my fellow trader, how are you feeling today?
Opportunities are endless in this market, and if you trade, you can profit from the bullish as well as the bearish waves. Good entry timing is all that is needed for a successful trade, the right map and mindset.
So the lower high is confirmed and today's action confirms an incoming lower low. The 100K support is very likely to break but this is not written in stone. This is a high probability scenario. We are aiming for a price range of $97,000 - $93,000. But this isn't necessarily the end. Depending on how this level is handled, we will be able to know if prices will go lower or what.
$88,000 is a good level in the case there is strong bearish volume when the above price range is challenged as support. Now it is all a wait and see. Patience is key.
Once the a new support zone settles, we adapt to the market and focus on green. The next step is red. Down we go.
Thank you for reading.
Namaste.

ADA | Liquidity Drain or UPSIDE POTENTIAL??ADA is lacking behind in terms of altcoins this season. We've not yet seen the new highs or parabolic increases that is due for a new BTC ATH.
We're seeing higher highs, and higher lows in the macro which is a bullish sign - indicating the trend is still BULLISH
From the macro, we do see a better picture.. at least THIs time around, the accumulation cycle isn't in such a tight range, and you could day trade / swing trade:
_______________
BINANCE:ADAUSDT

Bitcoin New ATH - Where now?After Bitcoin makes new all time highs, the next steps are very important. Where price goes now can be tricky to predict as there is the rare factor of price.
One of the only ways to predict where BTC may find resistance during price discovery is to use Fibonacci levels, using Fib extensions the first target for me would be between $117,500-$120,000. This area would be between the fib extension and the big even level, RSI would also be overbought on the daily time frame.
For the bearish scenario I think it's a much simpler play from a TA standpoint, lose the trend channel and get back under the old ATH level and I think we see a pullback towards $97,000. After such an extreme rally over the last 2 months with little to no rest a 10% correction would not be out of the ordinary despite such bullish ETF inflows. I have mapped a second target area should $97,000 fail, a SFP of the range can lead to a retest of the midpoint, this correction path would be much more severe with a more than 15% move lower.
To sum it all up Bitcoin has been on a great run in the last 2 months and has reached most traders common target of making a new ATH. Now there must be a new objective... Continue the move into price discovery or a corrective move? Price discovery has no previous selling history and so Fib levels along with big even levels are used to predict resistance levels. Corrective move would mean dropping out of the bullish trend channel and falling into a place of support, in my mind that would be ~$97,000 or failing that ~$91,000 (range midpoint).

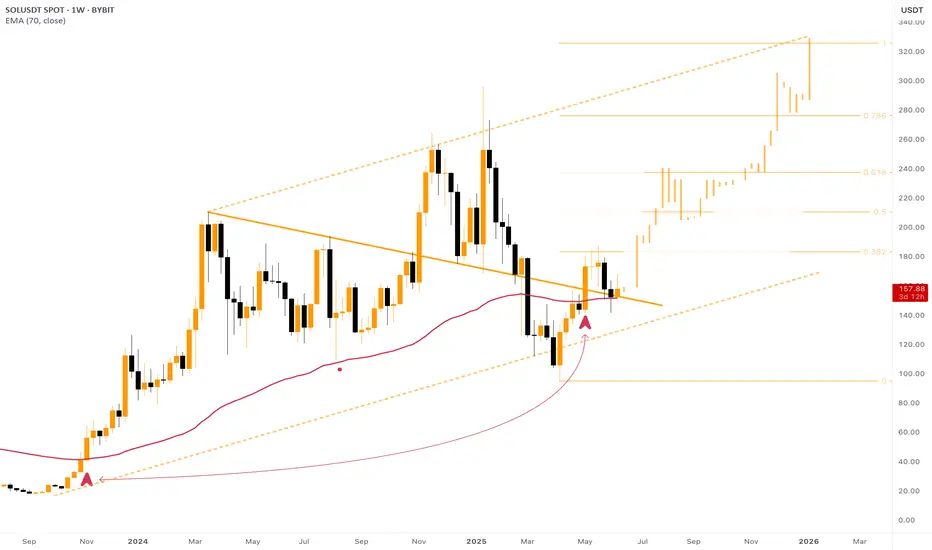
$SOL - Ready for a STRONG Comeback to $300!Throughout 2024 Solana has been moving within the Massive Ascending Channel . It does these days too.
Recently, back in March 2025, there was a fake breakdown of the channel's ascending support. It ended up with a strong pullback above the line. Moreover, the descending trend line that was initially formed in February 2024 was also broken upwards.
Signs of strong bullish volumes.
At the moment the price is consolidating above the EMA500 of 1D chart (EMA70 of 1W) , just as it did back in November 2023 before the famous x7 rally from $30 to $210.
Breakout of the 0.382 lvl by Fibo will mark the beginning of a new rally upwards. Target for this upward movement on CRYPTOCAP:SOL is $320 , must be reached in 2025.
KAS-USDT (Bybit spot), 4-hour candles TA+Trade plan1. Market context & chart structure
Asset / venue / timeframe: KAS-USDT (Bybit spot), 4-hour candles, data to 12 Jun 2025 06:45 UTC (see image).
Primary pattern in play: Price has compressed into a contracting (symmetrical) triangle that began after the 28 May low. The apex is only ~1–2 candles away, so a decisive break is statistically imminent.
Preceding structure:
17-day descending channel → capitulation into a falling-wedge reversal (27–28 May).
Two-legged double-bottom (“Bottom 2”) at 0.075–0.078 USDT.
Sideways rectangle 29 May-7 Jun, now morphing into the present triangle.
Key horizontal levels (4 h closes): 0.0930 (upper triangle rail / neckline) · 0.0891 (local supply) · 0.0797 (strong demand / wedge base) · 0.0620 (monthly support)
Volume picture: Realised volume has been drying up since 31 May, a classic pre-breakout contraction. A spike on the break will confirm direction.
2. Indicator read-out
Market Cipher B - Green momentum wave printing, money-flow bars just turned positive Mildly bullish, Early bull divergence vs 28 May
RSI(14) - 46 and curling up - Neutral-to-bullish Hidden bullish divergence vs price higher-lows
Stoch RSI 26/24 and crossing up from oversold Bullish Momentum reset complete
ArTy Money-Flow Index +3.5 and rising Bullish Positive inflow after five sessions of outflow
Collectively the oscillators favour an upside resolution, provided volume confirms.
3. Scenario probability matrix
Scenario Trigger & confirmation
Option 1 – Uptrend continuation
4 h close ≥ 0.0925 USDT with volume ≥ 2× 20-period average
Measured-move 0.107 → 0.118;
extended fib 1.618 ≈ 0.125–0.128
Est. probability: 60 %
Option 2 – Downtrend resumption
4 h close ≤ 0.079 USDT with similar volume spike 0.072 (range EQ) → 0.067–0.062 structural support
Est. probability: 40 %
Weighting derives from: oscillator bias, shrinking supply above 0.092 (order-book heat-map), but tempered by external models calling for a short-term dip toward 0.067 USDT
4. Trading plan
Component Long (Option 1) Short (Option 2)
Entry Buy stop 0.0926 USDT Sell stop 0.0789 USDT
Initial stop-loss 0.0838 USDT 0.0870 USDT (back inside triangle)
Primary target-1 0.1050 (≈1R) 0.0725 (≈1R)
Secondary target-2 0.1180 (≈2.5R) 0.0670 (≈2.5R)
Position size Risk ≤ 1 % of account per trade (adjust contracts accordingly)
5. Additional catalysts & risk factors
Macro-beta: BTC dominance and broad market risk-on / risk-off could swamp pattern-based setups; monitor DXY and SPX correlations.
Protocol news: Kaspa’s DAG-based roadmap upgrades and potential exchange listings remain upside catalysts. Conversely, lack of progress or regulatory headlines could accelerate a downside break.
kaspa.org
Weekend liquidity gaps: KAS often shows slippage outside US trading hours; consider reducing size or using wide stops if breakout occurs late Friday–Sunday.
6. To sum up
Bias: I lean 60 % toward Option 1 (bullish breakout) provided we get a 4 h close above 0.092 with volume confirmation. Otherwise, a flush to the 0.07 area (Option 2) is the alternative. Trade the break, not the prediction, and keep risk tight.

Dogecoin Bearish But...Yes, Dogecoin is bearish now but this is only a short-term situation, it is the end of a long-term correction. Notice the chart, Dogecoin has been producing lower highs long-term, since December 2024.
Recently, there was a major low in April and then a recovery and after this recovery we have local lower highs. The current drop is the continuation of the retrace that started 11-May. This retrace should end soon, within weeks or just a few days.
As soon as the low settles, we can enter the market bullish again. If you trade spot, simply wait. Day traders can easily SHORT but the range is short, after a small drop cover and switch back to LONG. Experts only.
That's the scenario. We are very likely to get a higher low compared to 7-April. If too many leveraged positions are open though and the market wants to remove those, there can be a long wick that pierces support for the action to recover the next day.
So, the drop can be fast, can be small, can be hard, can be easy or it can be short, it doesn't matter, once it is over, Dogecoin will continue to grow.
Patience is key.
Thanks a lot for your continued support.
Namaste.

XRP Showing Some Weakness But...Here the bearish signals are not as pronounced as they are on Bitcoin or some other pairs which are basically trading near their all-time high, XRP is in a different situation. Still, a lower high is in place and trading volume is really low right now. This low volume always works as a continuation signal, which means it has no value. Whatever the chart is doing that is what is happening for real.
The main high happened 12-May and then a retrace. The lower high happened 9-June but then again today. Today's session wicked higher but it is already full red. Again, the signals are weak but we know the market is all the same. The big cap. projects move together, if Bitcoin goes down, Ethereum goes down, if Ethereum goes down, Cardano goes down, if Cardano goes down XRP is going down, etc. But we can also look at the charts individually.
On the other hand, smaller pairs can be growing strong and thriving, some will grow while others move down, why? Because we are in bull market zone. When the market is bearish, a bear market, Bitcoin goes down and everything follows. When the market is bullish, many can grow while some go down. This is what is happening today.
Wait patiently (SHORT), once support becomes established we can enter again.
We don't know if the market will produce a higher low short-term, vs 5-June or a lower low. But it is wise to secure your position because things can change in a flash. A higher low is possible which would mean a non-event, but, seeing the lower high and the low volume weakness, a market flush is likely to take place.
If we are set to experience new heights in late 2025, the correction must happen now, and with this statement the chart agrees. Down we go. It is still early though for this pair.
We will see how it goes.
Thank you for reading.
Namaste.

Solana's Retrace Isn't Over, Lower HighSolana's retrace is not over, some weakness is showing up on the chart. Here we have a strong lower high on the daily timeframe coupled with very low trading volume. Low trading volume at this point signals that buyers are just not present. When no new buyers are present, the market will continue in the same trend. The trend is the drop that started 19-Jan, confirmed 23-May with a lower high. Today, a local lower high points to even lower prices.
Once the retrace is over, we can expect a new wave of growth; for now, we have to step back and watch (SHORT) until a new support level forms. When support is in, we can again buy (go LONG).
Sell at resistance, buy at support.
Adapt live to market conditions.
Thanks a lot for your continued support.
Choose wisely. Be smart.
Namaste.

Altcoin MarketCap - Consolidating Before the Ride!On the chart you can see a Pure Capitazation of Altcoins - Crypto Market Cap Excluding Bitcoin, Ethereum and ALL Stablecoins.
There was formed a very clear model that has all chances of repeating once again:
First goes a strong ascending movement from 0 to a bit higher than 0.618 Fibo lvls.
Then there is a correction inside the descending channel/bull flag down to ~0.382 with one long shadow below that sets a 0 point for a new cycle.
Breakout of a bull flag follows after.
Final stage before the growth is consolidation in the range of 0.382 and 0.5 levels by Fibo.
Pump.
We are currently at the 4th stage , as you might have guessed. The consolidation can still take some time, up to a couple of months, since there are no specific time restrictions that invalidate the model.
However, this doesn't cancel the fact that the target is 1 by Fibo, namely $1.7T MarketCap of Altcoins, which is x2 from current points . I tend to believe holders deserve such a run.

Bitcoin Dominance Will Drop To 60% SoonGood Morning Trading Family,
I really don't have much to say on this post. My last post on Ethereum showed us an inverse head and shoulders pattern, which plays out over 85% of the time. This is a clear sign that altcoins may rally within the next week or two. And here, on our Bitcoin dominance chart, you can see that the patterns are clear, BTC dom cannot last at this level much longer before a breakdown to 61% or lower occurs. Be prepared. FOMO will get real.
Best,
Stew

Kaia Very Easy 235% & 392% Profits TargetsLook at the price action on this chart, this is a classic. KAIAUSDT goes extremely bullish as soon as it opens for trading. The bu-wave peak leads to a correction, steep decline. The decline slows down but still going lower. Then the trend changes completely, instead of lower the pair in question starts to rise from its base, a reversal.
Just as we had a steep decline, there will be a strong rise after the end of the bullish consolidation phase.
The targets can be seen on the chart. We have two very easy targets with more possible if you are focusing on the long-term.
Make sure to do your own numbers and planning. I am only reading the chart for you, you have to take care of the rest.
Thank you for reading.
Namaste.

ETH - Finally Support!Hello TradingView Family / Fellow Traders. This is Richard, also known as theSignalyst.
📈ETH has been overall bullish trading within the flat rising channels marked in blue.
Moreover, the green zone is a strong support zone!
🏹 Thus, the highlighted blue circle is a strong area to look for buy setups as it is the intersection of support and lower blue trendlines acting as non-horizontal support.
📚 As per my trading style:
As #ETH approaches the blue circle zone, I will be looking for bullish reversal setups (like a double bottom pattern, trendline break , and so on...)
📚 Always follow your trading plan regarding entry, risk management, and trade management.
Good luck!
All Strategies Are Good; If Managed Properly!
~Rich

Bitcoin Dominance Update – Key Levels in Play!Hey Traders!
If you’re finding value in this analysis, smash that 👍 and hit Follow for high-accuracy trade setups that actually deliver!
BTC Dominance is testing a major resistance zone after a sustained rally from late 2024. The structure is showing signs of exhaustion near the 64-65% zone.
🔶 Pattern: Rising wedge breakdown
🔶 Current Action: Retesting broken support zone as resistance
🔶 Key Resistance: 64.5% - 65%
🔶 Rejection zone: Strong supply sitting overhead
Why this matters for Altcoins:
A rejection from this zone could open the door for capital rotation into altcoins.
BTC dominance stalling = potential for ETH, SOL, and midcaps to gain momentum.
If dominance goes down, it may keep altcoin rallies capped for now.
Monitor closely — dominance breakdowns often align with altseason rotations.
💡 Stay patient, stay prepared.

What if...What if instead of a 6-12 months long bull market instead we see a 2-3 years long bull market? What if...
Instead of one big extended bullish wave we see slow and steady growth long-term, with no more huge crashes as the market evolves. This already happened in the past leading to the 2017 cycle top. The market grew in 2015, 2016, 2017...
Here we have DYDX producing lower lows. Maybe supply is expanding, maybe something with the way the token works, I don't know, the chart is showing lower lows, but this is still a transition period, other charts are producing higher highs and higher lows.
The recent drop below the lower trendline is called an "excess," a market excess and this type of move tends to be corrected almost right away. The action will move back above the trendline and then produce strong growth.
What if instead of a super fast and strong bull market we get a long-term drawn out one. The latter scenario would be the best. What if... I am open to seeing it happen, what about you?
Thank you for reading.
Namaste.

The 23 Years Long Cryptocurrency Bull Market CycleWe are looking at Crypto Total Market Cap. Index (TOTAL).
The weekly session trades at the highest level based on candle body since January 2025. The recovery has been swift. It started in April and after three green weeks there was a red week. Then three more green weeks followed by two red weeks. And now we are green again.
If the same pattern repeats, we get three green weeks or more followed by another retrace small in size. The main target for this already big bullish wave stands at 4.61T. This is a very strong bullish period already as it started in early April, it has been going for more than two months.
The market tends to grow and become more and more bullish, that is, bullish momentum starts to grow. When the action is really heating up doubt starts to creep in. Will it really continue higher? Is there a crash just around the corner? The crash happened last week.
If you notice last week's candle, it has a long lower shadow and a very small real body. It is a classic reversal signal. This week being full green confirms this reversal but the week is early.
TOTAL is the entire Cryptocurrency market, then we have individual charts. When we look at some altcoins in isolation, we know the top is far from being in, we know this only too well. Let's look at some examples. Ethereum, far from the top. Litecoin, very far. Dogecoin, Cardano, XRP, etc, etc, etc.
Bitcoin is now a completely different domain and is basically trading at a new all-time high. If this was the case while all the altcoins are also at new ath this would be worrisome, but the truth is that Bitcoin now has institutional demand and that's why it is so strong. There is no point in selling because whales are buying and will continue to buy, money is endless of course and money is becoming cheaper and cheaper all around the world. It is also coming to country near you but it is already happening. Remember, the cycle goes up and then down when it comes to interest rates. It already hit the top, peaked and now it is going the other way. This to say that there is room for so much growth.
Things tend to repeat, cycles tend to repeat until they don't. Literally, you can have a pattern where you do the same daily, weekly, monthly, for years until some time when you stop, it works like this with Crypto and other areas of the world. Bitcoin can produce a certain cycle and a certain pattern for 15 years straight, and then, all of a sudden things change. Not out of nowhere of course, we are seeing the world changing right in front of our eyes. Technology?
Where was the world 80 years ago?
How much change we saw between 1980 and 2010?
How about 2021 and the pandemic? You see, it continues to change.
Now it is money. You can have centuries of the same financial system, the same monopoly, all the same. Then you have credit cards and virtual bank accounts and now it is code, Crypto; nothing new, it is the same old, the only thing permanent is change and the world continues to change.
So Bitcoin can have big drawdowns just a few years ago, and in the present, these become smaller and smaller, the same happened with the stock market and the biggest stocks. It keeps on changing.
It goes from highly volatile, unpredictable and unstable to stability and growth long-term. Humanity is on a rising trend and this will always be reflected across all areas of life, finance, health, education, freedom, prosperity, liberty and the rest.
We are going up. Forever and then some more.
It is great to be alive in this world.
Namaste.

Moonriver 331% Profits Potential Target Mapped (Volume Breakout)Moonriver today produced the highest volume daily since December 2024. The big difference between now and then lies in the fact that in December MOVRUSDT was trading near a peak while today it is coming out of a higher low. Increasing volume in this situation means the start of something positive for the bulls.
For example, last year after some bearish action the first high volume candle came in October. After some choppy action, we experienced a strong bullish wave.
So now we have high volume today and this is only the start. We will see grow and more volume and bullish momentum building up... It will all accumulate and culminate in a massive bull run.
Thanks a lot for your continued support.
Namaste.

Avalanche Recovers & Then Some... (Targets: $40-$46 & $81)I will keep it short, sweet and simple. Avalanche is recovering nicely with five consecutive days closing green; higher low; trading back above the 3-Feb. low (orange line) and marketwide bullish action.
The action is happening in the green zone, the bullish zone and a local higher low will lead to a higher high with a target of $40 first. This is the next target and it is an easy one. It will definitely move higher but consider $40-$46 the first strong barrier.
The main target sits at $81. I think the time horizon for this one is 1-3 months. Within 3 months, all these targets will be hit and then we will be blessed with additional growth.
Thanks a lot for your continued support.
If you enjoy the content, feel free to follow. I share new charts every single day.
It is my pleasure to write for you.
Namaste.

Worldcoin, How Long Will It Take For A $30 (2,544%) Target?Do you think a $30 target is possible for Worldcoin in under 6 months? What about a target of $19?
$19 gives 1,552% while $30 would yield a total of 2,544%. That's potential profits for this newly developing bullish wave.
The low was hit more than two months ago already, 7-April. This is important. Normally the build-up process takes some three months, and we are already two months in. This means that next month the market can become extremely green. Or by the start of next month everything will be 3 to 5 levels up. For Worldcoin this would be a minimum target of $9. That's 729% potential profits.
Two months just to recover from the market bottom. Three months for bullish momentum to be fully present and a new high established. Then a retrace or correction and then the final jump, makes sense? This is just a map, it can help us navigate the market, plan ahead.
We adapt to market conditions though as things can always change but this is the picture. This is how it always goes. The surprise can be prices moving beyond our calculations and that is always a nice surprise and welcomed.
Six months from now will put us in December 2025.
The next top can happen between October and December this year. These are good dates.
Since this project peaked in March 2024, no strong high in late 2024 or early 2025, this can be one of the pairs that continue growing into 2026.
Remember, some will end their bull market this year for sure and enter a bear market, others will continue growing into 2026. This is the most important part to keep in mind, it will make all the difference when taking profits.
We will continue with this thought process in one of the next charts.
I think of you when reading.
(I mean, "Thank you for reading.")
Namaste.
