MACD weekly looks bullush, but the long term Monthly matters The Weekly MACD CRYPTOCAP:BTC looks like it's gaining traction. Will it hold? I don't think so
Altseason

ETHUSDT: Bearish Drop to 2840?BINANCE:ETHUSDT is eyeing a bearish reversal on the 1-hour chart , with price testing a key resistance zone near cumulative sell liquidation, converging with a potential entry area that could trigger downside momentum if sellers defend against further upside. This setup suggests a pullback opportunity amid recent consolidation, targeting lower support levels with near 1:3 risk-reward .🔥
Entry between 3020–3040 for a short position. Target at 2840 . Set a stop loss at a close above 3090 📊, yielding a risk-reward ratio of near 1:3 . Monitor for confirmation via a bearish candle close below entry with rising volume, leveraging Ethereum's volatility near highs.🌟
📝 Trade Setup
🎯 Entry (Short):
3020 – 3040
🎯 Target:
• 2840
❌ Stop Loss:
• Close above 3090
⚖️ Risk-to-Reward:
• ~ 1:3
💡 Your view?
Does ETH reject 3040 and slide toward 2840 — or will buyers absorb supply and push higher?
👇 Share your thoughts below 👇

Alts to make a move in Q1 2006The Altcoin market is still holding strong above the trendline.
Are we entering a supercycle? Your Thoughts?

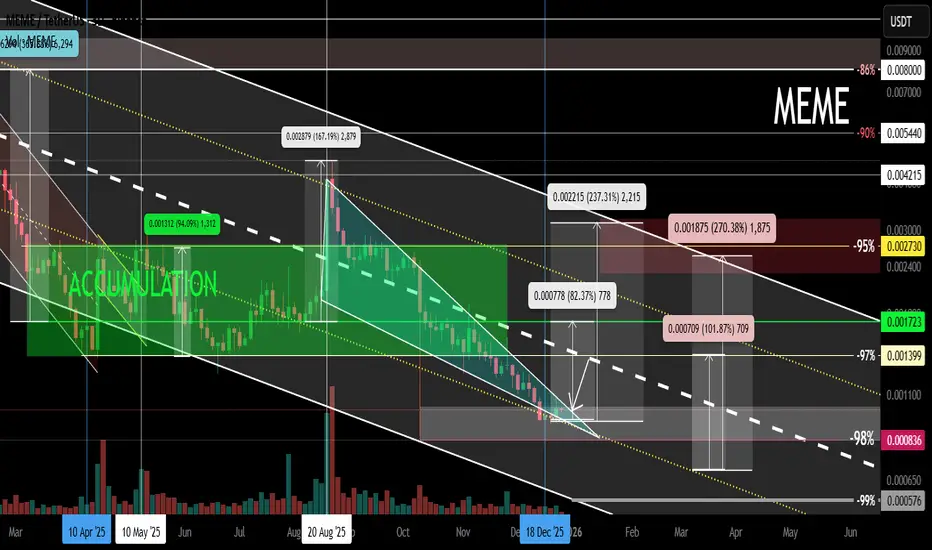
MEME Local Trend. Wedge. Reversal Zone. December 27, 2025Logarithm. 3-day timeframe.
The main trend is shown for clarity (dynamic support zone of the internal descending channel).
-98% decline from the high
The price is near the long squeeze zone, 10 10 2025. A descending wedge has formed, and the price is being squeezed. This is the local trend reversal zone if its resistance is broken, which can occur through sideways consolidation, i.e., a double bottom or dragon...
Unlock MACD Mastery: Catch Trends Before They ExplodeThe Moving Average Convergence Divergence (MACD) is a trend-following momentum indicator that shows the relationship between two moving averages of a security’s price.
It consists of:
MACD Line: 12-period EMA minus 26-period EMA
Signal Line: 9-period EMA of the MACD Line
Histogram: MACD Line minus Signal Line
MACD helps spot buy/sell signals, trend strength, and reversals – essential for Forex, Crypto, and Stocks.
How MACD Works (Quick Setup)
Add MACD(12,26,9) on TradingView. Positive histogram = bullish momentum 📊. Negative = bearish 📉.
Key Strategies
1-Line Crossovers
Bullish: MACD crosses above Signal → Buy signal.
Bearish: MACD crosses below Signal → Sell signal.
2-Divergences
Bullish: Price lower lows, MACD higher lows → Potential reversal up.
Bearish: Price higher highs, MACD lower highs → Potential reversal down.
3-Zero Line Crossovers
Above zero = Bullish trend strength.
Below zero = Bearish trend strength.
Real Examples Right Now (Dec 27, 2025)
Bitcoin ( BINANCE:BTCUSDT )
*** In the chart which you see, I I have highlighted key points including MACD Line, Signal line, Crossover, Divergence and Histograms. ***
⚠️As you can see in the chart, MACD send the bearish signal in BTC'S ATH (All Time High) on around 6th October.
Pro Tips
Combine with RSI or support/resistance for confirmation.
In trending markets like Stocks, focus on crossovers; in ranging markets like Forex, use divergences.
Adjust periods for volatility (e.g., MACD(5,35,5) for Crypto).
Always backtest – don't trade blind!
Level up your charts with MACD today and ride the trends!
What's your go-to MACD setup? Share below! 👇

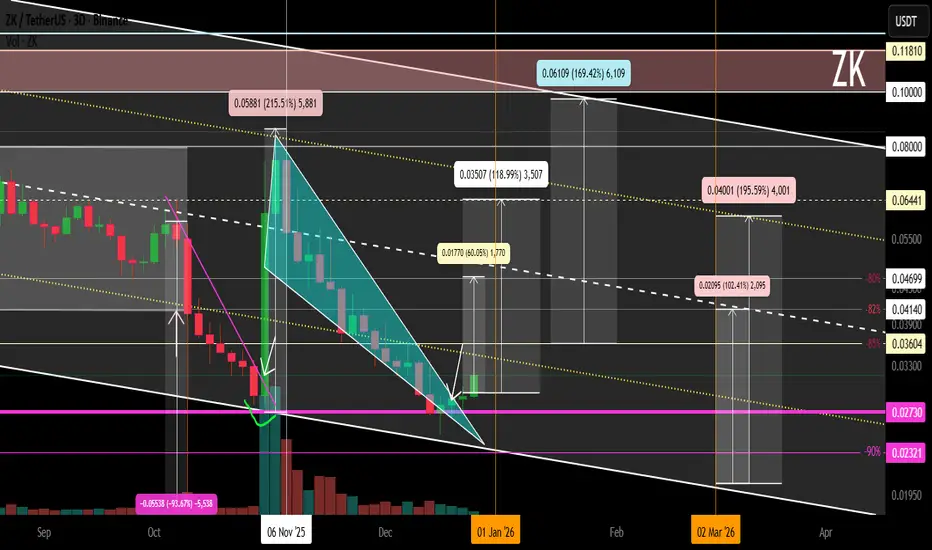
ZK Local Trend. Wedge. Reversal Zone and %. 2025 12 27Logarithm. 3-day timeframe.
Main trend for clarity (lower zone of the descending channel).
Declines from the high ("funds are buying 458 million worth of nothing") - 90%.
The long squeeze, due to the extremely low liquidity of the former hyped "saving the world" instrument, was carried out by a phenomenal -93% on a half-empty order book.
Secondary and local trends .
The key is a breakout of the descending wedge and local resistance zone.
Reversal zones and % of key support/resistance levels for building a trading plan and risk management.
Most market participants find it very unpleasant and difficult (they can't bring themselves to) to buy low (fear) and sell high (greed). For them, it's the other way around.
Manage your risks and stick to your trading plan. Don't get caught up in market and news noise, which shapes the opinions and illogical actions of the majority, who are doomed to lose in the future.
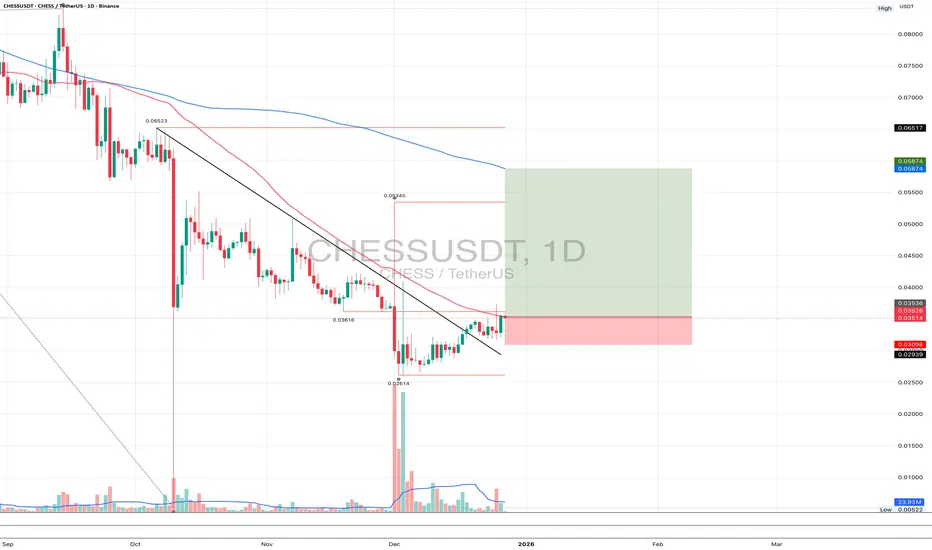
CHESSUSDT 1DShort technical update 👇
On the daily timeframe, CHESS broke its bearish structure and completed a clean retest of the breakout level. The retest held, selling pressure is fading, and higher local lows are forming. The current structure suggests a recovery phase after a prolonged decline. The base scenario is a continuation to the upside with a move toward the MA200 as the next key mid-term target.
$BTC Weekly: Healthy Pullback, Bullish Structure Intact.On the weekly chart, CRYPTOCAP:BTC looks like it’s just cooling off after a strong move.
Price is sitting in a key support zone around the mid-$80,000 area, and as long as this holds, the bigger trend remains bullish, with room to move toward $ 120,000.
DYOR, NFA

ZECUSDT: Bearish Drop to 354?BINANCE:ZECUSDT is eyeing a bearish continuation on the 4-hour chart , with price testing the upper boundary of a descending channel after forming lower highs, converging with a potential entry zone near resistance that could spark downside momentum if sellers defend amid recent volatility. This setup suggests a pullback opportunity in the downtrend, targeting lower support levels with strong risk-reward exceeding 1:5 .🔥
Entry between 450–458 for a short position (entry from current price with proper risk management is recommended). Target at 354 . Set a stop loss at a daily close above 470 , yielding a risk-reward ratio of more than 1:5 . Monitor for confirmation via a bearish candle close below entry with rising volume, leveraging the channel's bearish bias.🌟
📝 Trade Setup
🎯 Entry (Short):
450 – 458
(Entry from current levels is valid with strict risk & position management)
🎯 Target:
• 354
❌ Stop Loss:
• Daily close above 470
⚖️ Risk-to-Reward:
• > 1:5
💡 Your view?
Does ZEC reject the channel top and flush toward 354 — or will buyers force a deeper correction?
👇 Share your thoughts below! 👇

$GUAUSDT Breaks Out, Bullish Structure Holds.MEXC:GUAUSDT.P 4H has broken out after a long consolidation and is holding above the rising trendline.
As long as this support holds, the bullish structure remains intact.
DYOR, NFA

$SEI - Price analysis: [LT Bottom is in?]NYSE:SEI - Price analysis:
🟥Bearish on the daily basis, stuck inside the downtrend channel structure
🟩Bull div RSI cooking 📈
🟩Clean Double bottom H4 📈
🟩Reversal structure & trend shifting 📈
Bullish setup possible if price hold above the 1.050$ double bottom (LL).
We could see a 30 to 50%+ bull correction! 🚀
Highly oversell (ichimoku) weekly & current price is also sitting on monthly demand zone!! (open drive)!


When Will Altseason Start? When BTC reached 120k📈 One of the most common questions I get:
WHEN WILL ALTSEASON START?
Here’s the answer 👇
🔻 The real problem: memes drained all the liquidity.
The money that was supposed to go into fundamental projects in the summer of 2024.....got redirected into memes.
Yes, some people made money on that. But most retail traders?
They didn’t.
Of course, you can show profitable wallets. I also made money, but it was on insider information.
I think it would be perfect if Trump launched his token —
just like Argentina’s Libra — to show people one clear thing:
- Memes are dangerous.
-They suck liquidity and leave you with nothing but losses.
It’s a necessary wake-up call.
I didn’t want to say this, but maybe we need people to get burned by memes so they stop blindly throwing money at hype.
Some memes might still pump.
Yes, even some “fundamental memes” might outperform serious altcoins.
But in general?
The meme market is a trap. It's a money pit.
People think they’re great investors, but in reality — it’s a casino.
There’s no tech. No fundamentals.
I don't deny the “fundamental” memes may show growth more than other altcoins. I don't rule that out. But if we are talking about the general pool of memes, there is such a problem going on here that most people will lose money.
5% make money on memes, 95% lose.
I'm self-aware, and I'm in that 95%.
That's why I didn't invest in altcoins.
Development is dead ... for now. Nobody cares about building.
You can spend two years developing a serious product, burn through money, and try to improve the crypto space…
But most people don’t want that.
They want:
To buy pictures they like
As long as they look well-packaged.
That’s why we see so few good projects today —
everyone ran off to create memes.
But finally, we’ve reached a new stage:
People are starting to realize...
We need real, fundamental projects again.
Memes might still spike — especially near the end of the bull run.
But the market has finally started waking up.
⚠️ Yes, the market is broken.
But that’s exactly what we need — A bottom to bounce from.
Crypto’s future is bright.
The next 10 years — and even the end of this year — could look very strong.
But right now?
We’re not at the bottom in price.
We’re at the bottom in sentiment.
In faith. In energy.
This is a real turnaround.
From here, real projects will emerge with real audiences and real goals. That’s what will grow this industry—and this industry will shape the world.
Crypto moves fast.
All it takes is two green daily candles,and suddenly everyone screams:
“It’s back! New bull market!” Funny… but predictable.
Back to reality.
We’re at a point where liquidity is gone. People are out of funds.
Panic is setting in. “Cycles don’t work anymore,” they say.
People start selling to survive — for business, travel, life.
Even long-time holders are taking losses.
But when all the weak hands are gone, only the true holders will remain.
And who will move the market next?
Institutional investors
When the U.S. adopts Bitcoin as a reserve (which might already happen this May)... Other countries will follow.
Bitcoin will rally — and drag the market upward.
That’s when we’ll see:
The alt season will start only when Bitcoin is 120-130k.
Then profit taking and overflow into alts will start.
That’s when we’ll see:
-Institutional investors
-The Web2 audience
-Capital flowing into fundamentals, not memes
Because eventually, people will realize:
You don’t invest in memes.
You invest in utility. In value. In tech.
💥 Retail is the key.
The market needs mass participation.
Retail brings volume, and for that, we need:
Real news, Clear regulation, Trust and confidence
When that happens —people will believe again. And they’ll come running.
But then, like always...
Everyone will be convinced:
“Crypto is in permanent bull mode!”
Money will pour in. FOMO will take over…
...and then it ends.
The new bear market begins.
And I’ll be screaming about it — loud.
I do my best for you, EXCAVO.
_____________________
Disclosure: I am part of Trade Nation's Influencer program and receive a monthly fee for using their TradingView charts in my analysis.

ZIG - USDT - LONG TERM GEMI keep an eye on Ziggchain for the long term! 💎
Technical outlook: 🟩
📈 Weekly buy volume
📈 Falling wedge structure (monthly - weekly)
Fundamental outlook:
Guess what: Adoption & on-chain metrics keep growing on #ZIG + many exchanges keep integrating their chain over time 📈
As example: I traded another L1 under $ 0.020 a few years ago - same story could happen with adoption! (x50) 🚀
Short-term sell pressure remains strong & market fear is also present 🔴
We can expect to see a touch of the $ 0.0400 level (POC point monthly) before seeing a solid rally upward! 🚀
Alongside other L1s ( SHIDO, FWB:IOTA & NYSE:SEI ), that's one of the chains I'm accumulating via DCA 📈
📊 Key S/R levels marked in my chart.
⚠️ Not financial advice - DYOR.

FILUSDT: Bullish Push to 1.700?BINANCE:FILUSDT.P is eyeing a bullish breakout on the 4-hour chart , with price rebounding from the downward trendline and support zone, converging with a potential entry area that could ignite upside momentum if buyers break resistance amid recent consolidation. This setup suggests a reversal opportunity after the downtrend, targeting higher levels with strong risk-reward .🔥
Entry between 1.243–1.287 for a long position. Target at 1.700. Set a stop loss at 1.221, yielding a risk-reward ratio of approximately 1:10 . Monitor for confirmation via a bullish candle close above entry with rising volume, leveraging the pair's momentum post-rebound.🌟
📝 Trade Setup
🎯 Entry (Long):
1.243 – 1.287
🎯 Target:
• 1.700
❌ Stop Loss:
• 1.221
⚖️ Risk-to-Reward:
• ~ 1:6+ (very aggressive)
⚠️ Risk Notes (Very Important)
This setup carries elevated risk due to:
• FIL’s historically high volatility
• Broader altcoin market sensitivity to BTC moves
• Thin liquidity compared to majors
✅ Consider:
• Reduced position size
• Partial profits on the way up
• No over-leverage
• Strict respect of the stop loss
💡 Your view?
Is FILUSDT forming a genuine base for a breakout toward 1.70 — or just another lower-high before continuation down? 👇

ADAUSDT: Bullish Push to 0.45?BINANCE:ADAUSDT is eyeing a bullish rebound on the 4-hour chart , with price forming higher lows after touching the downward trendline and cumulative long liquidation zone, converging with a potential entry area that could ignite upside momentum if buyers defend against short-term dips. This setup suggests a reversal opportunity amid recent downtrend, targeting higher resistance levels with strong risk-reward .🔥
Entry between 0.3780–0.3880 for a long position. Targets at 0.43 (first), 0.45 (second). Set a stop loss at a daily close below 0.37 , yielding a risk-reward ratio of approximately 1:2.5 to first target and up to 1:3.5 overall . Monitor for confirmation via a bullish candle close above entry with rising volume, leveraging the pair's momentum post-rebound.🌟
📝 Trade Setup
🎯 Entry (Long):
0.3780 – 0.3880
(Entries within this zone are valid with proper risk & capital management.)
🎯 Targets:
• 0.43 (first)
• 0.45 (second)
❌ Stop Loss:
• Daily close below 0.37
⚖️ Risk-to-Reward:
• Up to 1:3.5 overall
💡 Your view?
Does ADA hold this demand zone and push toward 0.45 — or is this rebound just a dead-cat bounce before another leg lower? 👇

Altcoin Market Cap Building Energy Before Next ExpansionThe total crypto market cap excluding the top 10 continues to follow a familiar cycle of accumulation, breakout, expansion, and consolidation. After strong moves, the market typically ranges for a period before the next leg.
Currently, it is consolidating within a wide range, similar to past phases before major expansions. This suggests the market is building energy, not distributing.
A breakout above the range could trigger the next expansion phase for altcoins, while patience is needed until that happens.
NFA
Please hit the like button if you like it, and share your views in the comments section.

OTHERS (BOTTOMED)This EMA has always acted as the bottom for OTHERS in this cycle. I don’t think we’ll break it now — maybe that happens when we eventually get QE, but not at this stage. Altcoins are more oversold than any other asset in the market, and I expect strong growth over the next 2–4 months.

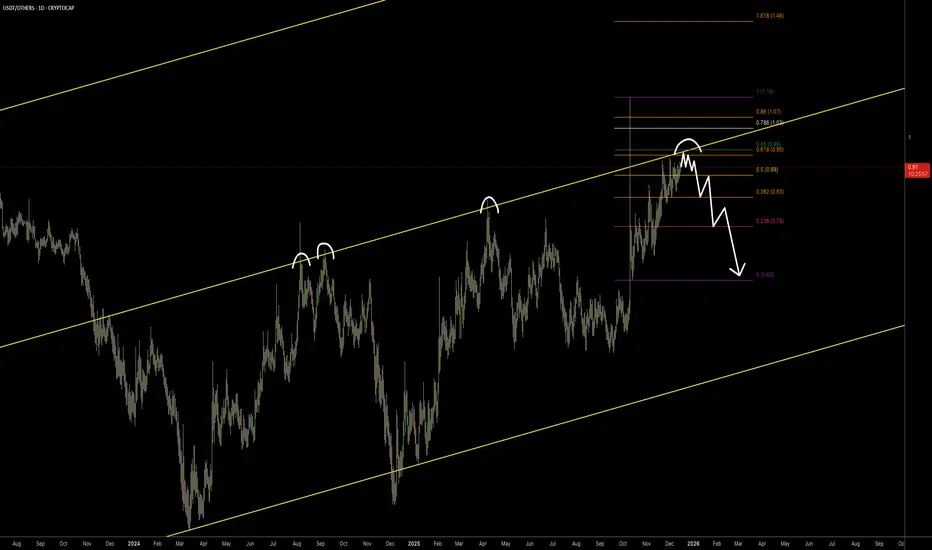
Altcoins likely have one last move left.If you look at the USDT/OTHERS chart, you’ll see that in this cycle, touching the channel’s midline has acted as the bottom for OTHERS. Historically, OTHERS has always put in its cycle low toward the end of December.
Sonic (Fantom) OutlookSonic, formerly known as Fantom has been on a steady downtrend since Nov 2024. It's already one-sixteenth compared to that time. Let's see if it rises from here!

THE - BULLISH! Not all charts look the same.
I'm betting on TSX:THE for the next big move! 📈
Highly undervalued PerpDex compared to Aave or Hyperliquid market cap 💎
Smart play:
I'm accumulating with DCA strategy for the long term. 📈
Not financial advice - DYOR before investing!

$OTHERS Crushed Against $BTC - WARNING!Small Cap Alts continue to be pummeled against CRYPTOCAP:BTC
CRYPTOCAP:OTHERS needs to find a bottom very soon and break above .14 otherwise they are cooked for the cycle.
I feel very sorry for people who have 80% + of their portfolio allocated to these.
Gonna create a ton of ₿itcoin-Maxis next cycle that's for sure

Altcoin's OutlookAltcoins have historically tended to overtake Bitcoin. We can see that the dominance of the top 10 altcoins correlates with the price of Bitcoin. It used to generally outperform it, but today it still has plenty of room to recover even in a pessimistic view. Altcoins will increase 10-50x depending on their distance from the all-time high (ATH).
