XRPUSDT — consolidation before the next impulseOn the 1H chart, XRPUSDT is consolidating after a short pullback, forming a flag pattern above the 2.45 support area. Despite a few false breaks, buyers continue to defend the trendline, signaling demand absorption.
The 2.45–2.52 range remains pivotal. A breakout with confirmation could open the way toward 2.63 (Target 1) and 2.82 (Target 2) — the next supply zones. As long as the higher-low structure holds, the bullish scenario remains intact.
Fundamentally, XRP still shows resilience amid the broader altcoin weakness. Ripple’s ongoing expansion in cross-border payments and hopes for a clearer regulatory framework in the U.S. support investor confidence.
This is a classic accumulation phase — expectations may diverge from reality, but that’s where strong trends are born. Keep emotions aside and wait for a clean breakout signal.
Altseason

NOT - 10% UP - TP4 HITI forgot this one: #NOT + 10% up from the range low 🔥
TP4 HIT ✅
32/33 Win trade yesterday on my personnal scalp strategy✅🏆
Absurd!!!
Follow for more! I'll share soon! 👍💥

Alt-season is coming.I see altcoin season coming. This chart illustrates Bitcoin back in the day as it made its way to the super moon. I see the same setup forming for altcoins—similar structure and market psychology. People are in disbelief that the super moon will come.
As always, stay profitable.
– Dalin Anderson

Ethereum is headed for a massive bull market. Hope you guys are ready for the fun part, because Ethereum—according to my analysis—is ready for some massive moves. This means altcoin season is coming in full force very soon. Be ready and ignore the FUD.
As always, stay profitable.
– Dalin Anderson

TAO Eyes Next Leg Toward $700!BINANCE:TAOUSDT is breaking through a key resistance zone, signaling a strong shift in momentum.
This breakout not only confirms buyer strength but also opens the door for a potential move toward the $700 region, where the next major resistance lies.
As long as TAO holds above this breakout zone, the structure remains bullish and continuation toward higher levels looks likely.
DYOR, NFA
THANKS FOR THE READ

SOL ; BUY OR SELL ?Hello friends
Given the decline we had, we can see it as an opportunity to buy at lower prices with risk and capital management.
Now we have obtained support levels for you and we have an important resistance that the price must break strongly to make the climb valid for us.
The goals are also clear.
*Trade safely with us*

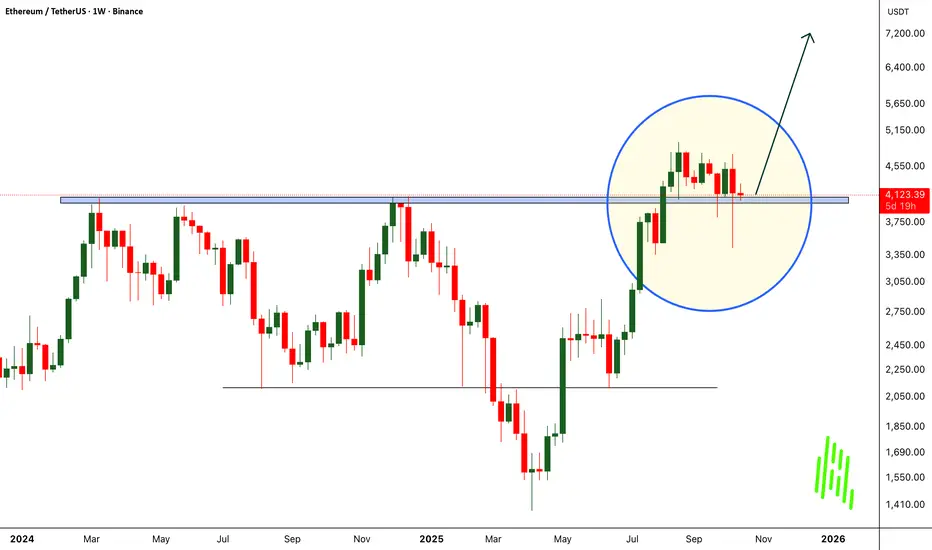
ETH Bulls Defending $4000. Can They Spark the Next Rally?After breaking out from a major resistance, BINANCE:ETHUSDT delivered a clean and healthy retest, just as expected. The bounce from that level showed strong buyer confidence, confirming that bulls are still in control.
Currently, Ethereum is holding a crucial support zone around the $4000 range. This level will play a key role in determining the next big move. If CRYPTOCAP:ETH manages to sustain and bounce from here, we could see the price rallying towards the $7000–$8000 zone in the coming weeks.
However, traders should stay cautious, a drop below $3500 could signal further downside and a deeper correction. As always, risk management is key in every setup.
Watch the $4000 zone closely, the next CITYINDEX:ETHUSD wave could be massive!
Follow Our Tradingview Account for More Technical Analysis Updates, | Like, Share and Comment Your thoughts
Altseason on the Horizon?Technically, BTC Dominance has retested the breakdown of the rising channel, confirming a clean rejection from the retest area.
If price manages to break below the current support zone, we could see a strong shift toward altcoins as capital starts rotating out of BTC.
This recent move also flushed out over-leveraged traders, resetting market positioning, a healthy sign before the next major leg.
Stay patient and always analyze your risk before entering any position. The next few weeks could be decisive for the altcoin market.
DYOR, NFA
Stay tuned for more update
THANKS FOR THE READING
#PEACE

NEAR Target Price 2025-2026NEAR is definitely a dark horse in the market.
Is it being manipulated and held down in price? Possibly.
Is there anything fundamentally significant happening in their ecosystem right now? Not really, and at the moment, other projects are shining much brighter.
This coin will either be saved by big players who can push it back to the $8–$9 range, or by major ecosystem developments that could unfold toward late 2025–2026.
Was the previous move to $8–$9 a manipulative rally to let the big holders unload? Also possible. There’s still too much uncertainty, but I believe that within several months, we’ll likely see $8–$9 again, and that’s the level where I’d be looking to exit positions.
Not financial advice.

ADA Price Target 2025 We’re currently moving within a narrowing triangle pattern. If the altcoin season continues without any major black-swan events, geopolitical tensions, or Fed actions that trigger public fear and institutional exits, we could see potential upside moves toward ~$1.2 first, and then ~$2.0 as a secondary target.
The breakout could be even stronger, but once large buyers start to quiet down ( SELL ), it’s usually wise to lock in profits and protect gains.

XRP, Terminal move complete. New all time high?What a mess Friday turned out to be with a recording breaking liquidation event with the numbers still growing - bigger than FTX!
SUNK COST FALLACY: THE DAMAGE IS DONE, DO NOT PANIC IN AND OUT OF POSITIONS.
So many alt-coins proved there is nothing but thin air holding them up - no real demand whatsoever! I'll take a look at some charts today. Now these wicks can be classed as 'anomalies' in technical analysis but in this case i think we've revealed some of the strong tokens now with real backing.
It is expected that with such large wicks we at least test the centre of the wick on one more terrifying shake-out that isnt actually as bad as the one we just has but feels it because traders and investors are been kicked while their down in a state of panic.
-------------
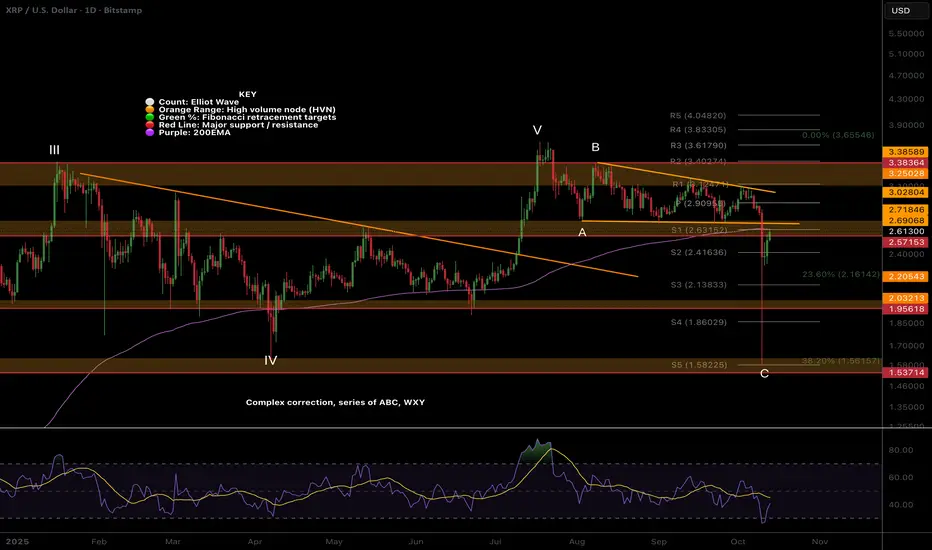
CRYPTOCAP:XRP showed a lot of weakness on that dump hitting the High Volume Node target and macro 0.382 Fibonacci retracement at $1.5, a target i was laughed at for posting a couple of weeks ago! The more 'bullying' that takes place the more I assign probability of hitting that target. Sentiment wins.
Price left a long lower wick which is likely to be revisited as we are now in a bearish structure. The $2 High Volume Node is the likely target. Price is tough quadruple resistance - daily 200EMA, channel lower boundary, High Volume Node and S1 pivot. Lots of supply may come in here.
Wave 2 appears to be complete so once we have one more fearful move down we may accelerate to new all time highs.
RSI hit oversold but with no bullish divergence.
Safe trading
ONDO, Time for wave 3 up into ATH?What a mess Friday turned out to be with a recording breaking liquidation event with the numbers still growing - bigger than FTX!
SUNK COST FALLACY: THE DAMAGE IS DONE, DO NOT PANIC IN AND OUT OF POSITIONS.
So many alt-coins proved there is nothing but thin air holding them up - no real demand whatsoever! I'll take a look at some charts today. Now these wicks can be classed as 'anomalies' in technical analysis but in this case i think we've revealed some of the strong tokens now with real backing.
It is expected that with such large wicks we at least test the centre of the wick on one more terrifying shake-out that isnt actually as bad as the one we just has but feels it because traders and investors are been kicked while their down in a state of panic.
-------------
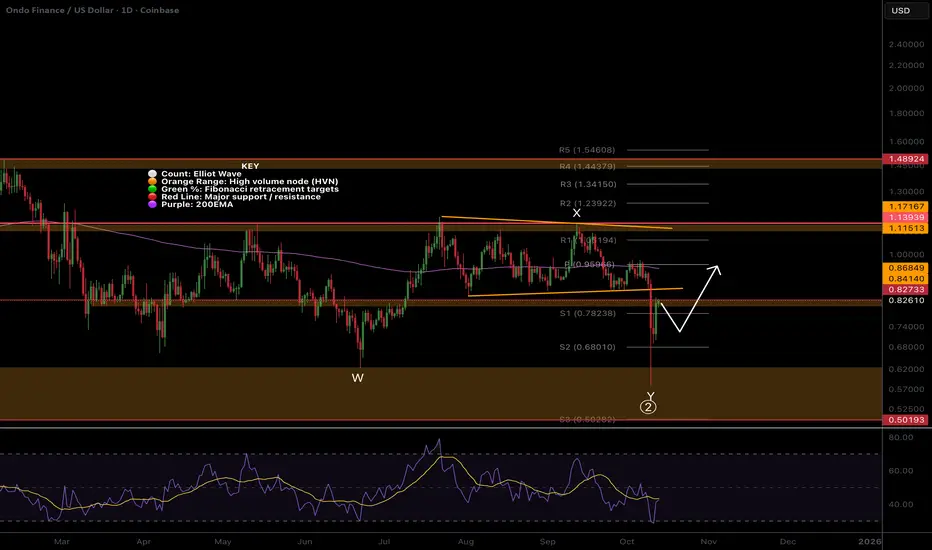
LSE:ONDO appears to have completed a WXY wave 2 complex correction finding strong support in the High Volume Node.
Price is in a bearish market structure at double resistance- High Volume Node, channel lower boundary. Traders should be cautious.
Price is likely to have one more pullback to scare weak hands out before starting wave (3) of 3 to new all time highs. We could see $0.68 challenged at the S2 pivot.
If we break back into the channel the daily 200EMA will be the next resistance.
Safe trading
HBAR, hit the Golden pocket target ive discussed!What a mess Friday turned out to be with a recording breaking liquidation event with the numbers still growing - bigger than FTX!
SUNK COST FALLACY: THE DAMAGE IS DONE, DO NOT PANIC IN AND OUT OF POSITIONS.
So many alt-coins proved there is nothing but thin air holding them up - no real demand whatsoever! I'll take a look at some charts today. Now these wicks can be classed as 'anomalies' in technical analysis but in this case i think we've revealed some of the strong tokens now with real backing.
It is expected that with such large wicks we at least test the centre of the wick on one more terrifying shake-out that isnt actually as bad as the one we just has but feels it because traders and investors are been kicked while their down in a state of panic.
-------------
The WXY wave 2 complex correction has seemingly completed just above the golden pocket mentioned in previous analysis as target for any deep pullback.
But we are now in a bearish structure and we should be cautious. Just ahead lies the quadruple resistance, S1 pivot, 200EMA, major High Volume Node and channel boundary bottom.
Its typical for price to pullback into the wick to smash the fear into weak hands before flying up in a wave 3 to new al time highs. The S3 pivot is the target $0.15 adn I will look out for longs here.
RSI does not have bullish divergence but did bounce from oversold.
Safe trading

ETH is still following my plans pretty preceiselyWhat a mess Friday turned out to be with a recording breaking liquidation event with the numbers still growing - bigger than FTX!
SUNK COST FALLACY: THE DAMAGE IS DONE, DO NOT PANIC IN AND OUT OF POSITIONS.
So many alt-coins proved there is nothing but thin air holding them up - no real demand whatsoever! I'll take a look at some charts today. Now these wicks can be classed as 'anomalies' in technical analysis but in this case i think we've revealed some of the strong tokens now with real backing.
It is expected that with such large wicks we at least test the centre of the wick on one more terrifying shake-out that isn't actually as bad as the one we just has but feels it because traders and investors are been kicked while their down in a state of panic.
-------------
CRYPTOCAP:ETH was looking toppy for a while especially with the 'poke above all time high' Elliot wave 1 rule and i shared my thoughts on downside targets. It is has my secondary target o the drop of the daily 200EMA and bounce hard with bullish divergence in RSI. This is also a shallow retracement of the .382 Fibonacci showing macro strength.
I expect another pullback to test the High Volume Node as support before a strong wave 3 to commence
Safe trading

AAVE local whats next? Total alt-coin leverage wipeout!What a mess Friday turned out to be with a recording breaking liquidation event with the numbers still growing - bigger than FTX!
SUNK COST FALLACY: THE DAMAGE IS DONE, DO NOT PANIC IN AND OUT OF POSITIONS.
So many alt-coins proved there is nothing but thin air holding them up - no real demand whatsoever! I'll take a look at some charts today. Now these wicks can be classed as 'anomalies' in technical analysis but in this case i think we've revealed some of the strong tokens now with real backing.
It is expected that with such large wicks we at least test the centre of the wick on one more terrifying shake-out that isnt actually as bad as the one we just has but feels it because traders and investors are been kicked while their down in a state of panic.
-------------
Price printed a topping wedge, broke down, tested as resistance and dropped. The drop was likely anyway but the extent of systematic failure made it worse.
Aave did not penetrate the lows of the larger range and found support in the High Volume Node all the way back to the 0.5 Fibonacci retracement and is now back testing the daily 200EMA as resistance.
Wave 2 is likely complete. We probably visit the wick on a scary candle to $209 High Volume Node before finding a bottom for a huge wave 3 of 3 move up to new highs! A likely scenario now that we have shaken out all the weak hands.
These events often mark the bottom. Daily divergence is not oversold or has bullish divergence yet. The macro structure is still in tact!
Safe trading

Dont get trapped chasing the Opening gap Bitcoin Hello and Welcome
Here I present to you a quick theory on the Bitcoin CME open in the event we gap down and open in the 112K range.
This idea is just something to consider in the week ahead, with many traders destroyed as a result of Fridays crash and emotions running high going into the week ahead I encourage you to take a listen to this potential scenario for the week ahead on BTC.

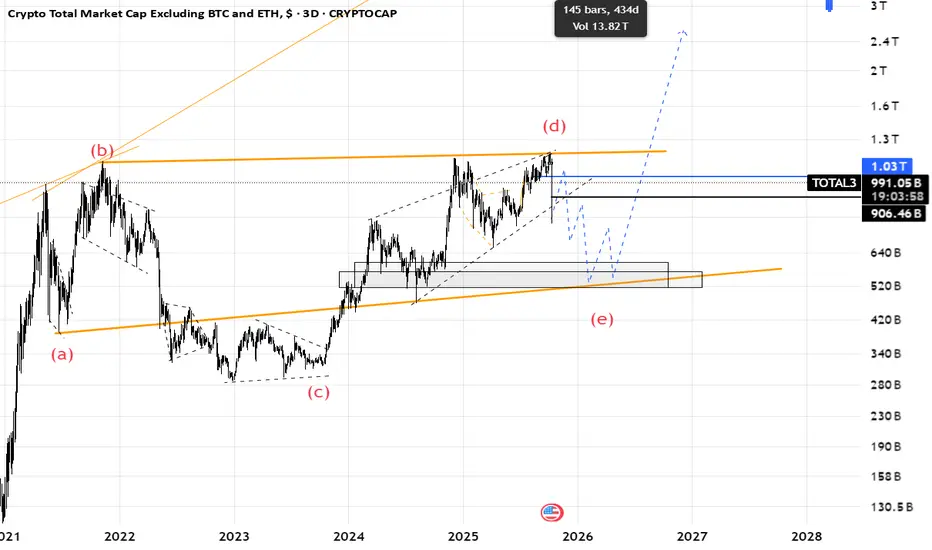
Total3(based on NEo wave)I thought wave (e) is finised but I was wrong.
now I think its the start of wave (e) and we should afraid of altcoins.
when wave (e) is finished altcoins will start to pump.
every upward is a chance to sell.
there is another scenario that I will share it on next post.
SUI Still holding up strong!Price has still not reached the 0.5 Fibonacci retracement and appears to have been front run. Wave (4) is intact but no higher high since then is a cause for short-term concern. A triangle could be forming, or an expanded flat correction! Time will tell…
Price is below the weekly pivot, RSI is negative with room to fall and no bullish divergence forming. Further downside brings up the S1 weekly and major High Volume Node support at $1.4-1.6 range.
Wave (5) has a minimum target of the R4 weekly pivot at $13.1.
Safe trading

HBAR Reversal time?My long-term golden pocket target has finally been reached leaving a long lower wick behind as demand soaked up the drop. Price is likely to retrace into the middle of the wick and find its final support if the move was truly the wave 2 bottom!
If we go lower the ‘alt-coin golden pocket’, 0.786, sits at the major High Volume Node support and would be a great buy as well as a good spot to look out for longs.
Weekly RSI has room to fall but bullish divergence is forming!
Wave 3 has a minimum expected target of $0.65 aligning with targets from the standard deviation bands above. Wave 5 has a minimum target of $0.75
Safe trading

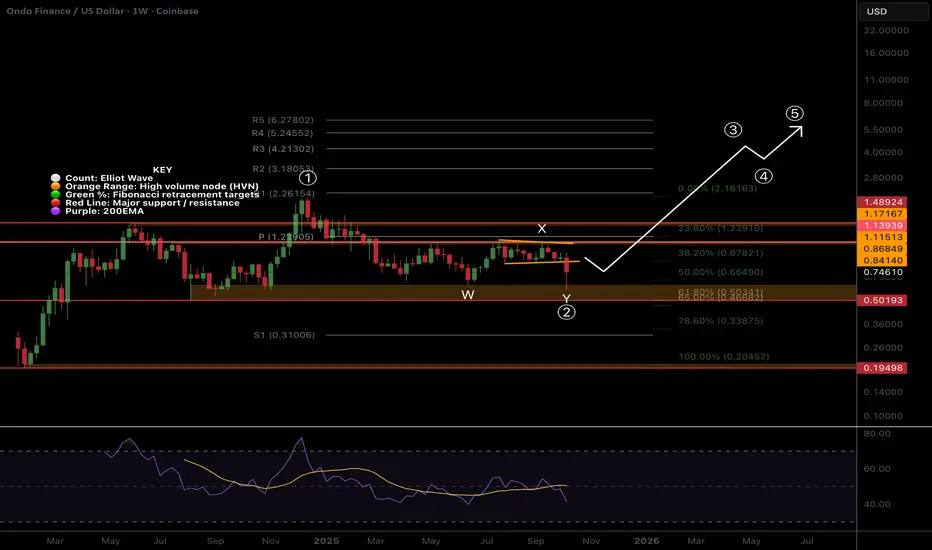
ONDO Extreme opportunity zoneI have been sharing my wave Y of (2) target for a while at the Fibonacci golden pocket and major High Volume Node support, $0.5. Demand soaked up the downward pressure here leaving a long lower wick. The next downside target is the ‘alt-coin’ golden pocket, 0.786, and S1 pivot at $0.31 and would be an excellent buying opportunity!
Weekly RSI has plenty of room to fall with no bullish divergence forming yet.
Wave (3) target is the R3 weekly pivot at $4.2 a decent move from here!
Safe trading
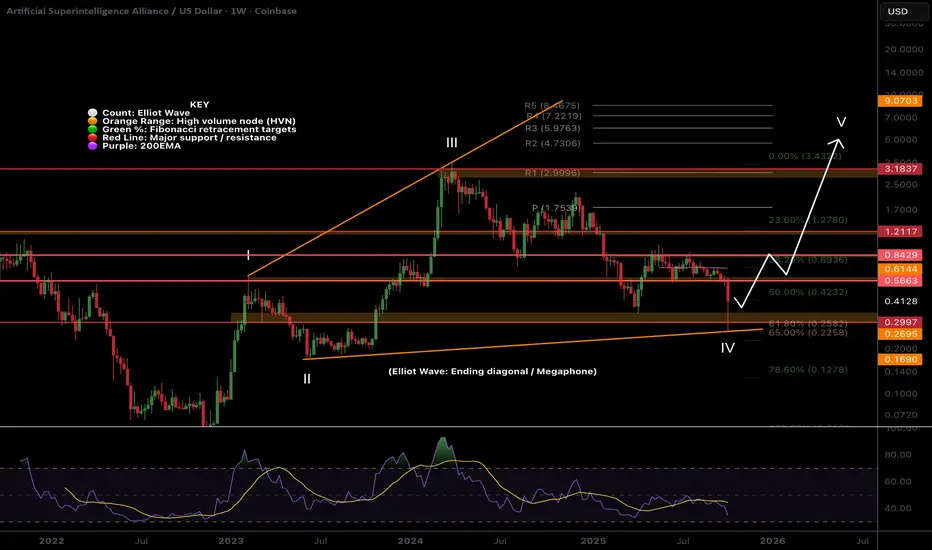
FET extreme opportunity zone!NYSE:FET wave IV megaphone pattern is still in play despite the lower low and is invalidated only if we get blow wave II at $0.1685. This is a complex Elliot wave structure where investors and traders get trapped easily!
Weekly RSI now has bullish divergence forming but is not yet confirmed. Price found support at the major High Volume Node and Fibonacci Golden Pocket, a high probability reversal area!
Wave V has an expected target of the R2 weekly pivot at $4.73 but can over-extend in an exuberant market conditions.
Fetch had one of the largest runs last year offering a 56x from a swing below the SD-3 green opportunity band zone. When an asset moves with such momentum to the SD+3 threshold (where it is expected to spend <1% of the time) momentum is found in the opposite direction and gives way to extreme undervaluation! This is were we strike!
Price has now reached the opportunity green band zone once more quickly catching a bid of 20% as of writing. Price is expected to spend <5% of the time in this zone offering investors a short window of opportunity. It can go lower of course but there is a good chance a bottom is formed in this area! I intend to buy here and I am looking out for longs which give me larger position size than buy and hold due to the nature of the risk management.
Price targets for fair value, where we expect price to return to at least, is currently at $0.60. Another irrational alt-season with backed momentum could see a new all time high towards the $5 range and I will take profits at each band threshold along the way!
#OTHERS.D ~ Do you believe in Castles in the SKY?I believe that the Others dominance metric divided by an ounce of real money #Gold gives us a valuable insight into the fabled altseasons.
Because as this chart shows theres only been 4 in actuality
and you normal get a double bubble in a cycle.
So I believe we are at the cusp of turning things around as most people have given up on the concept of altcoins ever pumping again.
But it was just the business cycle #PMI that has depressed prices for the past few years.

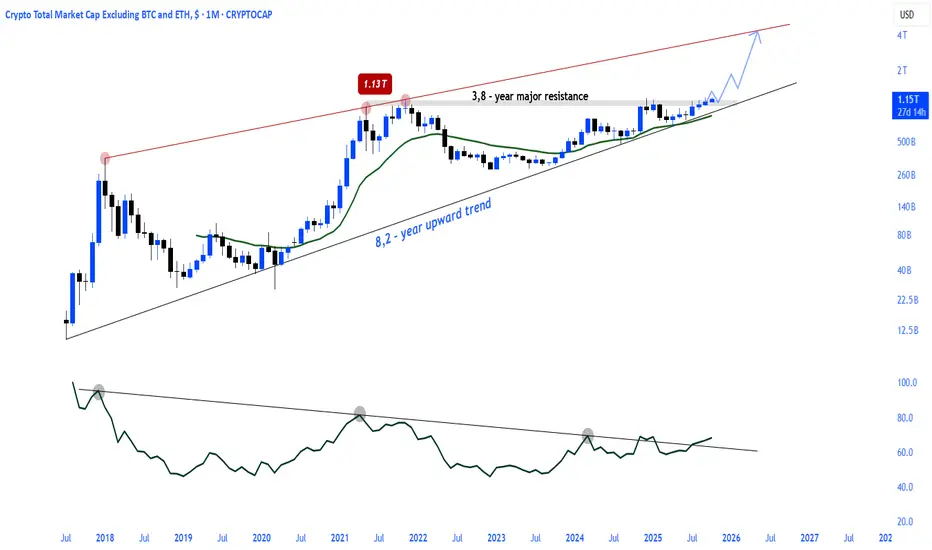
The Altcoins Momentum Period Begins.- Almost 4-year major resistance and breakot
- Major breakout in RSI
- 8,2 -year rising trend
Altseason 🔃💹