Altseason

Solana - Market structure Shift - The Levels to be aware of !In this video I look at the higher time frame and point out some key reasons of why I'm expecting a deeper pullback as well as local time frame where we can see the clear levels to be taken if your looking to accumulate or open longs .
Aside from the Solana coin I look at the Eth/Btc pair and BTC which ultimately determines the fate of the alt coin market .
Any questions please feel free to ask in the comments section below

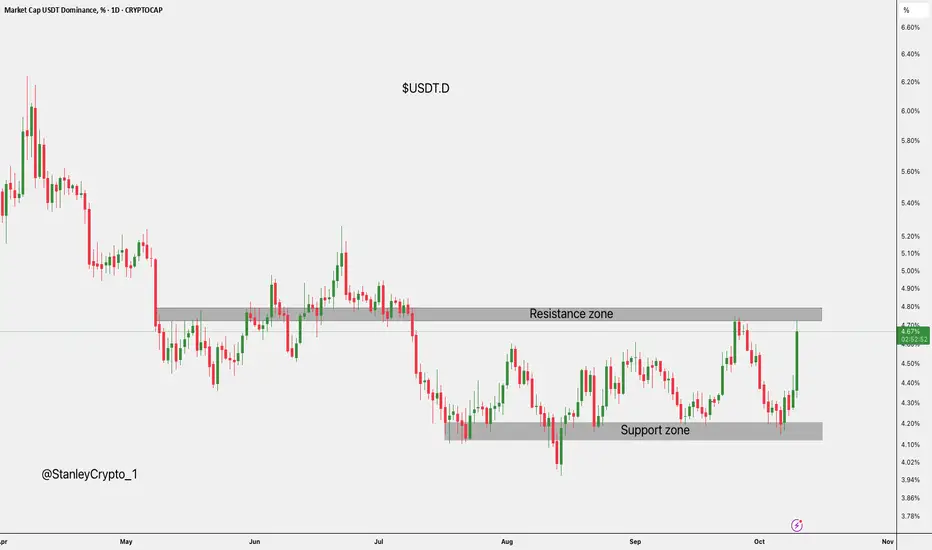
$USDT dominace.CRYPTOCAP:USDT dominance is rising from the 4.1% support zone toward 4.8% resistance, showing strong momentum and potential for further gains if it breaks higher.
DYOR, NFA
$ETH Update !!CRYPTOCAP:ETH Update
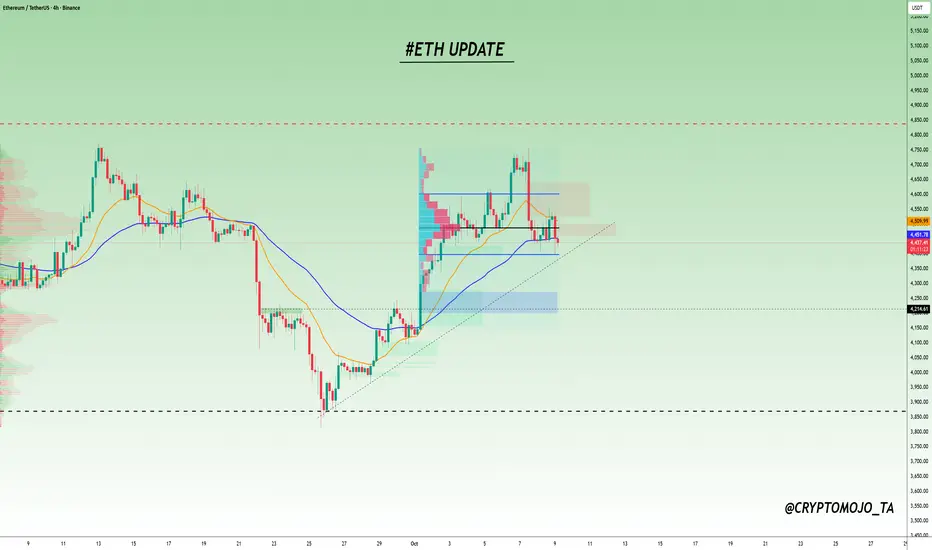
#Ethereum is facing significant resistance between $4,450 and $4,550. After rejecting the recent local highs, it’s currently holding the 55 EMA (green) as short-term support. However, it’s getting squeezed between the 21 EMA (yellow) above and a high-volume node on the Volume Profile, which acts as a heavy liquidity zone.
If ETH fails to reclaim the high-volume node and starts closing below the 55 EMA, we might see further downside towards the $4,200 support area.
ETH has already broken structure to the downside, showing weakness. If price closes below $4,397 (Value Area Low of the current range), we could see a continuation toward the $4,200 bullish FVG zone.
Key Levels to Watch:
Resistance: $4,450–$4,550
Support: $4,250
A break below $4,397 confirms more downside toward $4,200.
CRYPTOCAP:ETH BITSTAMP:ETHUSD BINANCE:ETHUSDT
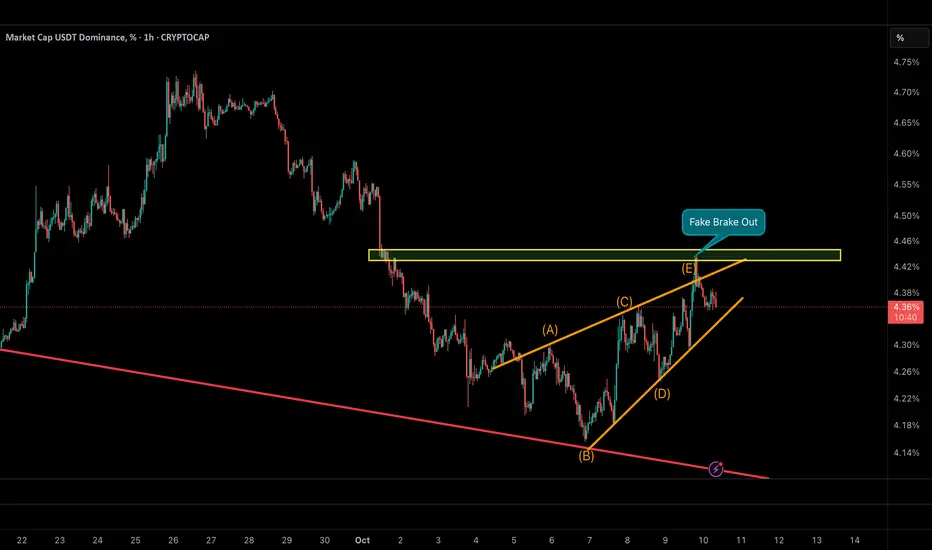
USDT Dominance – Fake Breakout Signals a Potential Altcoin ShiftUSDT Dominance has completed a contracting wedge pattern (A–B–C–D–E), followed by a fake breakout above the key resistance zone near 4.45%.
This move likely trapped late buyers of USDT at liquidity highs.
As long as dominance remains below 4.35%, the probability of a deeper decline toward 4.15–4.20% increases —
which could mark the beginning of capital rotation into altcoins.
In contrast, a confirmed breakout above 4.46% would invalidate this setup and suggest a new sideways phase.
📉 Base Scenario: Continuation of decline toward 4.15–4.20%
🚀 Implication: Growing probability of an upcoming Altseason
EOS — old / A — new. After the rebrand. 10 10 2025Comparative analysis. The old EOS chart history (8 years) and its continuation in the new coin A (Vaulta), after the rebranding.
EOS on exchanges that haven't yet rebranded . On some exchanges (usually low-liquidity ones and DEXs), the old ticker is still trading. They're swaying the price, and the order book is half-empty, so they can sell off the remaining coins on the exchanges. You can exploit this volatility at your own risk, but remember, you could end up holding a coin that's impossible to sell anywhere if EOS isn't exchanged for A, and EOS is delisted, and then, later, A is listed.
A (Vaulta) is trading on exchanges that supported the rebranding and the exchange of the old for the new without any hassle. The chart shows a 3-day timeframe.
Secondary trend. The downtrend, which has formed a channel, is currently dominant.
Local trend. The short targets of the descending triangle, which was broken downwards, are currently being fulfilled.
Currently, there is sideways consolidation at the median of the descending channel, which could become a descending flag if support is broken, opening the way to the lower zone of the channel. Then, a reversal to the upper part of the channel.
If, after consolidation, the price moves up , then the movement towards resistance of the descending channel. A breakout will break the trend, or return to the descending channel according to its logic.
In the medium and long term , it's worth accumulating this Vaulta (working from zones and for a breakthrough), but don't overdo it. It's important to understand that this is a scam project, albeit one with a large marketing slant and the support of contractors from the “money masters” of the USDT issuer and a bunch of liquid exchanges. EOS is the longest-running ICO, and the most lucrative one. “Investors” have buried (let's be honest, they've laundered) billions of dollars in it. Therefore, it's possible, like the already scammed EOS, they'll exploit their brainchild during a "hamster isn't scared" period—a repeat of 2017 and a shot in the arm for a repeat of the scam (not likely).

Just before the Altseason.The big picture is becoming clearer in the TOTAL2 and TOTAL3 charts.
The upward trend that began from the 2022 lows has finally reached the critical resistance/supply zone and is gathering strength in this area.
A breakout from this zone and sustained movement above it will trigger a parabolic expansion wave for altcoins.

Is Altseason About to Begin?The market structure suggests we’re currently in wave C of the second corrective wave (2) — and it looks close to completion.
A potential ending diagonal and bullish divergence on momentum indicators signal exhaustion among sellers.
At the same time, Bitcoin dominance is testing a key resistance zone — a level where liquidity often starts rotating into altcoins.
📈 If the current low holds, we could be witnessing the early stages of wave 3 — the impulsive phase where altcoins usually outperform Bitcoin.
🟢 Base scenario: Correction ending → beginning of a new bullish phase
🔴 Alternative scenario: Breakdown of the current low → completion of a W–X–Y structure

Have Altcoins Hit a Cycle Top?Altcoins have not hit a cycle top as of October 9, 2025. The data and market dynamics suggest altcoins are in a strong mid-cycle phase, with growing momentum and capital rotation from Bitcoin, but not yet at the euphoric distribution phase typical of a cycle peak. Here's why:Market Metrics: The total crypto market cap is $4.23T, with altcoins holding a $1.6T+ share, and the Altcoin Season Index at 55/100 (neutral, trending bullish). Bitcoin dominance is falling below 59%, signaling capital flowing into alts like ETH, SOL, and XRP. This mirrors early altseason patterns seen in 2021, not the broad sell-offs of cycle tops.
Institutional and On-Chain Activity: Altcoin ETFs (e.g., ETH, potential XRP by Oct 25) are driving inflows, with ETH staking at 35M+ and DeFi TVL surging. Solana’s ecosystem is "unstoppable" per X sentiment, with 762% upside in select setups. Mid/small-caps like Aster (targeting $3.61 ATH) and Aptos (+24% weekly) show CMF inflows, not distribution. Whales are accumulating, not dumping.
Historical Context: Cycle tops typically feature extreme retail FOMO, universal ETF outflows, and altcoin prices at unsustainable multiples (e.g., 2021’s DOGE/SHIB mania). Current altcoin rallies—BNB +17%, ZEC +165% weekly—are strong but not parabolic. Past cycles saw alts correct after BTC dominance dropped below 40%; we’re far from that.
Risks and Outlook: Short-term volatility is possible due to resistances (e.g., ETH $4,680) and token unlocks (Celestia/Polkadot). However, Fed rate cuts (Oct 29) and a weakening USD favor risk-on assets like alts. X posts hype SOL, ETH, and presales (e.g., Pluffy), reflecting growing but not peak euphoria.
ConclusionAltcoins are in a bullish rotation phase, not a cycle top. The setup—rising volumes, ETF inflows, and BTC-to-alt capital flow—points to further upside, potentially 100x for select projects in Q4 2025. A true top would require broader distribution (e.g., sustained ETF outflows, retail mania across all alts), which isn’t here yet. Watch for BTC dominance below 50% and sustained altcoin outperformance as stronger altseason confirmation.
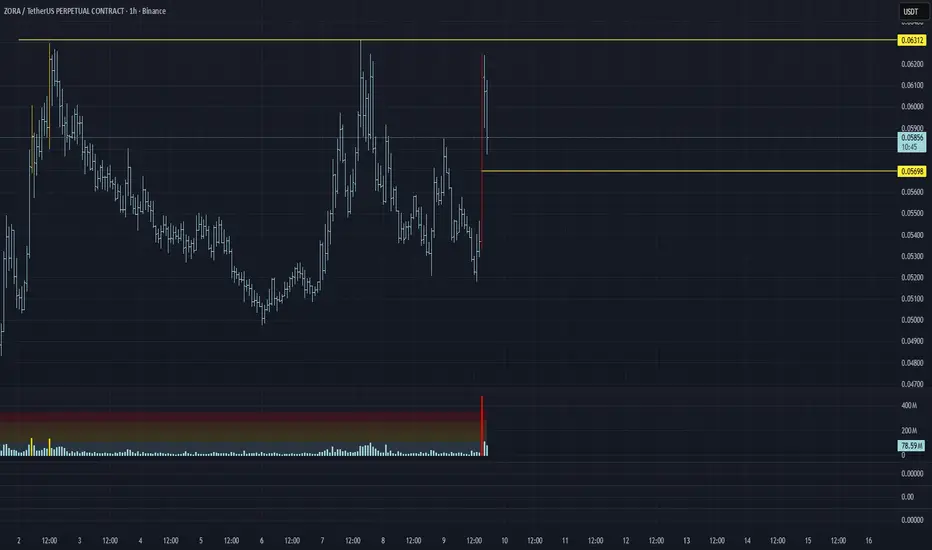
ZORA/USDT Analysis. Long setup
The asset is consolidating near a key level. A strong volume spike and local selling absorption were detected. A breakout is expected, and if the price secures above resistance, the potential target lies near $0.074.
The most conservative entry would be on a retest and reaction from ~$0.057 (bid/ask imbalance).
This publication is not financial advice.
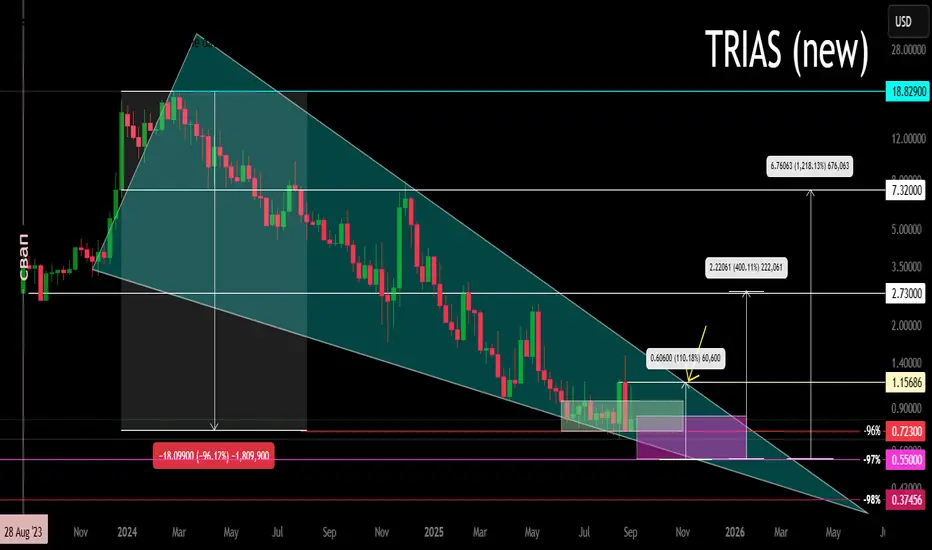
Trias Token (New, after rebranding) Secondary trend. 10 2025Logarithm. 1-week time frame for trend visibility. Relevant for those trading on DEX exchanges, particularly Uniswap or PancakeSwap. A fractal structure is evident when compared to the entire chart history for this project, before and after the swap (find it yourself and compare).
For the new coin after the swap (the chart I provided here), a descending wedge is forming in the secondary trend (the entire history after the coin swap), and a sideways price movement with reduced volatility has begun. In other words, this is a hypothetical accumulation zone. For money management and risk control, I also showed where the price could theoretically fall (optional). Percentages are provided for clarity, from key support and resistance zones to the main areas of previous consolidation.
A breakout of the wedge (its resistance) — the potential for a sideways move with a wider range, or a transition to the participation phase, where all of the percentages shown (up to 7.32, no higher, and above that, you shouldn't care) are highly likely to be reached (the general market hype and the altseason, which no one believes in anymore, but it's inevitable).
The basis for trading such low-liquidity assets is risk control and diversification of similar assets.
1️⃣ For example, from your total deposit, you allocate 5-10% of your funds to trading such high-risk (low liquidity and lack of top centralized exchanges), but potentially highly volatile, due to low capitalization and liquidity, assets.
2️⃣ Select similar assets for trading - observe 20-50. Observe and study what seems most interesting and promising to you.
The most important things to observe are:
➖ This is the potential future traffic of "dumb money." How much new users are pumping Twitter, Telegram, and other social networks. The size of the crypto community. This is essentially the most important thing. How will these people be steered toward buying low-liquidity cryptocurrency during the alt season, which means a large pump.
➖ Buying volume from time to time during consolidations in the lower price zones.
➖ Declines from the high and the market phase and the corresponding phase of the cycle the coin is in. There are high zones and low zones. You should only be interested in the low zones. Anything that has been pumped up should not interest you.
➖ The project's legend , its imitation, and its support in the community. The project creators' activity.
➖ Chart logic and the overall market phase directly influence the altcoin's price. This is key, but people often forget it. A patient and consistent person will be rewarded; a restless person will not.
3️⃣ Of these coins to watch, you select 10-20 to trade and work with them, distributing your funds among key zones. Don't buy with all your allocated funds, but distribute them among key zones and trading situations (breakouts, declines). This is the key difference between a trader and a mere hamster.
Control your risks and stick to your trading plan. Don't get caught up in market and news noise, which shapes opinions and the illogical actions of the majority, which are doomed to lose in the future.
ETH - UPDATE - MASTERCLASSCRYPTOCAP:ETH - 22/09 vs today: Update - MASTERCLASS 🔥
"Still bullish medium/long term, but a further correction is very possible before liftoff!
Bulls need to hold $3780. Below = trouble…Above = game still on for ATH attempts later. 📉"
Insane setup shared if you followed! 3800$ liquidities grab ✅
Prices is up 23%+ from this zone mentionned! 🔥
Are we ready to fly toward 5000$ now??
I'll let you discover on the next analysis Im working on!
Life if you want to see it! 👍

$XPL Trade Idea - Break Out LONG Stablecoin narrative
AMEX:XPL
Long Entries on Breakout of Trendline
Stop below recent lows.
Targets Aiming level by level
$2 soon
For swing spot trade - i think it's to better to have manual stop below $0.6

IAGON has huge potentialIAGON has huge upside potential, it’s a very undervalued DePIN project on Cardano. They have a collaboration with the Würth Group that brings revenue to node operators and stakers, along with two upcoming CEX listings and a pilot with a Fortune 50 company on IAG. Breaking the black line is the trigger for another uptrend , and as you can see, it’s ready to go parabolic, especially if we see an alt season after the Clarity Act passes in 2025.

LISTA - 100% UP!!! 🔥🔥🔥My medium term outlook are game changing for my followers! 🔥🔥🔥
#LISTA - 29/08 vs today🤑
100% UP 💥 = 500+ Like for this one! 👍

BTC - DAILY UPDATE#BITCOIN - Daily update 🟠 (Oct 8, 2025)
Spotted a clean bear div yesterday → pullback into 121k–120k; 118.5k possible.
Daily/weekly still constructive; no clear reversal. 📈
H1: neutral, triangle in play.
🎯Levels
Resistances:
122,800 • 123,300 • 125,000 • 125,900 💥
Supports:
121,000–120,000 • 118,500 • 115,800 🛡
Scenarios:
🟩 H1 break and close above 122,800 → room toward prior ATH.
🟨 Triangle break down or rejection near 123,000 → retest ~119,000 - 199,500 before any attempt higher.
#Alts market : will likely stay green while holds above ~115,500.

$PENGU is consolidating: long opportunityThe market is expected to cool down a bit after the recent CRYPTOCAP:BTC rally — that’s our chance to catch a solid long setup. Check the green box for the entry zone!
Entry in the green box, the lowest possible
🎯 Target: $0.035, $0.038, 0.040
If CRYPTOCAP:BTC corrects to around $120,000, it could drag altcoins lower, giving us a perfect opportunity for a juicy long position.
Always DYOR! 💪 #Crypto #Altcoins #BTC #Trading #TechnicalAnalysis #MarketUpdate #DYOR

Altcoins are heading toward a parabolic phase.Same setup, same chart, different story, different market
Silver laid the foundation for a parabolic run after breaking through a 3.8-year major resistance level.
The altcoin market cap TOTAL3 similarly broke through a 3.8-year major resistance level.
NASDAQ:ALTS \ TVC:SILVER
Altseason 🔃💹

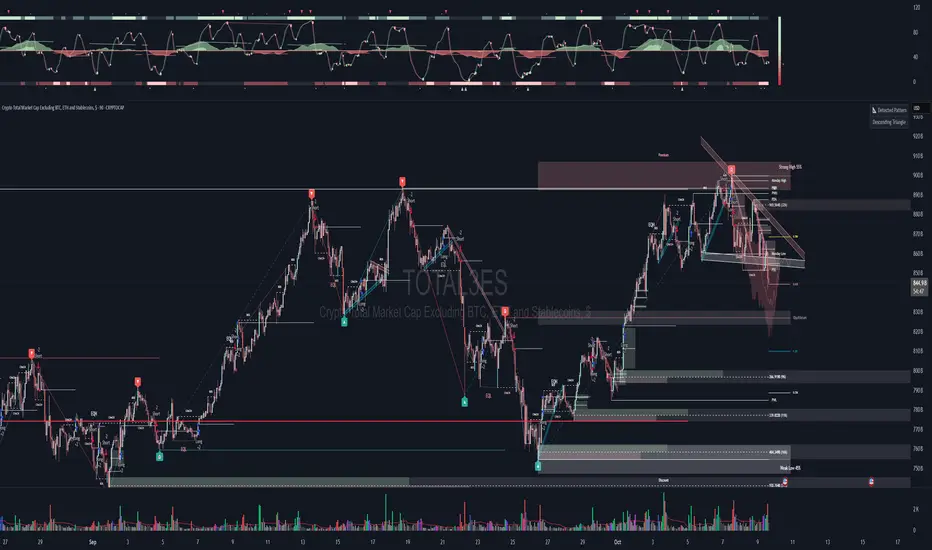
TOTAL MARKET CAP EXCULADING BTC, ETH! TOTAL3 tracks the combined value of all altcoins, excluding BTC and ETH.
The $1.16T level has long acted as a ceiling for alts every rejection there signaled weak capital flow into the broader market.
Now that we've closed above it, it suggests renewed capital rotation into altcoins and rising market confidence.
If TOTAL3 holds above $1.16T, expect continued expansion: stronger trends, more breakouts, and improved liquidity.
If it slips back below, the breakout fails and altcoin momentum fades until buyers return.
In short: above $1.16T = bullish altcoin flow. Below it = risk-off mode.
DYOR, NFA

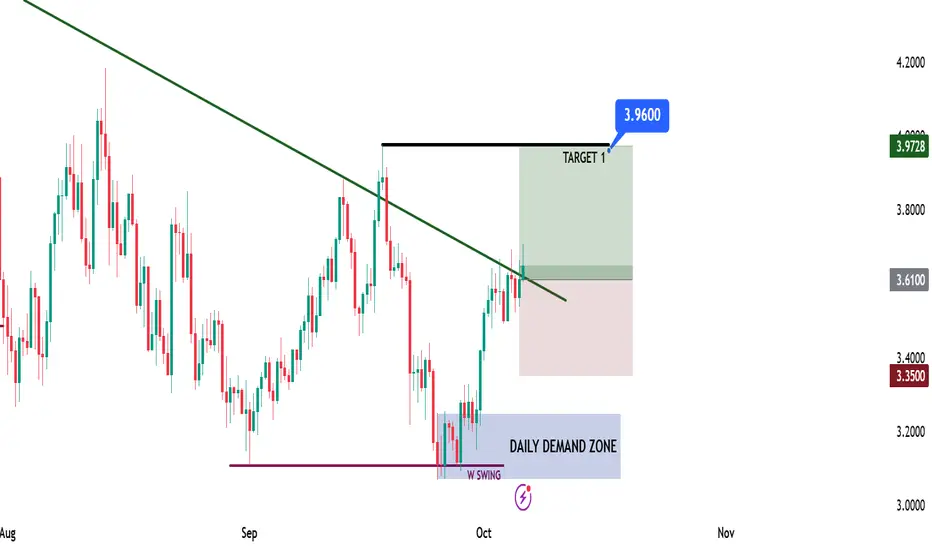
SUI Long Opportunity – DTB ModelSUI Long Opportunity – DTB Model
📊 Market Sentiment
FED has resumed its rate-cutting cycle with a 0.25% cut in September and two more expected. Institutional liquidity inflows are accelerating as the U.S. officially adopts crypto as part of its reserves. Despite persistent inflation, a weakening labor market is forcing the FED to ease, driving capital into risk-on assets like crypto.
📈 Technical Analysis
Price remains in a strong HTF bullish trend, so I’ll only be looking for long setups.
After running HTF swing liquidity, price broke structure and created a daily demand zone. The first tap to this zone generated a solid rejection, confirming its validity.
Recently, price closed above the LTF bearish trendline — signaling potential continuation for the next bullish leg.
📘 Model to be used – Demand Bounce to Trendline Break (DTB Model)
1-Identify the HTF trend and trade only in that direction.
2-Wait for a strong bounce from a confirmed demand zone.
3-Look for a break of the lower time frame bearish trendline.
4-Enter on breakout confirmation after two consecutive body closes.
📌 Game Plan
Position entered after 4H trendline break confirmation (two body closes above). Entry taken around $3.61, aligning with HTF bullish bias and demand confluence.
🎯 Setup Trigger
4H body close confirmation above bearish trendline.
📋 Trade Management
Entry: $3.61
Stoploss: $3.35
Target: $3.96
💬 Like, follow, and comment if this breakdown supports your trading! More setups and insights coming soon — stay connected!
⚠️ Disclaimer: This content is for informational and educational purposes only and does not constitute financial, investment, or trading advice. Always DYOR before making any financial decisions.
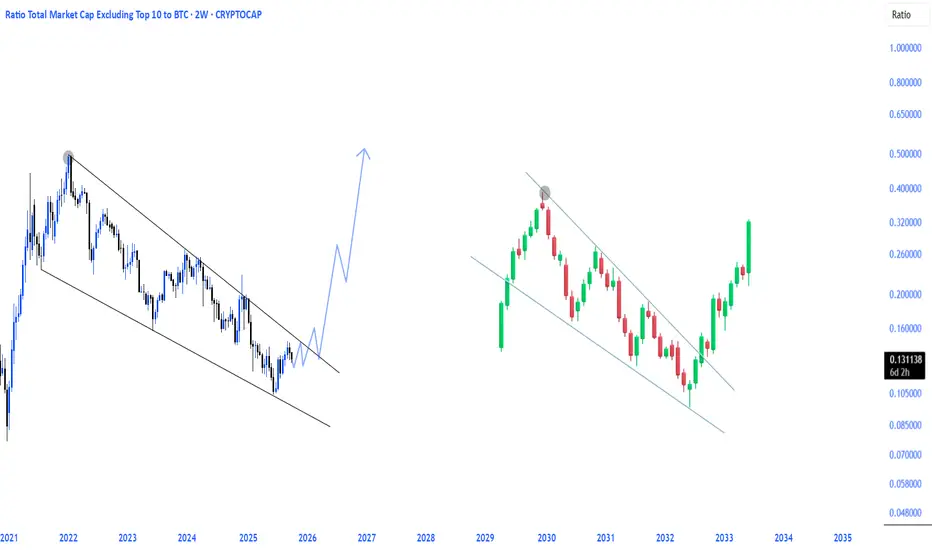
OTHERS BTC We are heading towards an epic process in terms of altcoins.
The Altseason spark will be ignited following the breakout and retest of the descending wedge pattern in the OTHERS / BTC pair.
CRYPTOCAP:OTHERS / CRYPTOCAP:BTC 💹
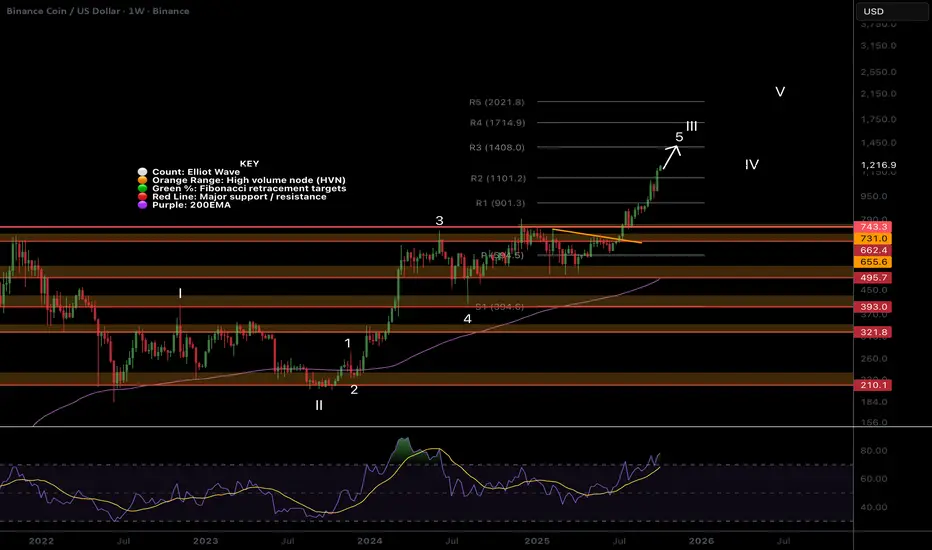
BNB cant be stopped!BNB is on a bullish journey of its own continuing into price discovery in what can only be described as wave 3 behaviour so I have upgraded my count to wave 5 of 3!
R5 pivot targets are $2021
Weekly bearish divergence persist!
Safe trading
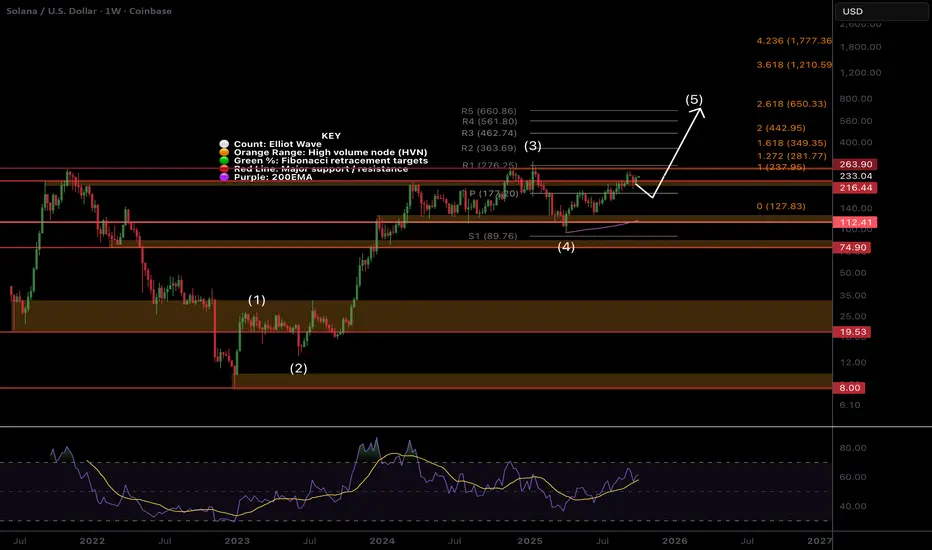
SOL Macro - Time for Price discovery?$SOLWeekly RSI has returned to the EQ giving Solana plenty of space for upside growth! Price is attempting to break into all time high but just can’t find the momentum it needs. This is good thing for now, keeping volatility to a minimum!
Weekly R5 Pivot and Fibonacci extension targets are $660. Price is above the weekly pivot showing the uptrend is in tact and may well test it as support again!
Consolidating under resistance for an extended period often leads to a breakout!
Safe trading