Bitcoin dominance VS. Altcoins run phaseBTC dominance has broken below its major uptrend, and we may see very positive movements in altcoins in the coming period.
Altseason

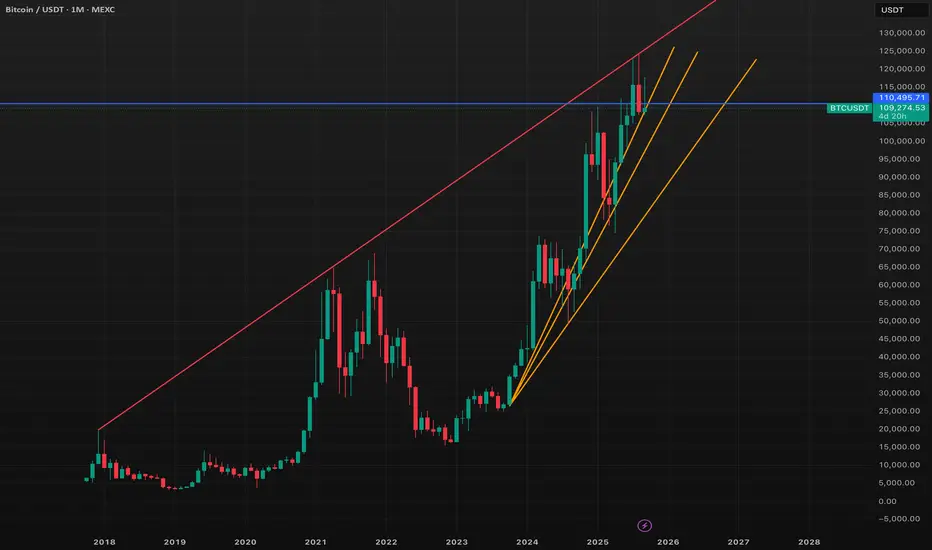
Bitcoin Analysis: Critical Support LevelsBitcoin's current price action presents an interesting technical setup that can be analyzed through the lens of the fan principle. This approach reveals multiple key support levels that deserve attention, particularly the crucial 109-110K zone where Bitcoin currently finds itself.
Understanding the Fan Principle
The fan principle is a technical analysis concept that uses multiple trendlines emanating from a common point, creating successive support and resistance levels. In Bitcoin's case, these fan lines have developed over several years and now present a clear hierarchy of critical price levels that the market must respect or break.
The most immediate and important of these levels sits at 109-110K. This zone represents more than just another support level - it serves as the foundation for Bitcoin's current market structure. How Bitcoin reacts at this level will likely determine the near-term direction and set the tone for what could be a significant move in either direction.
The 8-Year Resistance: Two Rejections and Counting
A critical element in Bitcoin's current technical picture is the 8-year resistance trendline, clearly visible as the red line on the chart. This long-term resistance has proven its significance through price action, having already rejected Bitcoin twice upon contact. These two previous rejections demonstrate the strength and importance of this multi-year technical level.
The pattern of rejection followed by renewed approach is a classic technical setup. Each time Bitcoin has touched this 8-year resistance, it has been turned away, creating a well-defined ceiling that has influenced price action over an extended period. However, repeated tests of resistance levels often lead to eventual breaks, as the selling pressure at these levels can become exhausted over time.
Should Bitcoin manage to hold the current 109-110K support zone and mount another attempt at this 8-year resistance, a successful break would represent a major shift in market structure. Given the two previous rejections, a third attempt that results in a clean break could open the door to new all-time highs, as it would finally eliminate this long-standing technical barrier that has capped Bitcoin's upward movement.
Multiple Scenarios at Play
The fan principle suggests several potential outcomes from the current position. If the 109-110K level holds as support, Bitcoin could use this as a springboard for higher prices, potentially testing and breaking the 8-year resistance. The orange and yellow fan lines extending upward provide potential targets in such a scenario, with projections reaching into 2026 and beyond.
Conversely, a failure to hold the 109-110K zone would shift focus to lower fan support levels. The fan structure provides a roadmap for where Bitcoin might find its next significant support should the current level fail to hold.
Market Structure Considerations
The convergence of multiple technical factors at current levels makes this period particularly noteworthy. The fan principle, combined with the 8-year resistance test, creates a situation where Bitcoin faces both significant support below and meaningful resistance above. This compression often leads to decisive moves in one direction or the other.
The long-term nature of these technical levels also suggests that any major move from here could have lasting implications for Bitcoin's price trajectory. Breaks of multi-year technical levels tend to trigger substantial follow-through in the direction of the break.
Looking Ahead
Bitcoin's position relative to these fan-based support levels and the 8-year resistance creates multiple potential paths forward. The key will be monitoring how price action unfolds around these critical levels, as they provide a technical roadmap for both bullish and bearish scenarios.
The fan principle analysis suggests that maintaining the 109-110K level is crucial for any bullish continuation, while a break of this support could lead to a test of lower fan levels. Meanwhile, any eventual break of the 8-year resistance would represent a significant technical development with potentially far-reaching implications for Bitcoin's long-term trajectory.
As with any technical analysis, these levels provide guidance rather than guarantees, and market participants should monitor price action closely as it unfolds around these critical zones.
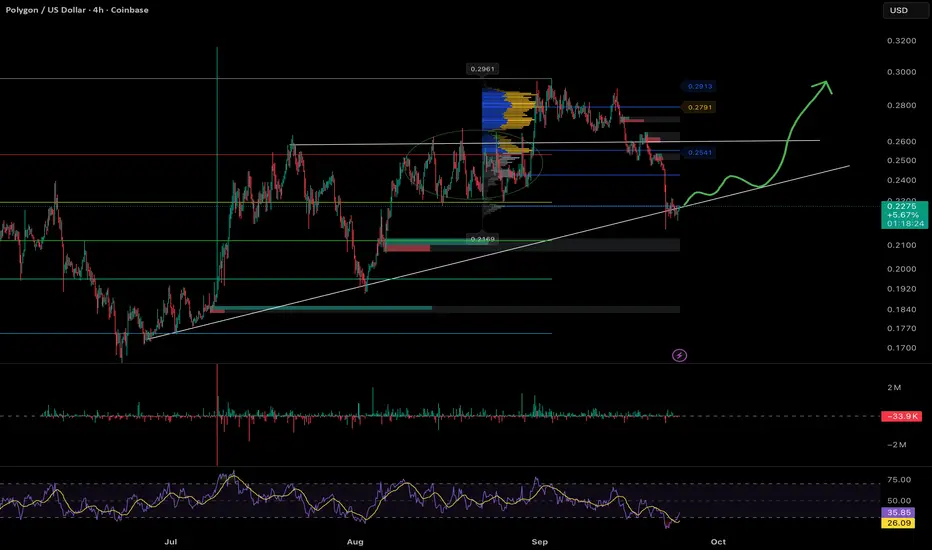
POLUSD Polygon (ex-Matic) Second attempt here following the trendline for now,
SL at 0.1990 if it wicks. And will close below the trendline if theres a clear daily breakdown
TPs : Same as the first try
0.75
1.5
3
6.5
18
cheers
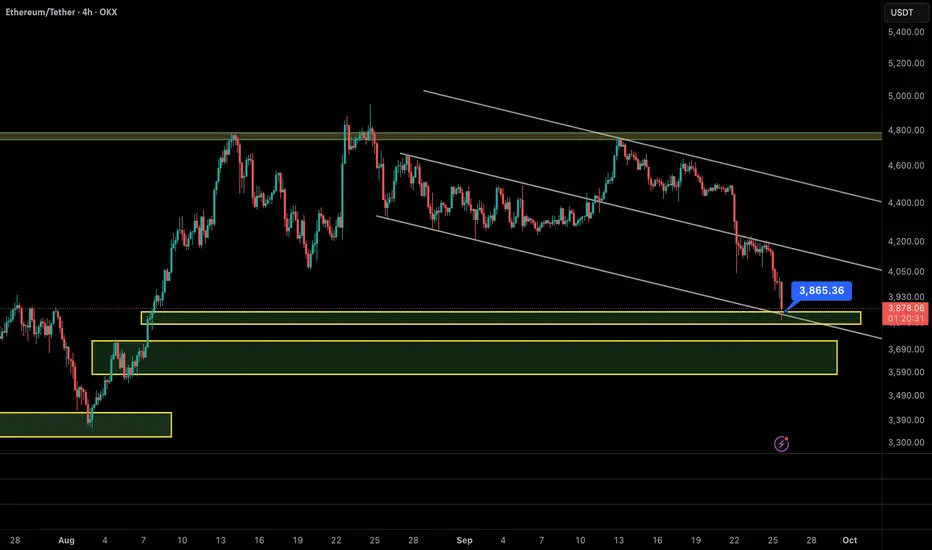
Ethereum (ETH/USDT, 4H) – Bounce Setup After Textbook Drop In my previous analysis, I highlighted the $4,700–$4,800 zone as a critical resistance cluster. ETH was rejected exactly from $4,720 and dropped sharply to $3,850, just as projected. ✅
⸻
🔎 Current Outlook:
• ETH has now reached the lower boundary of its descending channel.
• Price is sitting right on the $3,850 support zone, where buyers are showing early signs of activity.
• Momentum indicators suggest that the downside pressure may be exhausting, increasing the probability of a relief rally.
⸻
📊 Scenarios:
🔸 Bullish Reversal (more likely):
If $3,850 holds, ETH could rebound toward:
• First target: $4,100–$4,200
• Extended target: $4,400
🔸 Bearish Case (alternative):
A clean breakdown below $3,850 would expose the next demand zone at $3,600–$3,700.
⸻
📌 Conclusion:
After a sharp and accurate rejection from $4,720, Ethereum is now testing strong support at $3,850. Given the confluence of channel support and demand, the odds favor a bounce scenario over continued downside.
Ethereum $ETH similar price action to late JuneIt's not perfect look to see CRYPTOCAP:ETH losing the daily range
However, the current PA oddly reminds me of one from late June
RSI and AO are similar as well
The next few days will be interesting to see if they are trying to scare the paper hands before the generation run, or the generational run is getting postponed for now

AVAX Weekly Resistance Ahead📊 CRYPTO:AVAXUSD has been climbing steadily off the April low, but it's now approaching a critical resistance zone: the 2024 downtrend channel between $40–$44. This area has historically capped rallies and could trigger a strong reaction.
This is a decision zone: momentum vs. structure.
#ElliottWave #Altcoins #CryptoSetup #Avalanche

ETHFI/USDT Analysis – Long Setup
On ETHFI we have a trend break. Below the current price we have several support zones, and we expect buying activity to resume upon testing these levels, targeting a move back to $1.70.
Buy Zones:
• ~$1.555 (initiative volume)
• $1.50–$1.46 (volume zone)
• $1.42–$1.37 (volume zone)
We are waiting for a test of these zones and will consider long positions if a strong reaction occurs.
⚠️ This publication is not financial advice.

SHIB Swing Long Idea - MemecoinSHIB Swing Long Idea
📊 Market Sentiment
Market sentiment remains strongly bullish as the FED is expected to deliver a 0.25% rate cut, with speculation building for a possible 0.5% cut in September. Monetary policy shifts are being driven by both inflation trends and weakening labor market data. The latest August and September job reports were soft, signaling that the economy is cooling rapidly. This environment continues to fuel expectations for a major bullish run in the weeks ahead.
📈 Technical Analysis
Price ran the HTF liquidity and got rejection from there.
Price created the Daily Demand after the run which confirms the price wants to seek higher liquidity.
Price made its first retest to Daily Demand and got rejection there, indicating that Daily Demand is valid and likely to send price higher.
Price is also supported by the Weekly Demand zone.
📌 Game Plan
1. Price to come back and retest the Weekly Demand zone at 0.0125$
2. Price to come back and retest the Daily Demand zone at 0.0117$
3. Price to run Equal Lows (purple line – 0.0117$) and close back above
4. Price to hit the 0.75 most discounted range level
🎯 Setup Trigger
I will be looking for a 4H break of structure before entering any position.
📋 Trade Management
Stoploss: Below the 4H swing low responsible for BOS
Targets:
• TP1: 0.0149$
• TP2: 0.016$
• TP3: 0.0175$
💬 Like, follow, and comment if you find this setup valuable!
⚠️ Disclaimer: This content is for informational and educational purposes only and does not constitute financial, investment, or trading advice. Always do your own research before making any financial decisions.

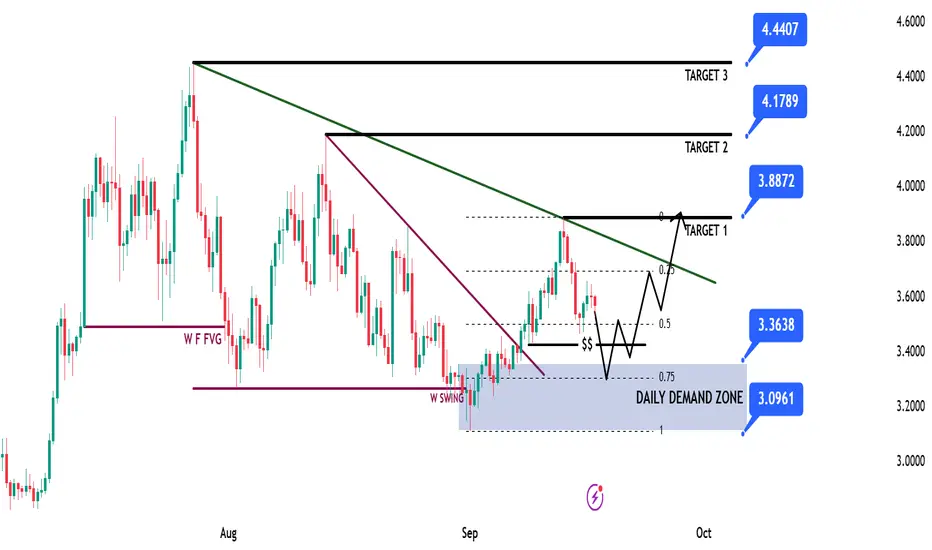
SUI Game Plan - Suinetwork📊 Market Sentiment
Market sentiment remains strongly bullish as the FED is expected to deliver a 0.25% rate cut, with speculation building for a possible 0.5% cut in September. Monetary policy shifts are being driven by both inflation trends and weakening labor market data. The latest August and September job reports were soft, signaling that the economy is cooling rapidly. This environment continues to fuel expectations for a major bullish run in the weeks ahead.
📈 Technical Analysis
Price is on HTF bullish trend so we will be looking only long setups.
Price ran HTF liquidity and closed above then broke the market on daily-weekly timeframe, creating the Daily Demand Zone.
Moreover, price broke the bearish trendline and closed above, giving strong upward momentum. Now price is retracing back into the Daily Demand Zone.
📌 Game Plan
1-Price to hit back to Daily Demand Zone
2-Price to hit possibly 0.75 max discount range zone. If not, I’ll still enter with LTF confirmation.
🎯 Setup Trigger
4H break of structure after hitting 3.36$ level. I won’t enter unless I see the 4H BOS.
📋 Trade Management
Stoploss: Below 4H swing low responsible for BOS
Targets:
TP1: 3.88$
TP2: 4.17$
TP3: 4.44$
💬 Like, follow, and comment if you find this setup valuable!
⚠️ Disclaimer: This content is for informational and educational purposes only and does not constitute financial, investment, or trading advice. Always DYOR before making any financial decisions.
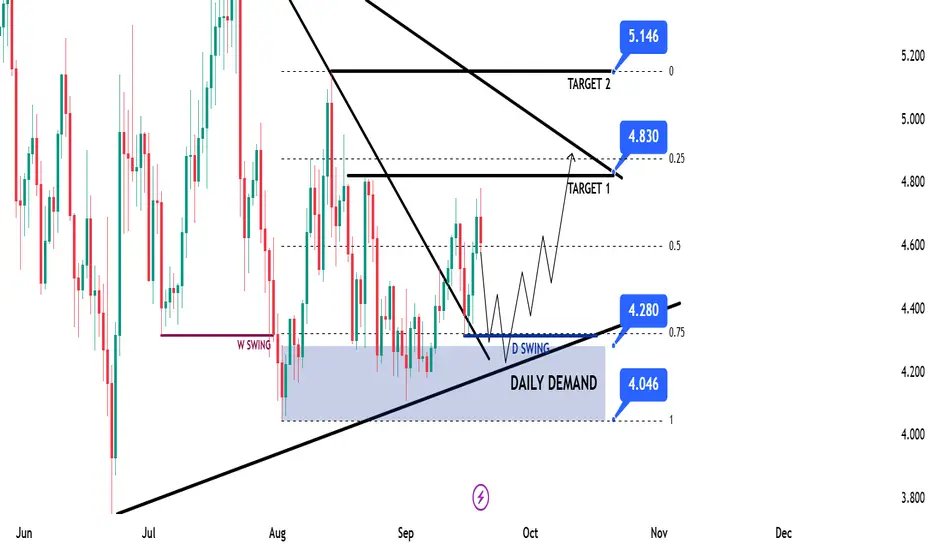
APT Swing Long IdeaAPT Swing Long Idea
📊 Market Sentiment
FED has resumed its rate-cutting cycle, starting with a 0.25% cut in September, with two more 0.25% cuts expected in the coming months. Additionally, institutional liquidity inflows have accelerated as the U.S. officially adopts crypto as part of its reserves. While inflation remains elevated, the weakening labor market is forcing the FED to ease, driving more capital into risk-on assets.
📈 Technical Analysis
Price ran HTF liquidity and got rejected, creating a strong Daily Demand Zone.
This zone is further supported by the HTF bullish trendline, so I will only look for longs as long as the HTF bullish structure holds.
📌 Game Plan
1-Price to revisit and reprice the Daily Demand Zone at $4.28
2-Price to run and close above $4.30 daily swing liquidity (engineered liquidity for expansion higher)
3-Price to reprice into the 0.75 max discount of the range
4-Possible retest of the HTF bullish trendline
🎯 Setup Trigger
I’ll be looking for a 12H break of structure before entering long.
📋 Trade Management
Stoploss: 12H swing low that breaks the market
Targets:
• TP1: $4.83
• TP2: $5.14
💬 Like, follow, and comment if you find this setup valuable!
⚠️ Disclaimer: This content is for informational and educational purposes only and does not constitute financial, investment, or trading advice. Always DYOR before making any financial decisions.
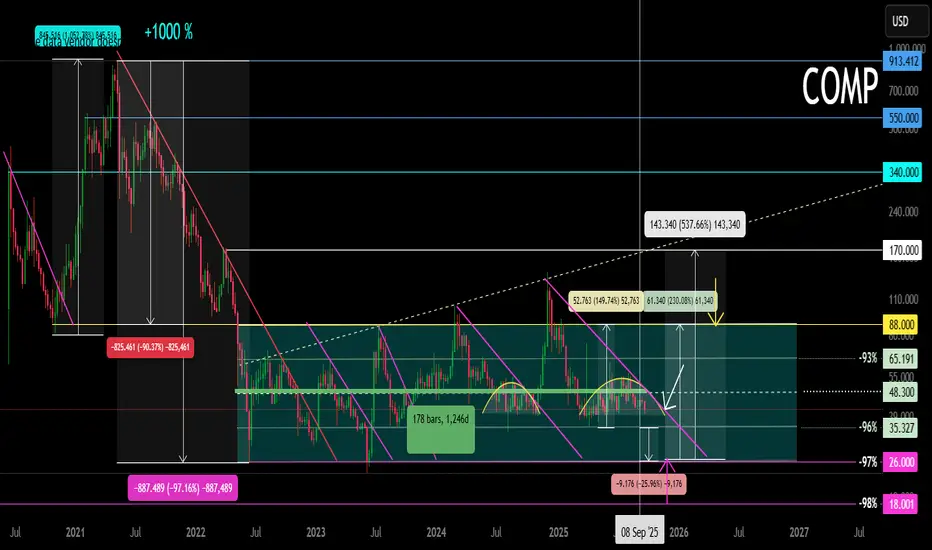
COMP Main trend. 09/24/2025Logarithm. Time frame: 1 week.
Declines from the pump high +1000% to -97%
A horizontal channel has formed, with rising highs (outer boundaries). The inner channel range is -93-96%.
Typical trading in horizontal channels (from zones or on breakouts) and upon exiting them, while adhering to money management.
Buy fear in pieces, sell joy in pieces.
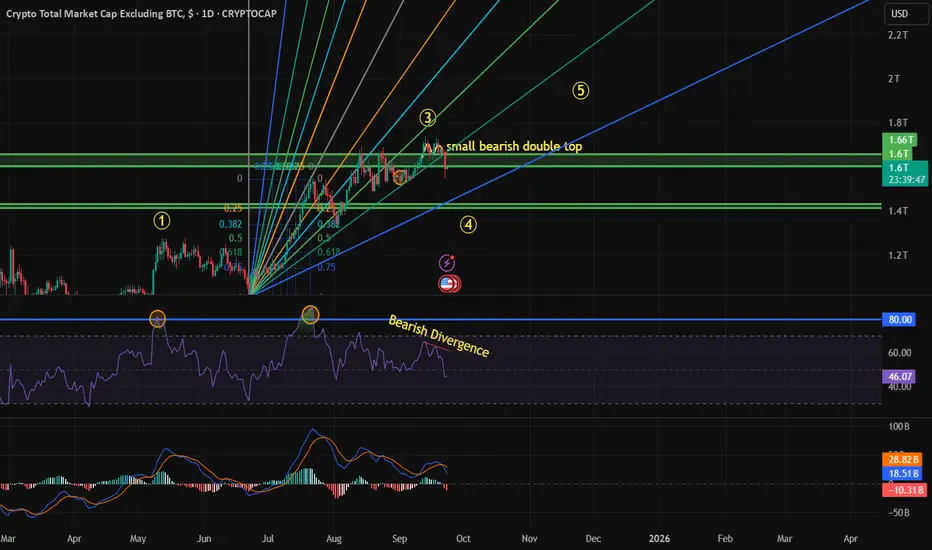
Altcoin Market Correction Underway – Final wave is coming!The total crypto market cap excluding BTC has likely completed Wave 3. At the end of Wave 3, a small bearish double top appeared, and the RSI confirmed weakness with a bearish divergence. During Wave 1, the RSI crossed 80. During Wave 3 going up, the RSI crossed 80 again and reached 86, which indicated that the uptrend would continue. However, at the peak of Wave 3, the divergence suggests exhaustion.
On the Fibonacci speed resistance band, drawn from the end of Wave 2, the price already broke below the 0.618 level. At the same time, BTC dominance broke its downtrend line and increased by more than 1 percent and breaking 0.618 fib resistance, showing capital rotation back to Bitcoin.
All these signals point to the start of Correction wave, the nearest strong support is the 1.42-1.43 trillion (speculative to reach those levels) bulls could push higher before reaching those, BTC correction wave is still ongoing aswell

TOTAL #ALTS market cap structure looks bearish. TOTAL #ALTS market cap structure looks bearish.
🚨Are we about to enter a corrective phase and see a few red days?
Breakdown or bounce, what’s your bias?

SUILocal Analysis / Targets / Elliot Wave
Sui attempted to breakout into all time high and was rejected as expected for a wave (1). Wave (2) is underway with an expected first target of the High Volume Node and S1 daily pivot at $2.9, also the 0.382 Fibonacci retracement. Price must get through the daily 200EMA first. Secondary targets is the golden pocket and High Volume Node support at $2.3.
RSI is just below the EQ and crossed bearishly.
Standard Deviation Band Analysis
Price is below the fair value regression line and another thrust lower will see it reach the green opportunity buy zone where it has tested the threshold twice a support. Price was rejected twice when also attempting to breakout above fair value showing supply ready to drop.
Safe trading

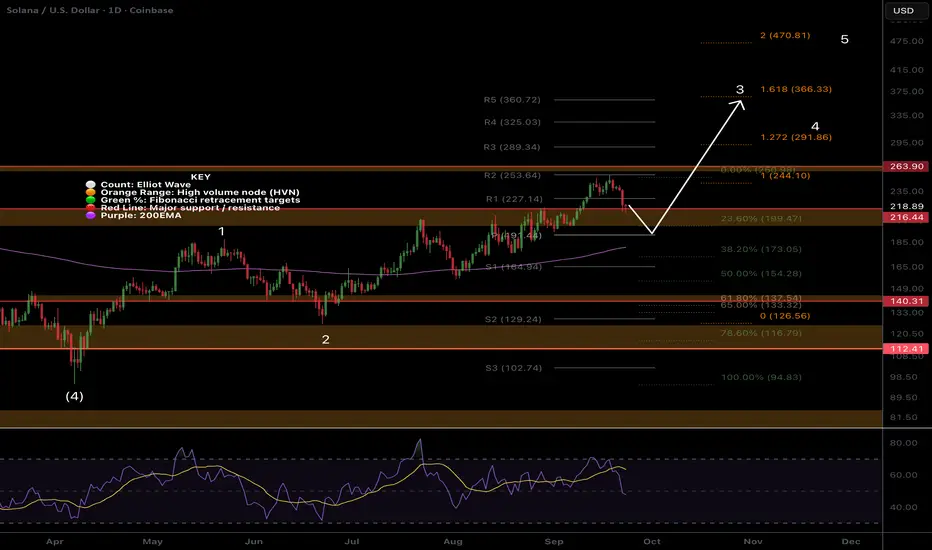
SOL Rejected at all time high! Whats next?Local Analysis / Targets / Elliot Wave
Solana attempted to break into price discovery but was rejected harshly back to the High Volume Node support trapping new traders and investors with the all time high excitement. Wave 3 appears to be underway with a minimum target of $365 the 1.618 Fibonacci extension and R5 daily pivot. Wave 3 pull backs should be shallow.
Continued downside bring up the ascending daily 200EMA and 0.382 target of $173. RSI is at the EQ and crossed bearishly.
Standard Deviation Band Analysis
Solana continues in the expected range just above fair value. Its attempts to break through the SD+2 threshold continue to thwarted but the next attempt will be number 4, the higher probability breakout!
Safe trading
ONDO Flat Correction Near Completion?Local Analysis / Targets / Elliot Wave
Ondo appears to be in a flat correction defined by the pattern and depth of the interior Fibonacci’s. Wave X appears complete and Y is underway, often a strong sell off phase as we can see here. Price would only be expected to whip below wave W to complete wave 2 before heading to new highs in wave 3. This also tests the High Volume Node as support and golden pocket.
The first wave 3 target is $1.5 High Volume Node resistance and R4 daily pivot. RSI has plenty of room to fall.
Standard Deviation Band Analysis
Price is riding the fair value regression line but remains just below after several tests as resistance. Continued downside would put Ondo in the green opportunity buy zone which most often presents great returns and price only stays there <5% of the time.
Safe trading

ETH Correction Finally Underway!Local Analysis / Targets / Elliot Wave
I have been banging the drum about a deeper ETH pullback for a weeks and it appears to be finally underway with bearish market structure confirmed with the lower low from yesterday. Online sentiment, mainstream media attention, silly price targets from analysts, discussions of the ‘the flippening’ returned and Trumps son bragging on X were all major warning signs of a local top. The ETH validator exit queue is record breaking causing a delay of 40+ days if you want to un-stake your ETH. Wrapped Ethereum like stETH may be a good option if you really want out fast! Weather this supply hits the markets is still up in the air.
Price is in the High Volume Node support and below the daily pivot. This isn’t likely to break immediately but after a few attempts to weaken it first (4? lol). The first target for the end of the correction is the same as a few weeks ago - the S1 pivot, rising daily 200EMA and 0.382 Fibonacci retracement at $3500, followed by the S2 pivot, High Volume Node support and 0.786 ‘alt-coin golden pocket’ at $2700. This could present a great buy opportunity.
RSI is making its way to oversold which is a good sign when in a range.
Standard Deviation Band Analysis
Standard deviation bands tell a different story with price still only testing the fair value regression line as resistance after presenting a fantastic buy opportunity from the green zone earlier this year. Price rides this line most of the time as you can see by looking left. A significant breakout above would see the SD+2 threshold target around $7000, a blow off top could reach $10,000 at the SD+3 threshold.
Safe trading

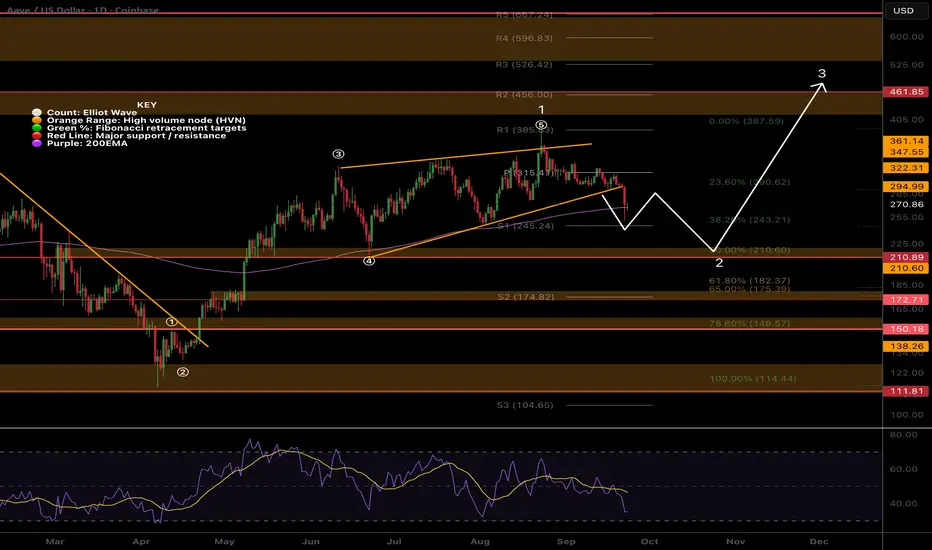
AAVE Breakdown from wave 5 wedge. Whats next?Local Analysis / Targets / Elliot Wave
CRYPTOCAP:AAVE broke down out of the wave (5) of 1 wedge per my previous analysis reaching the paths first target to find support the daily 200EMA and S1 pivot point. If price continues lower I expect it to bounce first before delivering a final thrust down in wave C of 2.
The major support High Volume Node, $210, is the target at the 0.5 Fibonacci retracement. Further breakdown brings up the golden pocket and S2 pivot, $175, and the alt-coin ‘golden pocket’ sits at $149 the 0.786 Fibonacci retracement. This is the most common area for alt-coin pull backs to terminate and a characteristic area for low volume, highly volatile assets in general due to the psychology as I discuss on my Fibonacci tutorial on YouTube.
RSI is making its way down into oversold but has plenty of room to fall with no bullish divergence yet.
Standard Deviation Band Analysis
Standard deviation bands are non-normally distributed unlike the renko chart shared in yesterdays report when time is removed. Price continues to spend way to much time at extremes with fast movement through the fait value zone. Bands are shifting significantly positive as time goes on due to price spending so much time in th eupper boundaries. This is a good sign of strength, dips remain shallow showing strong demand.
Price is testing the SD+2 threshold as support now and losing this would bring up the next target of the fair value regression line at $150 which adds confluence to the alt-coin ‘golden pocket’ targets in the technical analysis.
Safe trading
Dogecoin DOGE – Extreme Buying Zone in Play🚀 CRYPTO:DOGEUSD has pulled back into the equal legs area at $0.23–$0.22, right inside the uptrend channel from June, and is now forming a higher low, a classic setup for a bullish reaction.
If momentum kicks in here, this could mark the beginning of the next impulsive leg, with potential to break above $0.30.
Eyes on the meme king this zone could be the launchpad.
#ElliottWave #MemeCoins #ALTSEASON

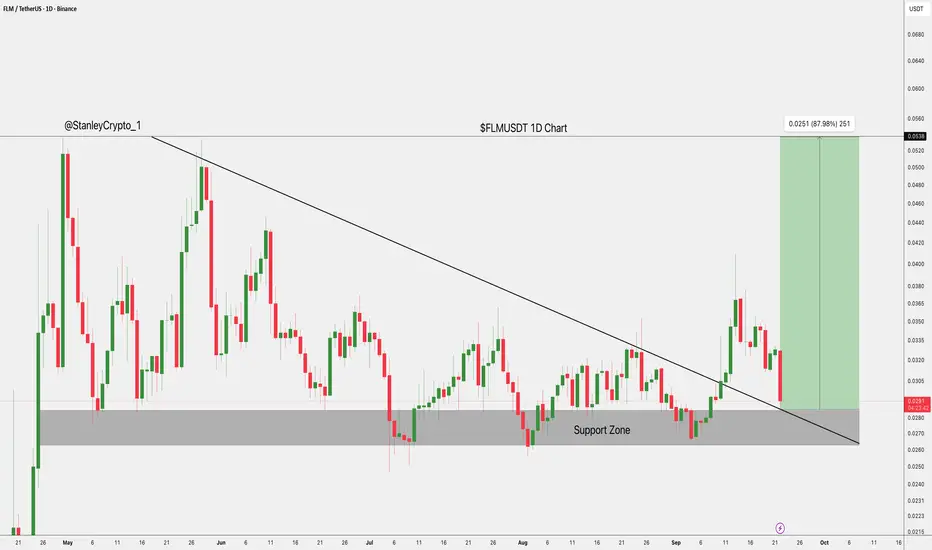
$FLM at Key Support.CSE:FLM is retesting a key support zone around 0.0285, 0.0296.
If buyers hold this level, the price could rebound toward 0.0537 for an 87% move.
A break below support, though, risks further downside.
DYOR, NFA
HOLDING MY THENA [THE / USDT] position! Holding my TSX:THE position 📈
Bulls will be back soon!
Remember; Key demand zone:
0.4700 - 0.440 - 0.4300$
Bullish retest daily & price discovery valid if we hold above!
Price could fly much higher HTF. 🚀

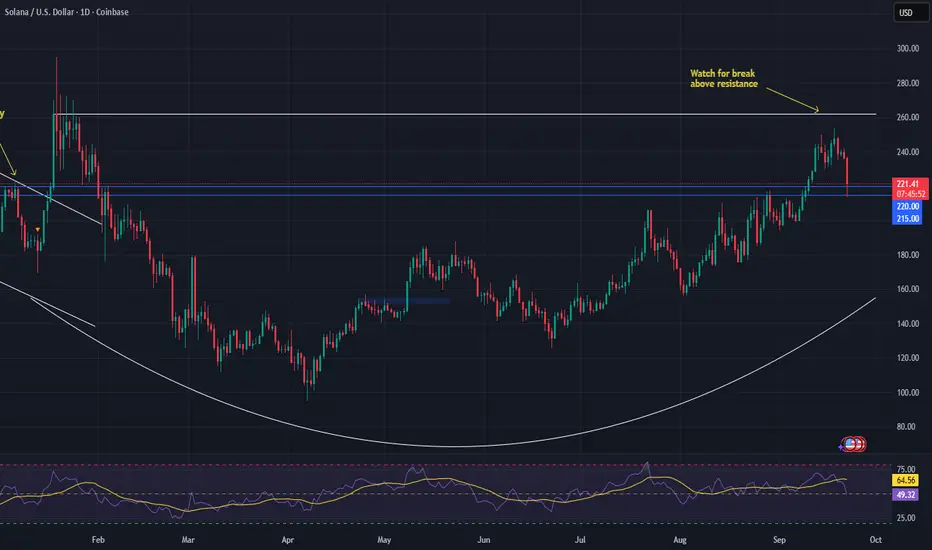
SOLANA (SOL) – Major Breakout Setup BrewingSolana is showing one of the cleanest technical setups in the DeFi space right now. The daily chart reveals a textbook saucer formation, a pattern that often precedes strong upside moves.
🔍 Key Levels to Watch:
• Support: $215–$220 – This zone must hold to keep the bullish structure intact.
• Breakout Zone: $250–$260 – A close above this range confirms the saucer breakout.
• Target: $480–$500 – Based on the pattern’s depth and duration.
The path of least resistance is up, and with altcoin sentiment turning bullish again, this could be a precursor to alt season.
📈 Monitoring closely for a confirmed breakout.
#Solana #SOL #Altcoins #CryptoTrading #DeFi #ChartPatterns #TechnicalAnalysis #CryptoSetup #Altseason