GOAT - TP4 HIT!! My lines are so accurate - 🔥🚀
#GOAT TP4 hit ✅
If prices consolidate above 0.10200$ (previous range resistance), then I expect to see another 10-15% bull move! 📈
Altseason

altcoins seasonAltseason cycle 3 programmed.
The altcoins season is the inevitable outcome of market dynamics.

ETH/USDT: Bullish Rise to 4770?As the previous analysis worked exactly as predicted, BINANCE:ETHUSDT is gearing up for a bullish move on the 4-hour chart , with an entry zone between 4350-4395 near a key support and trendline.
The target range of 4735-4770 aligns with the next resistance, signaling strong upside potential. Set a stop loss on a close below 4228 to manage risk effectively. Watch BTC trends! 💡
📝 Trade Plan:
✅ Entry Zone: 4350 – 4395 (support + trendline area)
❌ Stop Loss: Daily close below 4228 to manage risk
🎯 Target Zone: 4735 – 4770 (next resistance level)
Ready for this lift-off? Drop your take below! 👇

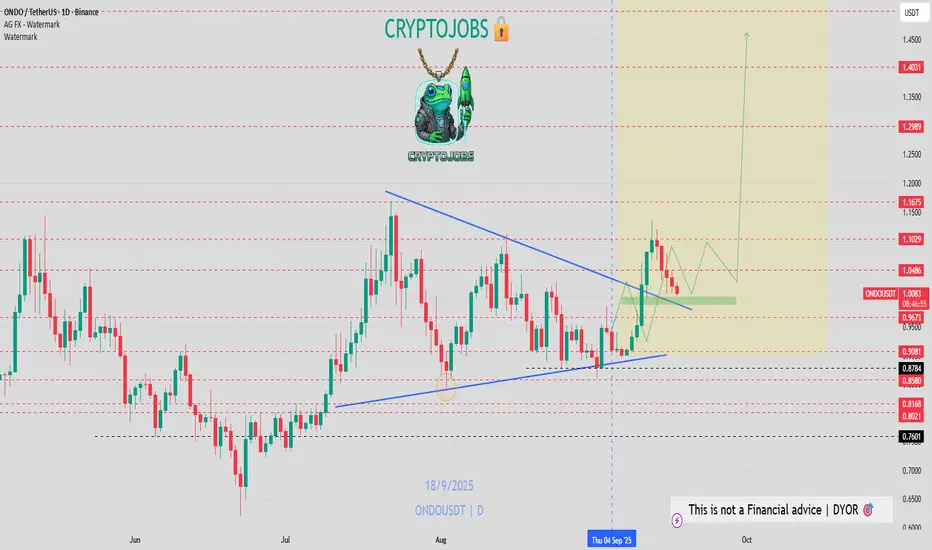
ONDO - BULLISH RETEST? Remember my view on LSE:ONDO
Are we at the 50% fib & key retest before the moonshot? 🚀
Or are bears strong enough to push lower?
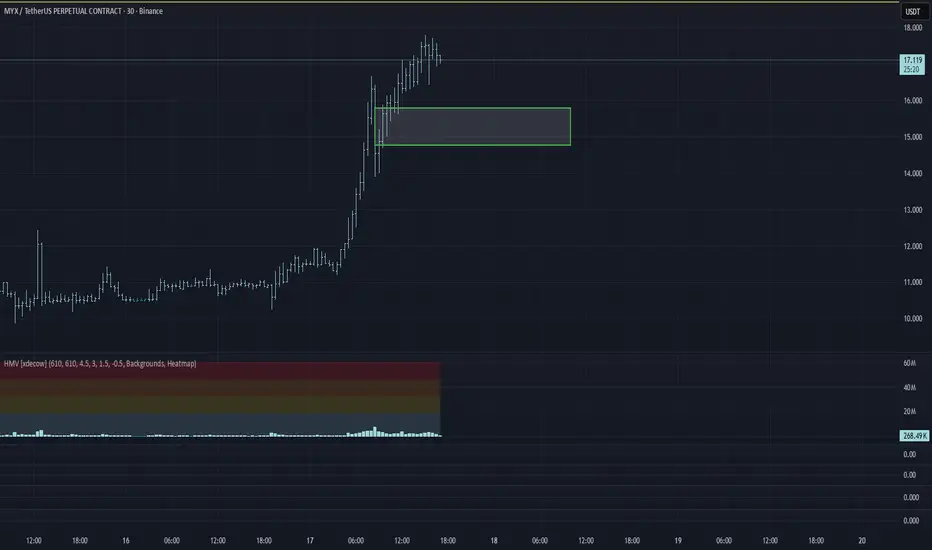
MYX/USDT Analysis. Long Setup
MYX continues to show strong daily momentum. The current high is near, and a strong support zone has formed at $15.8–$14.8.
If this zone is tested and shows a bullish reaction, we can look for a long setup targeting the current high at $18.7.
This publication is not financial advice.
ETH Awaits Fed Decision, High Volatility AheadCRYPTOCAP:ETH Update
Back on August 21, when news broke about a possible Fed rate cut on September 17, ETH instantly jumped nearly 14%. Fast forward to today, the actual announcement is scheduled for 2 PM ET, and the market is on edge.
There’s a strong probability of a rate cut, which could inject fresh momentum and push ETH higher. But if the Fed keeps rates unchanged, we could see a sharp downside correction as risk assets react.
Best approach right now? Stay patient. Wait for the full announcement from Powell, his tone will matter as much as the numbers. Extreme volatility is expected around that time, so caution is key.
DYOR, NFA
#PEACE

ADA/USDT: Bullish Rise to 0.96?BINANCE:ADAUSDT is gearing up for a bullish move on the 4-hour chart , with an entry zone between 0.87-0.85 near a key support and trendline.
The target at 0.96 aligns with the next resistance, signaling strong upside potential. Set a stop loss on a close below 0.8450 to manage risk effectively.
🌟Entry is suitable even right now with proper risk management.
📝 Trade Plan:
✅ Entry Zone: 0.85 – 0.87 (support + trendline area)
❌ Stop Loss: Daily close below 0.8450 to manage risk
🎯 Target: 0.96 (next resistance)
Ready for this lift-off? Drop your take below! 👇

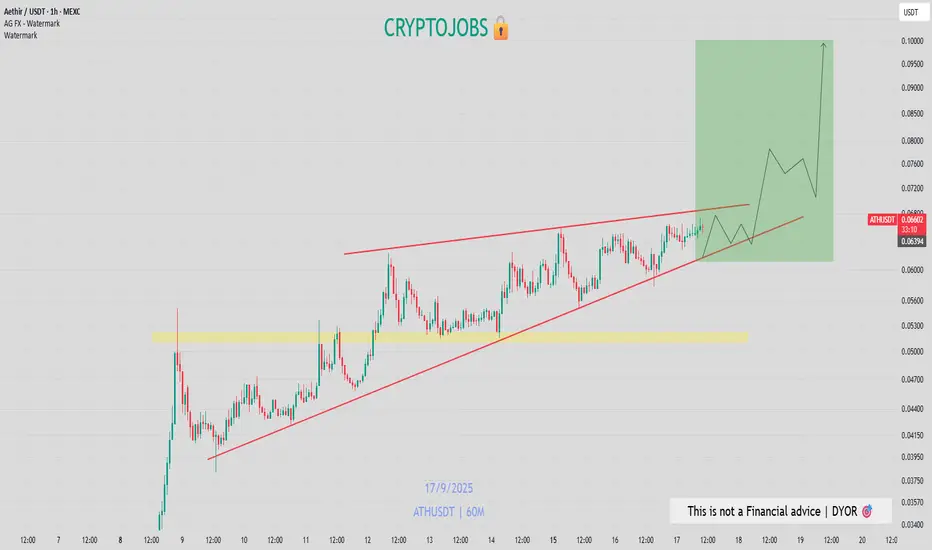
ATH - ASCENDING ACCUMULATIONTSX:ATH - ascending accumulation as mentionned yesterday! 🚀
Another explosif move is probably gonna be see!
We're up already + 7% on SPOT ✅🔥
XLM/USDT: Bullish Move to 0.47?BINANCE:XLMUSDT is setting up for a bullish move on the 1-hour chart , with an entry zone around 0.38 near a key support level as observed in the provided chart.
The target range of 0.46-0.47 aligns with the next resistance, offering strong upside potential. Set a stop loss on a close below 0.35 to manage risk effectively. 🌟
A break above 0.39 with solid volume could trigger this rise, driven by market momentum and XLM network activity. Watch BTC trends! 💡
📝 Trade Plan:
✅ Entry Zone: Around 0.38 (support area)
❌ Stop Loss: Daily close below 0.35 to manage risk
🎯 Target Zone: 0.46 – 0.47 (next resistance)
Ready for this push? Drop your take below! 👇

PENGU Upside Targets🎯As long as September low is holding the Pudgy Penguins COINBASE:PENGUUSD is expected to resume the rally higher toward $0.051 - $0.058.

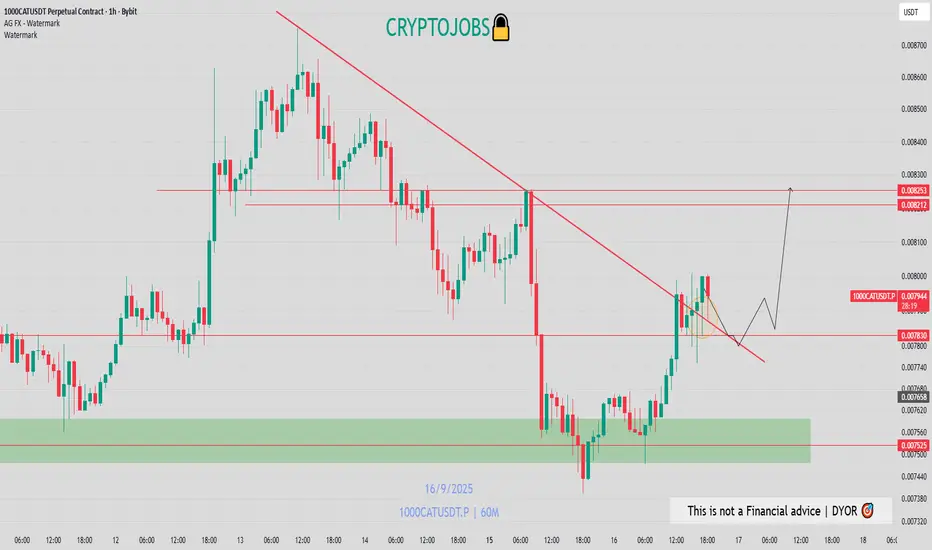
1000CAT- bullish setup$1000cat looks bullish here 📈
I think price could visit again the 0.008150 - 0.008200$ zone next .
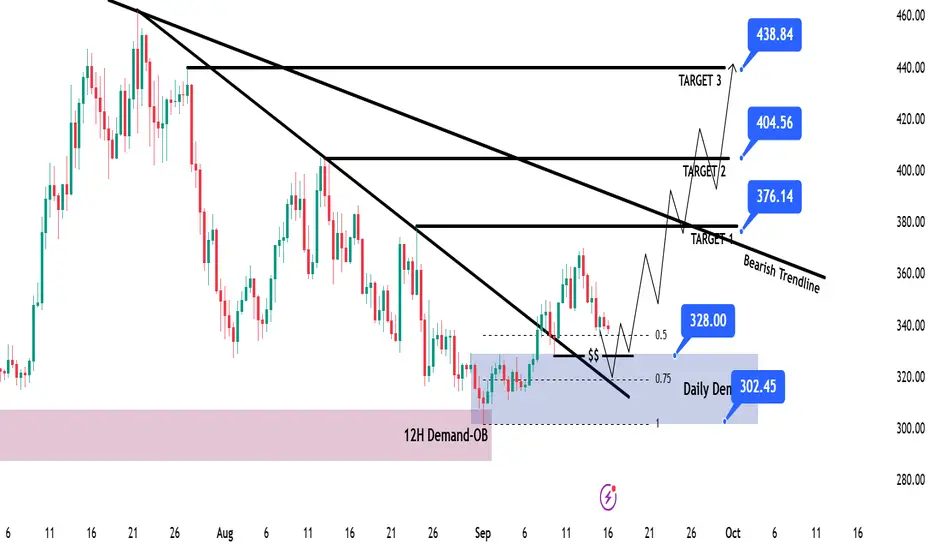
TAO – Bittensor Swing Long IdeaTAO – Bittensor Swing Long Idea
📊 Market Sentiment
Market sentiment remains strongly bullish as the FED is expected to deliver a 0.25% rate cut, with speculation building for a possible 0.5% cut in September. Monetary policy shifts are being driven by both inflation trends and weakening labor market data. The latest August and September job reports were soft, signaling that the economy is cooling rapidly. This environment continues to fuel expectations for a major bullish run in the weeks ahead.
📈 Technical Analysis
• Price rejected the 12H Demand zone and then broke the Daily Structure.
• Price also broke the bearish trendline and closed above, signaling higher targets ahead.
• Current retracement is gathering liquidity to expand higher.
📌 Game Plan
1-Price to hit Daily Demand
2-Price to run liquidity at $328
3-Possible retest of the broken trendline
🎯 Setup Trigger
Looking for a 4H Break of Structure before entering any long position.
📋 Trade Management
Stoploss: Daily close below the Daily Demand zone at $302
Targets:
• TP1: $376
• TP2: $404
• TP3: $438
💬 Like, follow, and comment if you find this setup valuable!
⚠️ Disclaimer: This content is for informational and educational purposes only and does not constitute financial, investment, or trading advice. Always DYOR before making any financial decisions.
+30% GIVEN ON A SILVER PLATTER!!🔥🔥🔥 Another + 30% given on a silver platter! 🔥🔥🔥
$F morning setup was insanely accurate!

HIFI - BULL REVERSAL INCOMING ?? Im buying some #HIFI here, bottom could be in! 📈
I expect to see a bull reaction soon, on the weekly ichimoku support!
Multi week trend retest also around the corner...
Price manipulation was insane, but no risk, no reward!
#DYOR if you follow!

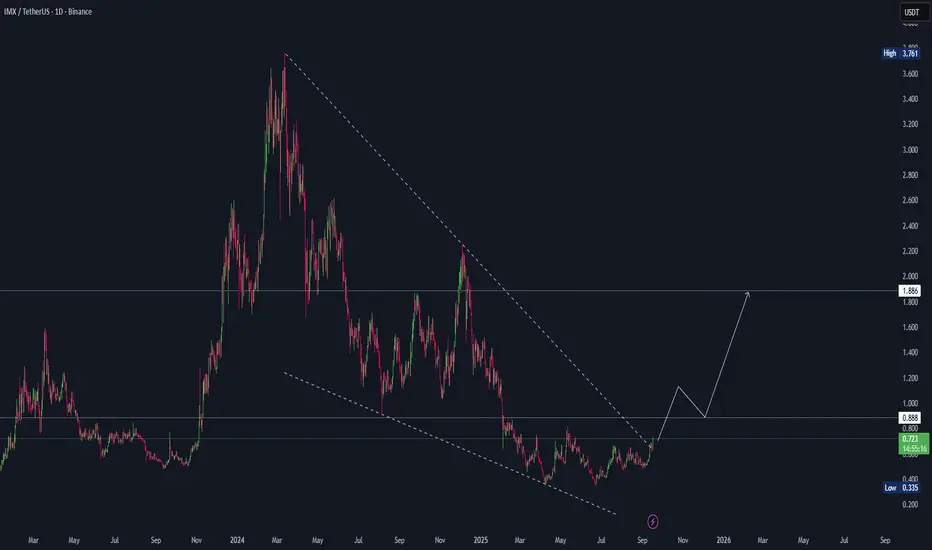
IMX/USDT – Structural Breakout Setting the Stage for a ReversalOverview
Immutable (IMX) has been trading in a prolonged downtrend since its 2024 peak near $3.76, carving out a descending channel with consistent lower highs and lower lows. Recently, however, the price action shows early signs of a potential structural shift. With momentum building and volume confirming interest, IMX could be entering the early stages of a major trend reversal.
Technical Structure
Falling Wedge Breakout: Price has been respecting a falling wedge formation for over a year. The latest breakout attempt above the upper trendline is a strong bullish technical signal.
Accumulation Base: The zone around $0.60–$0.70 acted as a significant accumulation area. Multiple retests suggest strong hands are absorbing supply here.
Key Levels in Play:
Immediate resistance: $0.88
Mid-term target: $1.20–$1.25 (structural retest zone)
Major upside objective: $1.88, which aligns with prior horizontal supply and wedge resistance flip.
Invalidation: A breakdown below $0.55 would invalidate the bullish structure and suggest continuation of the broader downtrend.
Outlook & Strategy
Institutional flows often enter during wedge breakouts, where risk/reward skews favorably. If IMX sustains momentum above $0.88, the path toward $1.20 opens quickly, with a measured move target pointing to $1.88 in the medium term.
Traders should monitor pullbacks into the $0.70–$0.75 zone as potential accumulation opportunities. Any retest of broken wedge resistance turning into support would strengthen the bullish thesis.
Conclusion
IMX is at an inflection point. After an extended corrective cycle, the technical structure suggests the potential start of a new bullish phase. With clear invalidation levels and defined upside targets, IMX/USDT presents a setup worth monitoring closely for trend reversal confirmation.

LINK - BULLISH Im buying some CRYPTOCAP:LINK here on this green zone 📈
Weekly uptrend & daily retest; price might start to tank again! 📈
Remember my medium term outlook: 29.50 - 30.00$ = magnet resistance weekly.
Lower key demand zone: 22.30 - 21.50 - 20.60 - 19.00$

CHR / USDT - Almost Ready! Morning fellas,
Taking a risk here. Obv its ur money, do with it as you wish, as this aint financial advice, but its hella looking good!
Trade thirsty, my friends!

BNB WEEKLYHello friends🙌
🔊We are here with BNB analysis:
A long-term analysis that can be viewed as an investment, but in the long term, with patience and capital management...
You can see that after weeks of price suffering, a good upward move has now been formed by buyers, which has also caused a new ceiling to be set. Considering the market decline and the decline of most currencies, you can see that BNB is well supported and its price has suffered.
⚠Now, with the arrival of buyers, you can enter a long-term buy trade with capital management.
🔥Follow us for more signals🔥
*Trade safely with us*

DOGECOIN : Should we expect an increase?Hello friends🙌
📈Given the decline we had, you can see that buyers entered at the specified support and formed a double bottom reversal pattern, which is a strong signal on support.
📉Considering the possible market correction, we placed two more buy levels lower so that we can buy there if the price corrects.
⚠Don't forget about capital and risk management, friends.
🔥Follow us for more signals🔥
*Trade safely with us*

Memecoin is risky but profitable...Hello friends🙌
Given the channel's failure on the weekly time frame, there is now a good opportunity to buy in the price reversal or price correction, of course, with capital and risk management.
🔥Follow us for more signals🔥
*Trade safely with us*

VELVET : RISKY BUSINESSHello friends🙌
✅According to the movement logs that this currency has formed, it shows the high purchasing power of buyers and we can also buy in stages during price corrections with risk and capital management and move with it to the specified goals.
🔥Follow us for more signals🔥
*Trade safely with us*

CUDIS - BOTTOM IS IN? Idk about this token, but it looks like bottom & retest could be in on #CUDIS 📈
If yellow box hold, then we could see a 20%+ move 📈
Big volatility, stay cautious with leverages.
