ETHEREUM is about to EXPLODEEthereum is doing similar thing it did in April 2025 :
- Falling channel
- Breaking resistance
- Rise again
Altseason
Critical USDT.D Test: Altcoin Relief or More Pain?USDT dominance is pushing into its long-term trendline resistance again. If this level rejects, it usually signals fresh money rotating back into altcoins.
But if USDT.D breaks out and holds above the trendline, it could put pressure on alts and slow down their momentum.
This is a key spot for the altcoin market.
DYOR, NFA
Please hit the like button if you like it, and share your views in the comments section.

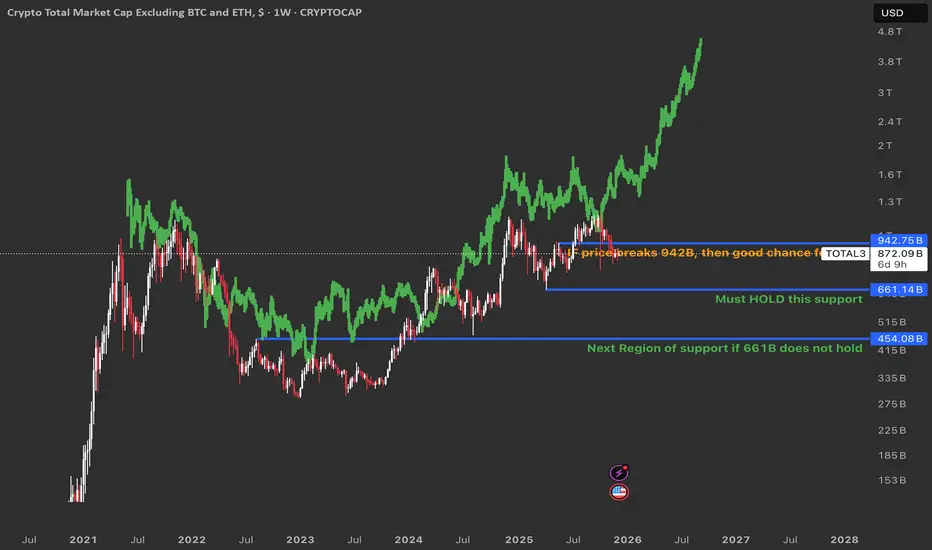
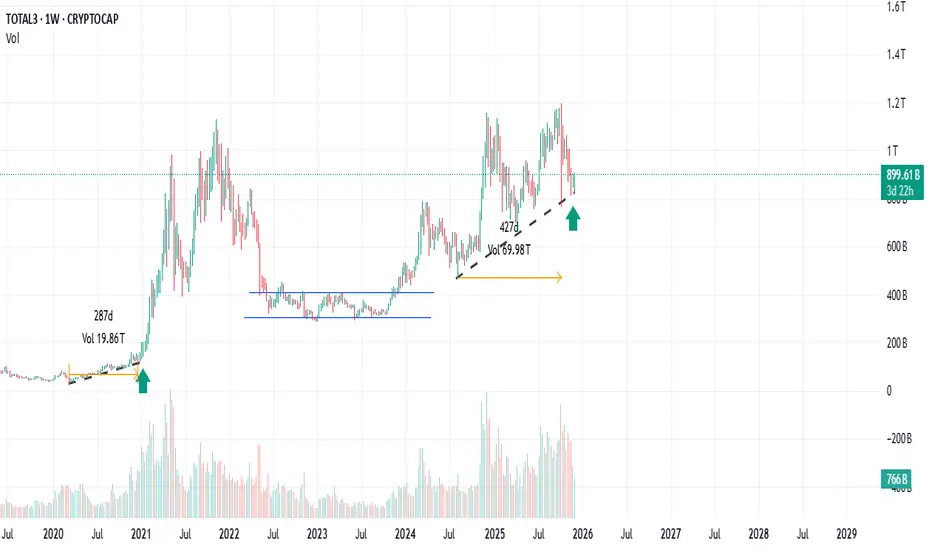
TOTAL3: Altcoin Market At A Big Decision PointThe green line is a fractal of gold’s price from 2011–2020, meaning the altcoin market is moving in a very similar pattern to how gold moved back then.
Scenario 1: Break above 942B 🚀
If TOTAL3 breaks and holds above 942B, it means buyers are strong and the market is likely ready for a big altcoin bull run.
In this case, there is a good chance the price action will continue to follow the green gold fractal, with higher highs and a long, powerful uptrend for altcoins.
Scenario 2: Lose 661B support 😬
If TOTAL3 falls below 661B, price can drop to the next major support area lower on the chart, where buyers previously stepped in.
This bearish scenario is less likely at the moment, but if it happens it would probably mean a deeper correction and a longer wait before a strong altcoin season returns.
BTC.D 4H – Market Structure OutlookHi fellow traders,
On the 4H BTC Dominance chart, I am applying Elliott Wave principles to outline a directional scenario for the broader crypto market. After completing the recent downward leg, I expect dominance to move higher in three waves, forming a corrective structure before the larger continuation to the downside can resume.
This is not a trade setup, but a structural roadmap to understand how capital may rotate across the crypto market. As long as BTC.D remains below the invalidation level at 61.32%, my expectation is that dominance will eventually turn lower with TP1, TP2, and TP3 as the downside objectives - signalling increasing strength for ALTcoins.
If dominance breaks above the invalidation level, this scenario is no longer valid.
Good luck and trade safe!

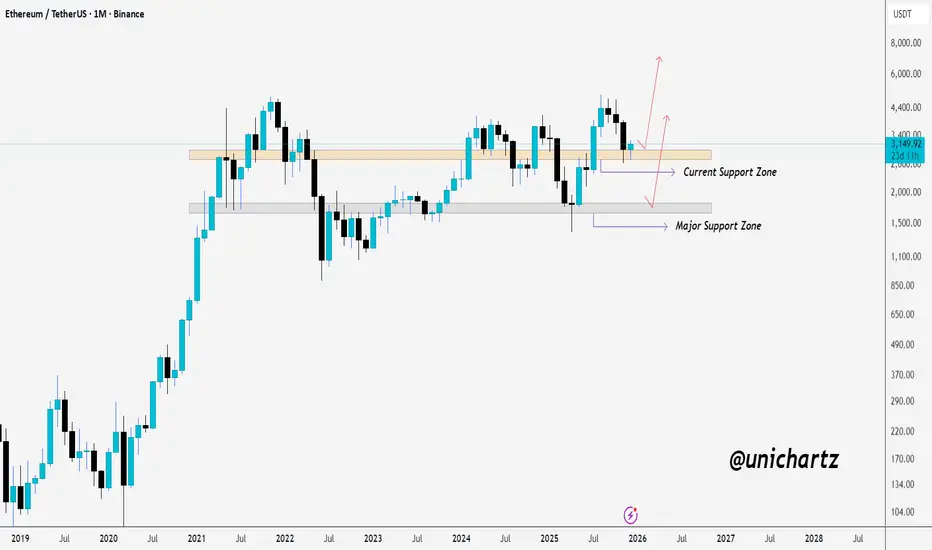
ETH Monthly Structure Intact Above SupportCRYPTOCAP:ETH is holding its monthly support zone once again, showing buyers are still defending this level.
As long as the price stays above this area, the structure favors a bounce toward the upper range.
A breakdown, however, would shift focus to the major support zone below.
DYOR, NFA
Altcoins \ Altseason Others / BTC ratio is in its lowest momentum zone in history...
Historic demand area has been tested once again, marking the final phase of capitulation.
Every major altcoin season has begun with just such silence.
What's coming will explain the silence.

OCTA - LONG TERM GEM - HODL Long-term gem alert! 🚨
I believe OctaSpace [ CRYPTOCAP:OCTA ] is one of the best DePIN R/W assets on the market.
Probably a superior DePIN ecosystem & product compared to $ RENDER, but heavily underpriced!
Quick comparison:
While CRYPTOCAP:RENDER dominates rendering with a 4B+ market cap, #OCTA offers a broader compute ecosystem (GPU/CPU rental, AItraining, remote gaming, animation rendering) at 3x cheaper rates than centralized competitors all with justan 8M market cap yet!😱
In one platform, you get access to:
🔸GPU Rental
🔸AI Training
🔸Remote Gaming
🔸Animation Rendering
🔸And more!
My bag is partially loaded under $ 0.200 💎
Technical outlook:
✅ Bull div on RSI Daily
✅ HTF wedge structure
✅ 100% token in circulation - only $ 8M market cap!
📈 Working product, building for mass adoption
📈2025 Users & data growth rates is 🔥
From my experience across market cycles, working products like this can deliver multiple X price increases within a few months. HODL 💎
⚠️ Not financial advice - only sharing alpha plays & my personal views.

ALCTCOIN SEASON? OTHERS MARKETCAP 1w ALCTCOIN SEASON? OTHERS MARKETCAP 1w
2022–2025: Horizontal Compression + Higher Lows
The highlighted yellow structure is a classic Higher Lows Compression Pattern:
-Each retest forms a higher low on the macro trend
-RSI repeatedly bounced from the oversold midline zone
-Price consolidated sideways while RSI formed a structural uptrend
-That combination usually signals a high-timeframe trend continuation.
Late 2025: The 4th Retest → Final Compression Before Breakout
This is the most critical part of the entire chart:
Price held the trend midline once again
The same level worked in 2019, 2020, 2022, and now 2025
RSI touched the 32 zone — historically the super-cycle altcoin bottom region
This setup has only appeared four times in the entire cycle.
Scenario: Structural Breakout Into 2026
If the midline holds and price expands upward from here, the following macro structure triggers:
The 2017–2025 compression ends
Altcoin marketcap enters a parabolic expansion phase
Rotations follow: Majors → Midcaps → Lowcaps
BTC dominance starts to unwind
Altcoins enter a broad-based, 2021-style run — but potentially larger in scope
The upward arrow on the chart represents exactly this:
7 years of compression preparing to break.
Summary
Trend midline is still intact
RSI is at cycle-level oversold
4th retest confirmed
Compression + higher lows = structural breakout setup
OTHERS marketcap is entering 2026 standing right on the edge of a “Breakout or Mega Trend” moment.
This chart suggests the altcoin market hasn’t started running yet — it’s only loading.
OTHERS/BTC 1M
PLUS:
• Bitcoin dominance is losing strength.
• ETH/BTC is on the verge of breaking an 8-year downtrend to the upside.
• Altcoin ETFs are right in front of us.
-----------------------------------------

BTC.D OutlookFalling down with the 2017's pattern is a possible scenario. If happens so, we can have Altseason Q1-Q2 2026 until BTC.D reaches 40%. It may be the final target, but it can reach 24% in Q1 2027 if it wants to do the complete pattern; however, the whole market is down probably by that time.

LAVA +150% UP! $LAVA --> +155% Up 🔥 , given on a silver platter!!
You must like & share this beauty 🏆

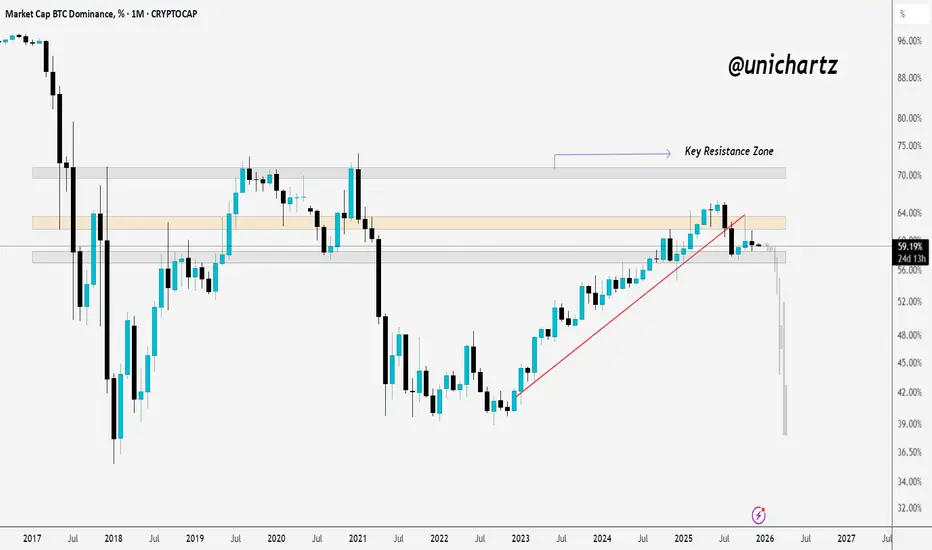
BTC.D Rejected From Key Monthly ResistanceBTC dominance is still sitting below the key monthly resistance zone, showing clear rejection from the top.
As long as dominance stays under this area, it suggests money isn’t aggressively flowing into BTC, leaving room for altcoins to stabilize or gain some strength.
A breakout above the resistance would shift momentum back toward BTC, but for now the structure looks capped below this zone.
DYOR, NFA
AXS OutlookGiven the current market conditions, I think AXS could move above $2 at any time with a single move.

LUNA OutlookRecently LUNA rose from $0.06 to $0.15. It is enough for now guys! Market didn't rise. Let's pump AXS (Axie Infinity) and ONE (Harmony) now. Thanks


ALTSEASON ? 4 years of pressure is about to break !“Rebirth Against NVDA: Altcoins Have Reached a Historic Threshold.”
Four Years of Pressure Is About to Break ❗️
This chart actually shows two things at the same time:
**(1) The total size of the altcoin market (OTHERS marketcap)**
and
**(2) The relative strength of altcoins against a major tech giant like NVIDIA (OTHERS/NVIDIA pair).**
One reflects market breadth; the other reveals whether altcoins are *truly* gaining strength.
---The 2017 and 2021 Altseasons
The clearest message in this chart is this:
Whenever a major altseason occurred, **two signals appeared simultaneously**:
• OTHERS marketcap exploded (the blue area surges upward)
• The OTHERS/NVDA ratio also turned sharply higher
This means capital flowing into altcoins didn’t just expand marketcap — altcoins actually **outperformed the stock market**, especially a powerhouse like NVDA.
That’s why the shaded zones around 2017 and 2021 are so important:
An altseason isn’t just a rise in marketcap; it begins when the **relative strength trend flips** in favor of altcoins.
---
Long-Term Downtrend: 4+ Years of Pressure
The black line (OTHERS/NVDA) has been in a **declining trend channel** since 2021.
The red arrows show how this trend resistance has been respected again and again.
Each attempt by altcoins to gain strength has been rejected — they simply couldn’t outperform NVDA.
And this delivers a structural message from the market:
**“Altcoins haven’t been able to produce sustained strength against tech stocks for the past 4 years.”**
---
Where We Stand Now: The Final Stage of Compression
The most visible feature right now is this:
The pair is squeezing tightly inside a **falling wedge**.
This is one of the classic patterns we see before major long-term moves.
Once the compression resolves, there are usually two scenarios:
---
Upside Breakout → A New Altseason Signal
• The long-term trend resistance breaks for the first time
• OTHERS marketcap rises simultaneously
• A rotation similar to 2017 and 2021 begins
Downside Breakdown → NVDA and Tech Continue to Dominate
• Altcoins fail to generate strength
• Capital stays in large-cap equities and BTC
• Altcoins remain under pressure for longer
---
What Is This Chart Really Saying?
In simple terms:
**“Altseason is not just a rise in marketcap.
The real signal is altcoins gaining strength against the stock market.”**
And right now, the pair is at the very edge of a long-term compression.
These setups are rare — and the move after the breakout is rarely small.
---
What to Watch From Here
• A breakout above the OTHERS/NVDA downtrend
• Holding the retest after breakout
• OTHERS marketcap reacting upward at the same time
• BTC dominance flattening or turning lower
• Loss of momentum in mega-cap stocks like NVDA
If these align, the chart is essentially saying:
**“A new altseason is beginning.”**
---
Final Words
This chart summarizes one of the most important truths in crypto:
**There is no real altseason unless altcoins can compete with the major tech stocks.**
And right now, the fate of that competition depends on whether this multi-year downtrend finally breaks.
The destiny of altcoins is tied to how this compression against NVDA resolves.
Whichever way it breaks will set the tone for the next cycle.
Personally, I’m on the positive side — I believe an upside breakout is close.
All we need is patience.
OTHERS MARKETCAP 1w
OTHERS/BTC 1M
---
PLUS:
• Bitcoin dominance is losing strength.
• ETH/BTC is on the verge of breaking an 8-year downtrend to the upside.
• Altcoin ETFs are right in front of us.

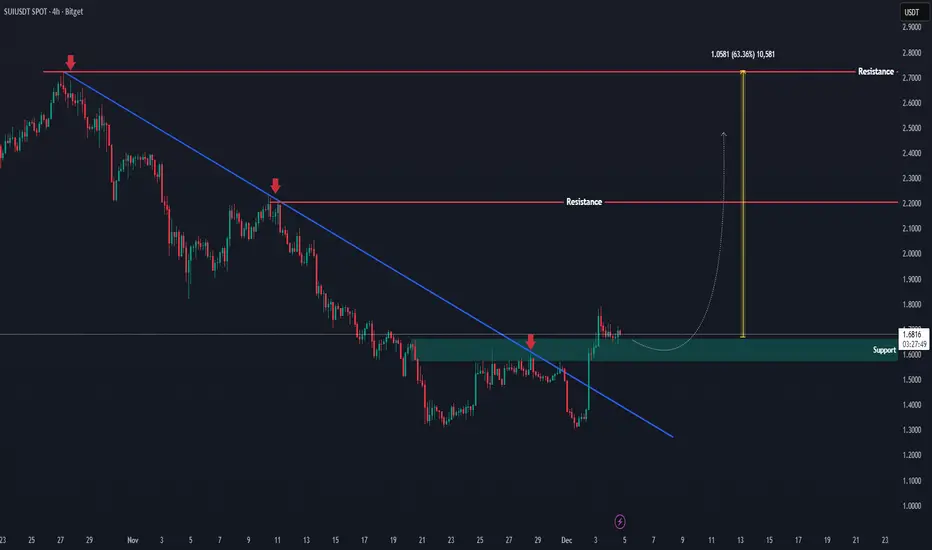
SUI Just Broke Out — A Big Move Might Be Loading!!SUI has finally broken out from its extended downtrend, showing a clean breakout above the descending structure. Price is now retesting the previous rejection zone, which has flipped into an important support area after the breakout.
If this retest holds, the chart suggests a potential continuation toward the next major resistance zone. The structure is showing early signs of a bullish reversal, with momentum beginning to shift to the upside.
For now, the key focus is how price reacts at this reclaimed zone — a strong confirmation here could open the path for a larger move upward.
Altcoins Get a Boost as ETH/BTC Breaks StructureETH/BTC breaking out of the falling wedge is a positive sign for the altcoin market.
When this pair starts gaining strength, it usually boosts overall altcoin performance.
If ETH holds this breakout, it could ignite a broader altcoin rotation in the coming sessions.
DYOR, NFA
#PEACE
Please hit the like button if you like it, and share your views in the comments section.

Altseasons start?CRYPTOCAP:TOTAL3 shows rejection on weekly candle horizontal trendline, could alt season be starting soon?
previously it started from the 2nd week of December, but at that time the halving had just started, is the halving theory no longer relevant now?
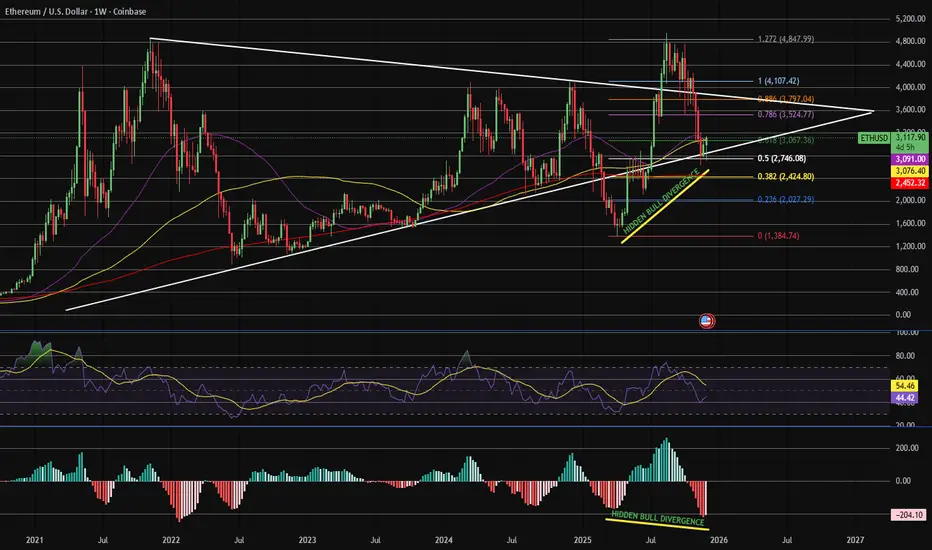
Ethereum (1W) 5 Year Pennant, Weekly Hidden Bullish DivergenceEthereum seems to be gearing up for a huge rally, despite the what I call 'Bearish Propaganda' in the news and permeating throughout social media crypto influencer discourse, calling for a 12-15 month bear market.
We see Ethereum bouncing off the lower trend line (demand line) of the approx. 5 year pennant formation on the weekly timeframe.
In addition, we have weekly hidden bullish divergence between the weekly MACD and weekly price action. Couple these 2 facts together, along w/ QT ending the 1st of Dec. 2025 and QE via liquidity injections coming soon, I find it hard to believe that Ethereum alongside major cap alt-coins will not rally.
This could turn into the most hated bull rally we've seen since crypto's inception.
Keep an eye on the charts!
SOL Near Inflection PointCRYPTOCAP:SOL is holding well above the mid S/R zone and showing solid strength. If it continues to rebound from this area, price could push back toward the upper resistance.
But if SOL breaks below this zone, it may slide down toward the $80 levels.
DYOR, NFA
Please hit the like button if you like it, and share your views in the comments section.

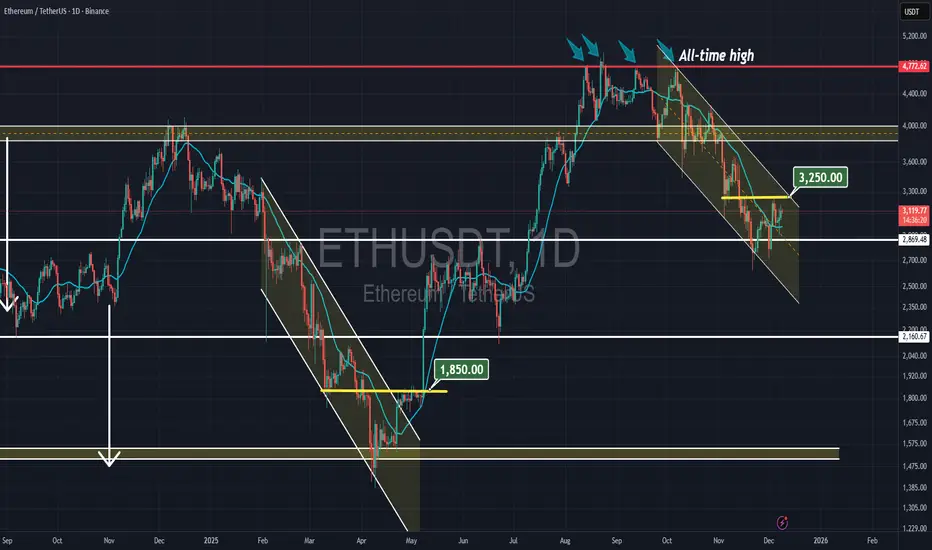
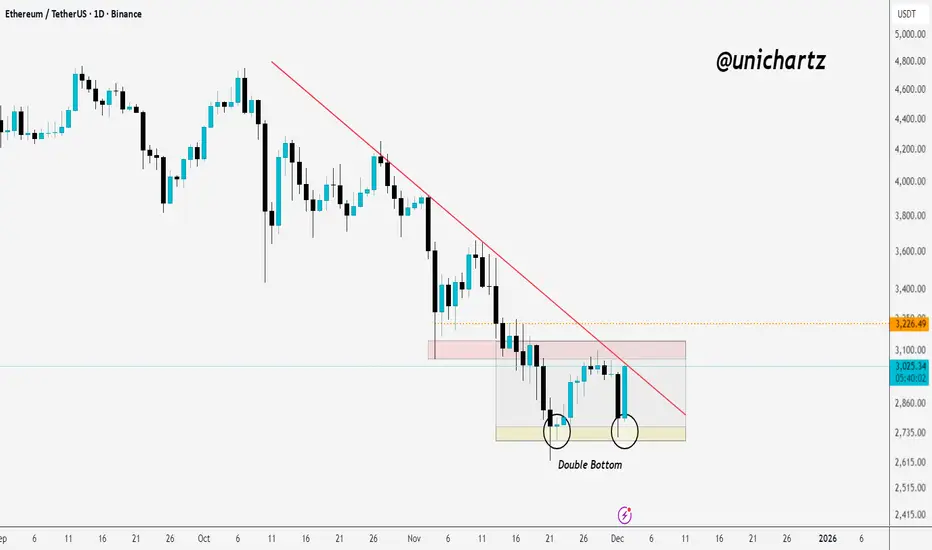
ETH Daily Structure Turning Bullish?CRYPTOCAP:ETH has formed a clear double-bottom pattern on the daily timeframe.
A breakout above the trendline and the consolidation zone would be a strong signal of a potential trend reversal.
Keep an eye on this setup, it could turn bullish quickly if confirmed.
DYOR, NFA
Please hit the like button if you like it, and share your views in the comments section.
ETH : SELL MARKET!!!Hello friends
Well, as you can see, we are in a very strong downtrend and the sellers have full control.
Now, any price increase can be a selling opportunity, until the buyers show strength, we cannot say that the trend has changed...
Of course, we are also at important support and we need to see whether buyers support the price or not. Until then, we will not trade on guesswork and predictions.
This analysis is purely technical and is not a buy or sell recommendation, so please exercise your risk and capital management.
*Trade safely with us*

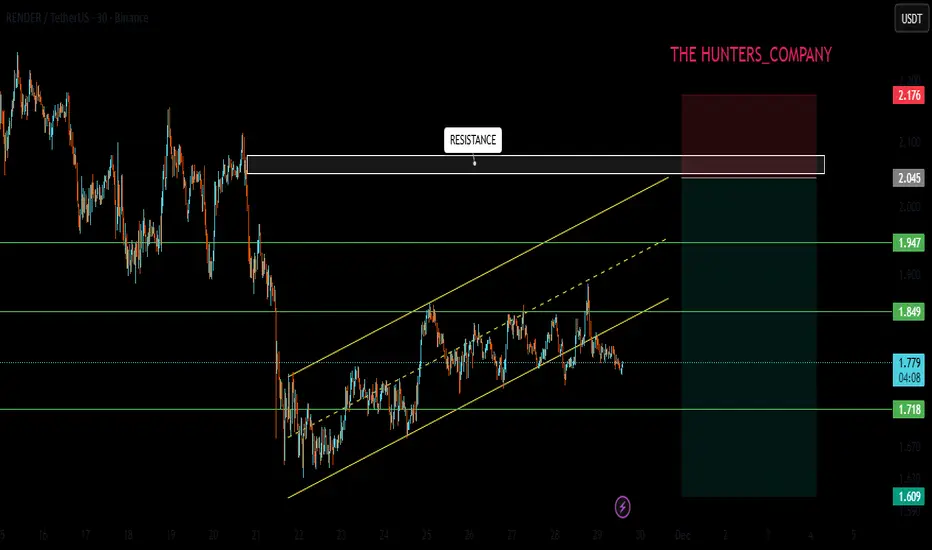
RENDER/USDT : SELL LIMITHello friends
Given the downward trend we are having, you can see that the power is in the hands of the sellers.
Now, if the price reaches the resistance areas, it is a good opportunity to sell. Be careful that if the structure breaks, it is no longer logical to sell.
So we should see the power of the buyers in the resistance area, but most likely we will see a price correction.
This analysis is purely technically reviewed and is not a buy or sell recommendation, so do not act emotionally and observe capital management.
*Trade safely with us*