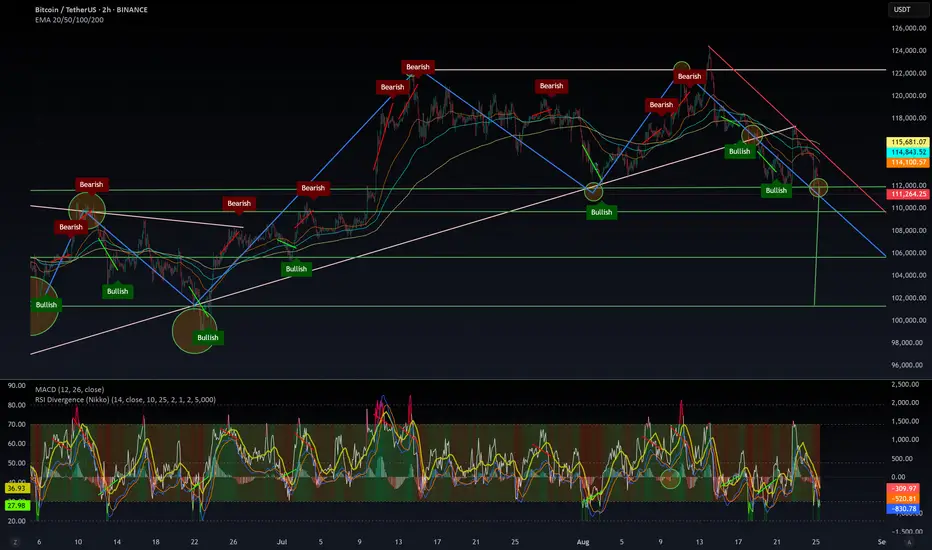
$BTC bounce at $112 or drop down to $101.3??CRYPTOCAP:BTC is forming a massive “M” pattern with a potential target around $101.3.
There are multiple support levels on the way down, so a bounce could happen at any of them. Ideally, this scenario gets invalidated with a strong rebound from $112K. Otherwise, the correction may drag on for weeks until a solid bottom is found.
The RSI is oversold on the 2H, but on the 1W timeframe, CRYPTOCAP:BTC looks like it’s just entering a longer-term correction.
⚠️ If the weekly bearish trend confirms, we could be facing several months of downside.
Will this trigger the start of alt season, or will altcoins get crushed even harder? Nobody can say for sure—so stay cautious and don’t get trapped by FOMO.
Here is the 1W chart, which is scary to be honest.
Altseason
TIA - Bullish wave awaited! LSE:TIA - bullish breakout awaited💣
Trend remain hihly oversell on the monthly basis
I expect to see a bull run toward 2.20 - 2.300$ key resistance next! 📈
Key support to be maintained: 1.675$

The Telcoin Explosion Starts Now!Telcoin reminds me of the early days of the Bitcoin cycle. I see strong potential for a massive pump coming soon. When cycles are this undervalued—when the community is strong, the fundamentals are solid, and the chart looks amazing—almost nothing can stop a parabolic run from happening.
As always, stay profitable.
– Dalin Anderson

BOSON looks ready to fly!!$BOSON looks ready to explode way more 🚀
+20% up on the daily, and volume is tanking 📈
if you don't know yet about fundamentals, #boson is gonna lead the #RWA + #AI field!

ETH Game PlanETH Game Plan
📊 Market Sentiment
Market sentiment remains strongly bullish as the FED is expected to deliver a 0.25% rate cut, with speculation building for a possible 0.5% cut in September. Monetary policy shifts are being driven by both inflation trends and weakening labor market data. The latest August and September job reports were soft, signaling that the economy is cooling rapidly. This environment continues to fuel expectations for a major bullish run in the weeks ahead.
📈 Technical Analysis
Price has shown strong HTF bullish momentum, recently reaching all-time highs.
Currently, ETH appears to be in an accumulation phase, gathering liquidity and energy before the next expansion higher.
📌 Game Plan
Price should run the $4200 level, which is equal lows and likely contains significant liquidity.
I will then look for a close back above $4200 with a newly formed 4H demand zone.
🎯 Setup Trigger
4H structure break following the liquidity run.
📋 Trade Management
Stoploss: 4H swing low confirming the BOS
Targets:
TP1: $4500
TP2: $4650
TP3: $5000 (All-Time Highs)
💬 Like, follow, and comment if you find this setup valuable!
⚠️ Disclaimer: This content is for informational and educational purposes only and does not constitute financial, investment, or trading advice. Always do your own research before making any financial decisions.

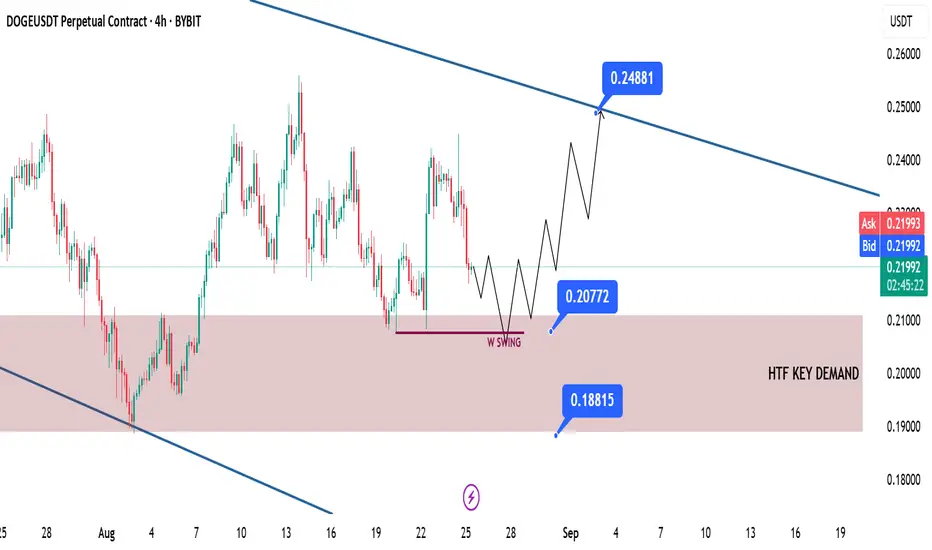
DOGE Swing Long Idea DOGE Game Plan
📊 Market Sentiment
Overall sentiment remains bullish, supported by expectations of a 0.25% rate cut in the upcoming FOMC meeting. A weakening USD and increasing global risk appetite are creating favorable conditions for further upside in crypto assets.
📈 Technical Analysis
Price is retracing towards the HTF Demand zone, which I expect to act as a bounce area.
Moreover, price currently seems to be seeking liquidity to fuel its next bullish move. That liquidity could be the weekly swing low at $0.207.
📌 Game Plan
Wait for price to reach the HTF Demand zone.
Look for price to sweep liquidity and close back above the $0.207 level.
🎯 Setup Trigger
I will be waiting for a 4H market structure shift before entering the trade.
📋 Trade Management
Stoploss: Daily close below HTF support zone — $0.188
Target: $0.248
💬 Like, follow, and comment if you find this setup valuable!
⚠️ Disclaimer: This content is for informational and educational purposes only and does not constitute financial, investment, or trading advice. Always do your own research before making any financial decisions.
COW - TP2 HITTSX:COW - TP2 ✅
Clean falling wedge H4 breakout & retest ✅📈
We could see a big bull impulse similar as 🚀

TOTAL2 - Very Strong Bullish Favor This trend line is amazing. I know its the regular chart rather than the log but it can still be applied.
Look at the current position on the trend line and the candles that are progressing
A massive breakout is coming for alts
XRP and ETH are leading this breakout I believe
VERY bullish

Crypto Market Is Recovering From Support; ALTseason To Resume?Good morning Crypto traders! No major changes in the Crypto market since yesterday, but we can see the Crypto TOTAL market cap chart recovering nicely within wave (C) or (3) as anticipated on September 1st:
There may still be room for more upside as the US Dollar Index (DXY) continues to weaken. Since we are still in a risk-on environment, cryptocurrencies could experience a stronger recovery. Moreover, with the ALTcoin dominance chart breaking higher out of consolidation, ALTseason may resume soon.
Notice that Crypto TOTAL2 market cap chart, which excludes BTC, is still eyeing all-time highs, so we may see a breakout higher into final wave (5) of 5 soon.

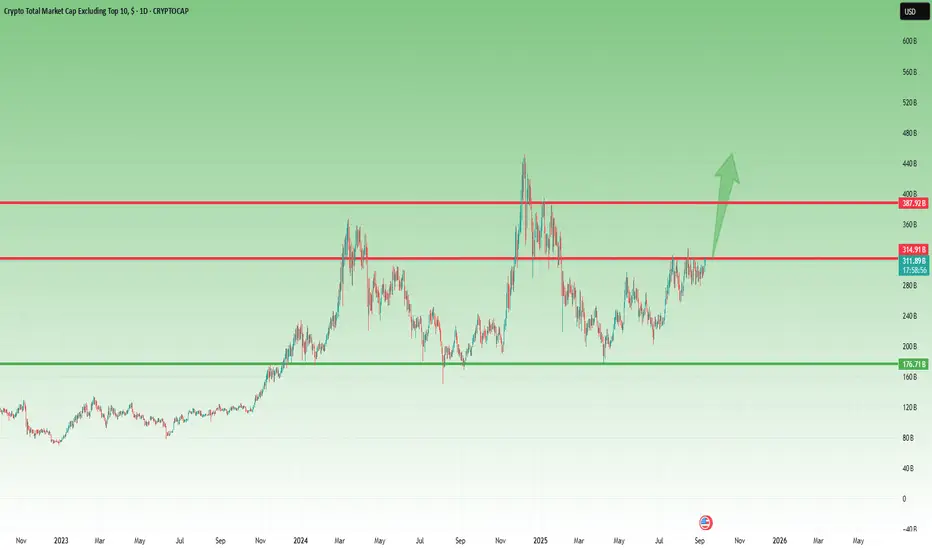
Smaller alts, a constructive outlookThe Big Question: Will We Finally See Moves on Alts?
The past month – or rather the past 6 weeks – has been nothing short of frustrating for altcoin traders. Most individual charts looked stagnant, choppy, or simply lacked momentum. But zooming out to the Total chart, the picture is much clearer, and the answer looks like a confident YES .
What the Chart Tells Us
• After the December 2024 top, we witnessed a deep correction, which finally bottomed on 7 April, during the infamous tariff mania .
• From there, an initial leg up developed, reaching resistance around the 300B mark.
• The correction that followed was healthy: it established a higher low, confirming that the bottom was not just a dead cat bounce.
• The next attempt pushed even deeper into resistance, creating a higher high – a strong bullish sign.
• Since the end of July, things have turned even more interesting: the market has been pressing hard into resistance, and we could even argue the formation of a continuation Head & Shoulders setup.
Where We Are Now
At the time of posting, the Total chart is testing resistance at ~310B once again. The more this level gets tested, the weaker it becomes. A breakout from here doesn’t just look possible – it looks almost unavoidable .
What to Expect Next
When that resistance finally breaks, the tension built up over months of sideways action – and the frustration of traders who have been waiting for more than half a year – will likely unleash a strong acceleration.
In my view, we could easily see a 50% rally, taking the Total chart back to the December 2024 highs.
🚀 The stage is set. All that’s missing is the trigger.
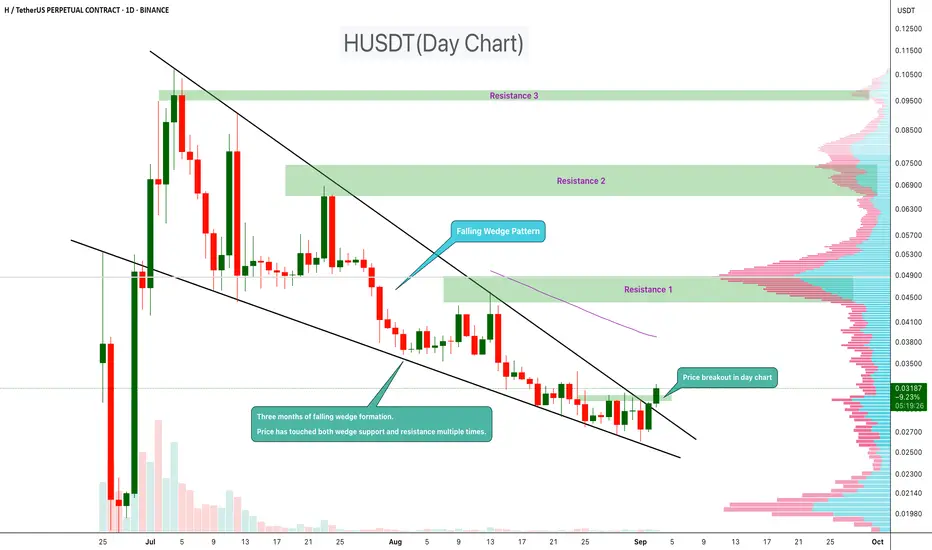
HUSDT Reversal Signal – Wedge Pattern BreaksHUSDT has been forming a falling wedge pattern over the past three months. During this period, the price has tested both the wedge support and resistance multiple times, confirming the structure.
Now, a breakout has appeared on the daily chart, suggesting that bullish momentum may be building. Falling wedges are typically seen as reversal patterns, often leading to upside continuation once the breakout is confirmed.
Resistance 1:$0.045
Resistance 2:$0.066
Resistance 2:$0.095
cheers
Hexa
ETHFI ; Has purchase confirmation been given?Hello friends
Given the decline we had, the price has been in a good support and then managed to break through its resistance and now in the pullback we need to see the reaction of the buyers. If the Fibonacci support is maintained, the price can move to the specified Fibonacci steps, which has been specified.
Don't forget capital and risk management.
*Trade safely with us*

BREAKING: Grayscale just filed for Chainlink $LINK ETF🚨BREAKING: Grayscale just filed for Chainlink CRYPTOCAP:LINK ETF with the SEC.
🟩20% + correction from previous monthly level Given
🟩Clean falling wedge & continuation pattern 📈
🟩Weekly ichimoku flipped bullish
🟩Long term uptrend keep supporting prices
🚀Next step: 30$+
Key support to be maintained for bull scenario:
20.00 - 19.50$

$TAKE - on fiire NSE:TAKE is up another + 30% ✅🔥
if price keep consolidating above the previous ATH resistance acting as support, then I expect to see further price increase toward 0.2500$ & more 📈🎯

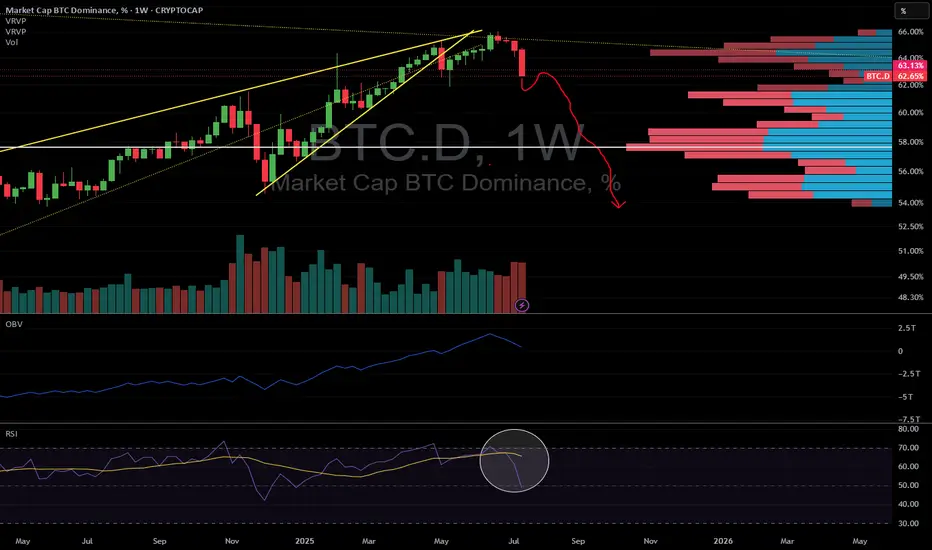
Dominance breaking down signals Altseason is here !!There is no doubt in my mind that an Altseason is now in progress !
The May2025 low has been taken out.
Now things will start accelerating.
We could have a backtest of the resistance at 63.13 % (dotted fuxia line).
But we also could not !!
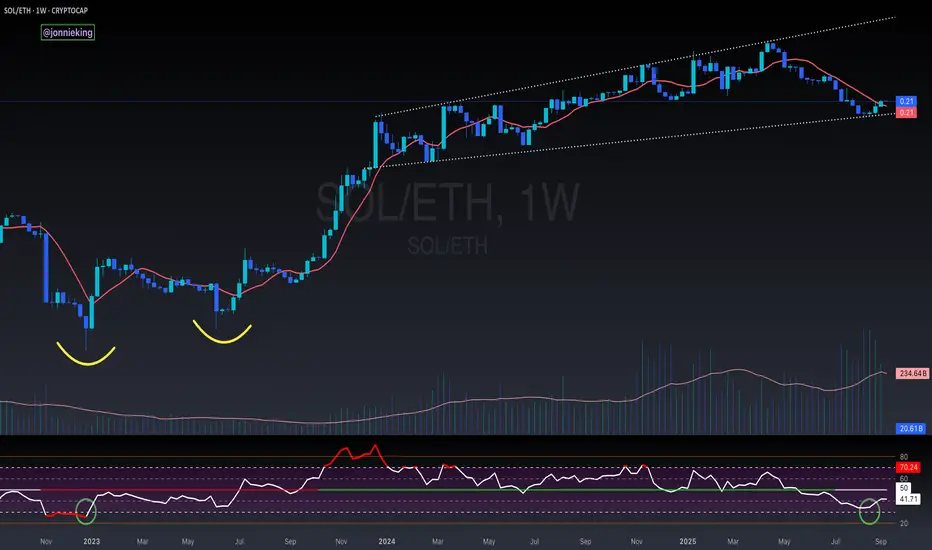
$SOL / $ETH REVERSAL * ALT SEASON *🚨 The CRYPTOCAP:SOL / CRYPTOCAP:ETH REVERSAL has officially been confirmed.
✅ 3 White Solders
✅ Weekly close above 9WMA
✅ Broadening Wedge
Money is moving down risk, which brings outsized returns.
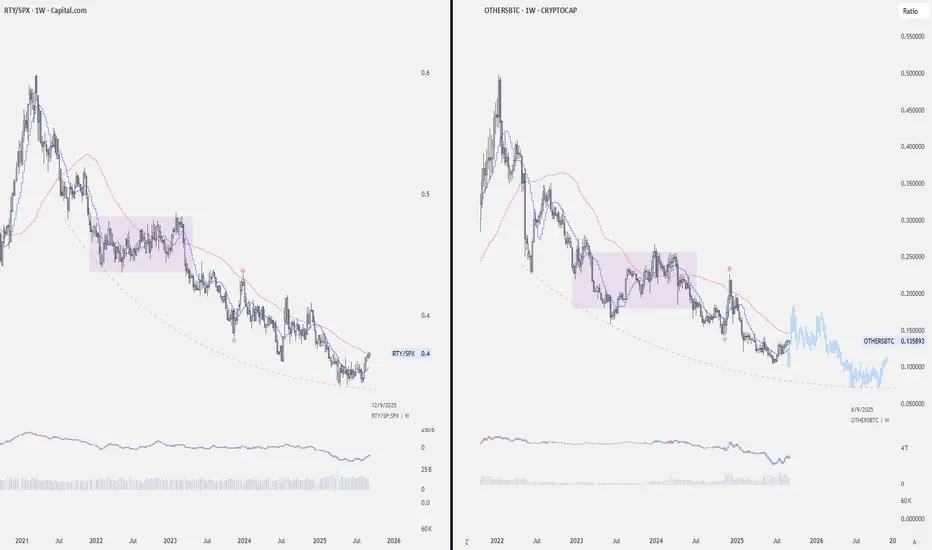
RTY/SPX vs OTHERS/BTCRTY (Russell 2000) - U.S. small-caps
SPX (S\&P 500) - U.S. large-caps
OTHERSBTC represents the ratio of the total market capitalization of all cryptocurrencies excluding the top 10 (commonly smaller-alt or “other” coins) relative to Bitcoin’s market cap.
Right now, RTY/SPX is retesting its yearly rVWAP with a pretty clean bottoming structure. If OTHERSBTC follows the same script, it could retest the 0.18–0.20 zone before one more leg down, and then set up for a move higher
Definitely worth keeping on watch.
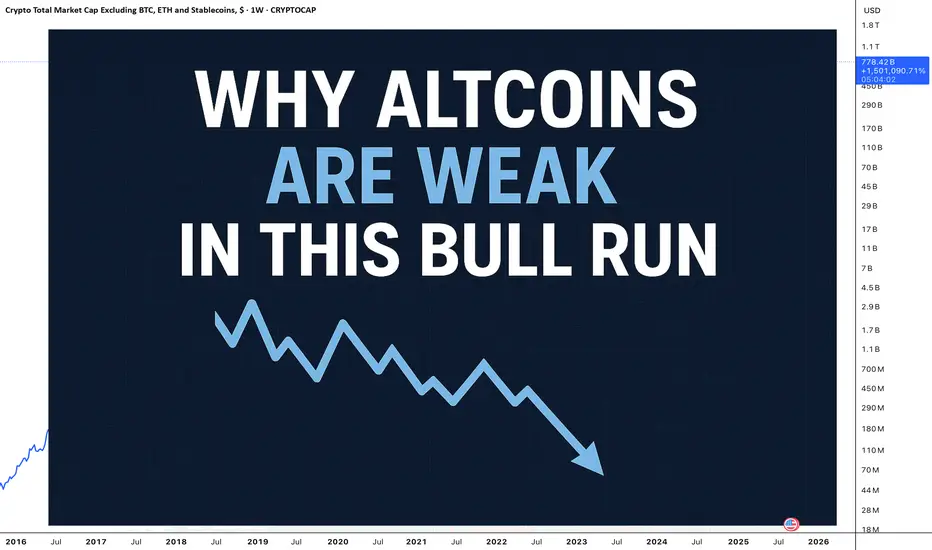
Why Altcoins Are Weak in This Bull Run?The crypto market is in a bull run, but something feels different this time. While Bitcoin and Ethereum are setting new highs, many altcoins are struggling to keep up. In previous cycles, altcoins often outperformed once Bitcoin found stability — but this round looks weaker. Here are a few reasons why altcoins are underperforming:
✅ Bitcoin Dominance Is Rising
Capital flows in crypto follow a cycle. Early bull phases usually start with Bitcoin, as institutions and large investors prefer its liquidity and reputation as a "safer" crypto asset. Bitcoin dominance has been climbing, signaling that capital is consolidating into BTC instead of spreading into smaller, riskier altcoins.
✅ Liquidity Is Thinner Across the Market
Unlike previous cycles, global liquidity conditions are tighter. With interest rates higher and risk appetite lower, speculative capital isn’t flooding into altcoins at the same pace. Most investors would rather deploy into BTC or ETH than gamble on small-cap tokens with uncertain narratives.
✅ Regulation & Exchange Listings Matter More
This cycle is also shaped by increased regulatory scrutiny. Many altcoins face delisting risks or uncertainty around whether they qualify as securities. This discourages both retail and institutional investors from rotating heavily into alts.
✅ Narratives Are Narrower
In past cycles, new sectors (DeFi in 2020, Metaverse in 2021) created explosive altcoin rallies. This time, the strongest narratives are Bitcoin ETFs and Ethereum staking. Without a fresh, sector-wide altcoin narrative, capital rotation is limited to a few selective themes like AI coins or Real-World Assets (RWA), rather than lifting the entire alt market.
✅ Market Maturity & Survivorship Bias
The crypto market has matured. Many speculative altcoins from past cycles have faded or collapsed. Survivors now trade more in line with fundamentals and adoption, meaning the era of every token pumping in unison is over.
Conclusion
Altcoins are weaker in this bull run because the cycle is more institutional, more selective, and more Bitcoin-focused. That doesn’t mean altcoins won’t have their moment, but traders should be more careful this time. Instead of chasing every low-cap token, focus on strong narratives, liquidity, and projects with real adoption.
Altseason may come, but it won’t look like the ones of the past.
Cheers
Hexa
BINANCE:BTCUSDT BINANCE:ETHUSDT CRYPTOCAP:BTC CRYPTOCAP:ETH CRYPTOCAP:XRP CRYPTOCAP:BNB
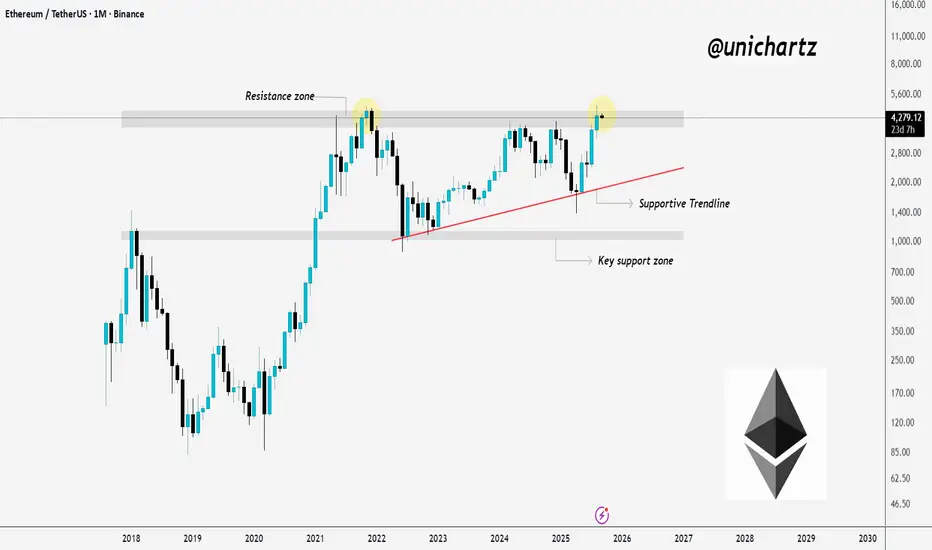
Decision Time for ETHCRYPTOCAP:ETH is struggling at the marked resistance zone.
Price has tested this area multiple times, which confirms it as a strong supply region. Right now, ETH is consolidating below resistance while holding above the supportive trendline.
If bulls can secure a clean monthly close above this resistance zone, the path opens for continuation toward higher levels. But if rejection plays out again, we could see a pullback to the supportive trendline or even toward the key support zone before another attempt.
This level is critical, it will decide whether ETH breaks into a new rally or spends more time ranging.
DYOR, NFA
More updates coming soon, Stay turned
BTC Game Plan – Long OpportunityBTC Game Plan – Long Opportunity
📊 Market Sentiment
Market sentiment remains firmly bullish as the FED is expected to deliver a 0.25% rate cut, with growing speculation of a potential 0.5% cut in September. Monetary policy adjustments are being driven not only by inflation but also by weakening labor market data. The latest August and September job reports came in soft, signaling that the economy is cooling rapidly. This backdrop strengthens expectations for one of the most significant bullish runs in the weeks ahead.
📈 Technical Analysis
BTC has confirmed bullish momentum after breaking the bearish trendline.
Price action currently looks like an accumulation phase, preparing to expand liquidity higher. I see this as a range-bound delivery where price takes both sides of liquidity pools located at the extremes, rather than running directly into new all-time highs.
📌 Game Plan
1)Watch for price to retrace into the 4H demand zone around $109,400.
2)Look for liquidity sweep at the 4H swing lows.
3)Possible deeper retracement into the 0.75 discount zone near $108,700.
🎯 Setup Trigger
I will look for a confirmed 1H break of structure before entering long.
📋 Trade Management
Stoploss: Below the 1H swing low responsible for the BOS
Targets:
• TP1: $103,450
• TP2: $117,400
💬 Like, follow, and comment if you find this setup valuable!
⚠️ Disclaimer: This content is for informational and educational purposes only and does not constitute financial, investment, or trading advice. Always do your own research before making any financial decisions.

Dejitaru Tsuka: A Puritan of Decentralized Finance?I've made other UNISWAP:TSUKAUSDC_67CEA3 posts prior to this one. The targets are all over the place. This is partly due to TradingView's Fibonacci tool sometimes acting erratically, but also due to premature assumptions on my part.
re: $777 target
This one was very much wild, especially in near term. This was due to my belief that TSUKA would be printing an impulsive wave (I was still growing in my Elliott Wave studies, as I am now too). My belief is now different, and I think the chart has confirmed the same.
re: sub $100 targets
These were totally due to a glitching Fib tool. Thanks TradingView.
re: targets between $100-$130
These are fully expected to be in order based on the Fibs and form of TSUKA's macro fractal. The only thing that could negate such targets in my opinion is Bitcoin breaking below $75,000 before October - December 2026 . I think this would be a strong and decisive indication that altseason is officially over (and the first major fractal for Bitcoin's macro chart).
Between today and the end of altcoin season, I expect that Dejitaru Tsuka will outperform 99% of all available tickers, of all available markets .
*Key price levels and expected periods of transitional moves are very likely to change. Surf carefully/closely.

HYPE | Looking for All-Time HighsHYPE | Looking for All-Time Highs
📊 Market Sentiment
Market sentiment remains strongly bullish as the FED is set for a 0.25% rate cut, with the possibility of a 0.5% cut in September. Monetary policy is being adjusted not only in response to inflation but also weak labor market data. Recent August and September job numbers came in soft, signaling that the economy is cooling rapidly. This shift is fueling expectations for one of the strongest bullish runs in the coming weeks.
📈 Technical Analysis
HYPE continues to show a strong HTF bullish trend — one of the most bullish structures currently in crypto. Price retraced into the 0.75 HTF discounted range and reacted strongly from there. This level also aligned with the HTF bullish trendline, creating a clean confluence. Following the bounce, price established a fresh 4H demand zone, adding further validation to the bullish outlook.
📌 Game Plan
I will be watching for price to revisit the 4H demand zone, which also overlaps with the HTF bullish trendline. This zone aligns with the 0.5 Fibonacci equilibrium level, making it a key area of interest for continuation to the upside.
🎯 Setup Trigger
I will look for a confirmed 1H break of structure before entering long.
📋 Trade Management
Stoploss: Below the 1H swing low responsible for the BOS
Targets:
• TP1: $47.78
• TP2: $51.20 (ATH)
💬 Like, follow, and comment if you find this setup valuable!
⚠️ Disclaimer: This content is for informational and educational purposes only and does not constitute financial, investment, or trading advice. Always do your own research before making any financial decisions.
