Bozo Benk – Road to Top 300
Bozo is a low-float, high-conviction breakout that’s showing all the early signs of a full-blown cycle runner. Right now, it’s flying under the radar — but that won’t last long.
coingecko: BozoBenk
Key Metrics:
Current Market Cap: $4.72M
Target Market Cap (Top 300 Range): ~$200M
Total Supply: 800M
Circulating Supply: ~400M (50% of tokens are locked)
If we hit a $200M market cap on just 400M circulating tokens, that gives a projected price of:
$200,000,000 / 400,000,000 = $0.50 per token
That's a 100x from here — and yes, that’s within striking distance in meme coin terms when a proper run begins.
Why This Isn’t Just “What If” Talk:
Low Float = High Velocity
With only 400M tokens in circulation, price impact per dollar is massive. When buyers show up, price moves fast — and that speed becomes the magnet.
Breakout Is Confirmed
After months of accumulation, Bozo just cleared its resistance zone. Volume spike. Momentum flip. Classic early-stage markup.
Reflexivity Effect
As price rises, more eyes come in. CT starts posting. Telegrams start firing signals. The crowd sees the move, and FOMO becomes self-fueling. This is how 10x becomes 50x.
Realistic Target Based on Ecosystem
$200M is not a moonshot. There are dozens of meme coins with less utility and worse structure sitting at or above that level. If capital rotates back into memes — and it always does — Bozo is positioned to ride that wave hard.
The Alpha:
This isn’t about “maybe” — it’s a perfect mix of low cap, reduced float, clean chart, and momentum fuel.
A $200M market cap on 400M circulating tokens = $0.50.
You're here at ~$0.005.
That’s the kind of asymmetry you don’t get often — and when it runs, there won't be time to chase.
Know what you hold. Trade it like you mean it.
Altseason

Skeptic | Bitcoin Weekly Recap #15 Bull Run On? Altcoin Next?Hey everyone, Skeptic here! Bitcoin’s been throwing curveballs this past week—did it leave you spinning? 😵 Still unsure if the bull run’s officially on, or hunting for the perfect altcoin entry? Don’t worry, in this recap, I’m laying it all out with clear reasoning to give you a crystal-clear view of the market and help you ditch those FOMO-driven decisions. Here at Skeptic Lab , we analyze Markets with one motto: No FOMO. No hype. Just reason. We’re not like others who panic over dumps or hype every pump—we’ve got risk management , stop losses , and we stay glued to the market’s pulse. Let’s dive into the Bitcoin Weekly Recap and unpack it all! 📊
Monthly Timeframe: The Big Picture
Let’s zoom out to the last three months. The 74,000 to 82,000 range has been a rock-solid support zone for Bitcoin, with heavy shadows every time we touch it. Big shadows like that scream potential trend reversal, and right now, Bitcoin’s major trend is firmly uptrend. Until we see a clear signal for a trend change, all that noise about Bitcoin crashing to 50K or “the bull run’s over” is pure nonsense. If you hear anyone making those bold future price predictions, run the other way! Our job isn’t to predict the future—it’s to map out scenarios and have a plan when they play out. Comparing the 2022 bear market to now is flat-out silly. Why? Back then, we’d already seen massive gains, but now, we haven’t had significant growth yet—altcoins are quiet, and total market volume hasn’t spiked. The end of a trend isn’t when everyone’s scared of losses; it’s when everyone’s dreaming of becoming a millionaire and the news is pumping FOMO. 😄 So, ignore those baseless analyses and let’s get to the real stuff.
Weekly Timeframe: Momentum Check
On the weekly chart, we kicked off a solid uptrend momentum, even hitting a new all-time high. Bears tried to jump in and sell, but here’s the catch: the previous ceiling hasn’t been technically broken yet, so we haven’t gotten a clear buy signal. Why? Because support and resistance levels aren’t static—they shift over time. The longer time passes, the higher or lower these levels move, and they need updating. Right now, we got rejected after testing the ceiling because our true resistance is still intact. So, when do we get confirmation? Let’s drop to the Daily Timeframe for clarity.
Daily Timeframe: Spot Trigger
After breaking 112,000 , we’ll get the main confirmation that the last ceiling before the correction is broken, signaling the continuation of the major uptrend per Dow Theory. That’s our spot buy trigger—buy above 112,000 with a stop loss below 100,000 , giving you a 10% stop loss size. Please, manage your capital so that if you hit the stop loss, you lose no more than 3% of your total capital. Staying alive in financial markets hinges on risk management. Now, let’s hit the 4-Hour Timeframe for long and short triggers.
4-Hour Timeframe: Long & Short Setups
We had a solid upward trendline on the 4-hour chart, but it broke to the downside. When this happens, two scenarios are possible: either the uptrend’s slope has just softened with no trend change, or we’re entering a correction. My take? We’re likely heading for a time-based correction (think range-bound boxes). If we start ranging, don’t beat yourself up or pile into trades impulsively—win rates for most traders tank in range phases, and losing streaks pile up. For long positions, I suggest waiting for a break above 108,900 . That’s where we got a strong rejection and pullback last time, so we need solid confirmation to go long since bearish momentum is stronger in this phase. For shorts, 105,000 was a good level, but the next short trigger is a break below support at 101,577 . If we see a strong reaction at any level on this timeframe before that, you could short on a break there too. For breakout confirmation, indicators like SMA or RSI work, but volume is king. High volume on a break means it’s likely to continue; low volume screams fake breakout, so cut your risk there.
Bitcoin Dominance (BTC.D): Altcoin Timing
Let’s wrap up with a quick look at BTC.D to figure out if it’s time to jump into altcoins. BTC.D shows Bitcoin’s share of the total crypto market cap—the higher it is, the more liquidity flows into Bitcoin, often from altcoin sales. On the daily chart, we’re still above an upward trendline I mentioned in previous analyses, and altcoins haven’t made any real moves. When I say “moves,” I mean serious 100-500% or even 10,000% rallies , not just 10-20% pops. An altseason would be confirmed by a break of this trendline and a drop below support at 60.27. That’s when we’d expect massive altcoin gains, but it only works if Bitcoin’s already in a strong uptrend with solid market liquidity. Otherwise, don’t expect crazy altcoin pumps. The total market cap needs to be growing too for this to happen.
💬 Let’s Talk!
If this recap sparked some ideas, give it a quick boost—it means a lot! 😊 Got a pair or setup you want me to tackle next? Drop it in the comments. Thanks for joining me at Skeptic Lab—let’s grow together with No FOMO. No hype. Just reason. Keep trading smart! <3✌️

AKT/USDT Analysis💥 CSEMA:AKT - Swing Long Plan After 30% Correction 💥
AKT faced heavy selling pressure around the weekly pivot at $2.0640 , leading to a significant correction of nearly **30%**. The big question now: **Is it time to open a swing long?**
Here’s my take👇
Although we’ve already seen a 30% drop, that doesn’t mean the downside is over . For a high-conviction swing long, patience is key. I’m watching **three key levels** to build a position safely — no FOMO here.
🔹 Long Area 1 : $1.1291 (25% allocation)
🔹 Long Area 2 : $0.9722 (35% allocation)
🔹 Long Area 3 : $0.8234 (40% allocation)
💡 This is my ultimate swing long setup . Scaling in at these levels provides a better risk-reward profile rather than chasing the bounce.
But what if price only taps **Long Area 1** and then reverses? That’s fine too. The priority is **capital preservation and strategic entries**, not catching every single move.
✅ Focus: Make more with less risk
❌ Avoid: Emotional entries and overexposure
📌 Not financial advice. Do your own research. Trade safe! 🧠💰
#AKT #SwingTrade #CryptoAnalysis #TradingStrategy #DYOR #Altcoins

ETH Holding Long-Term Support – Road to $4K Open?CRYPTOCAP:ETH has successfully bounced from a long-term rising trendline that has acted as strong support since 2020. This trendline has historically triggered major bullish moves, and it’s doing its job once again.
Notably, ETH has also reclaimed the mid support/resistance level, which had previously acted as a key flip zone in past market cycles.
With both the trendline and horizontal support holding, the structure looks bullish. If momentum continues, ETH could head toward the upper resistance line, potentially targeting $4,000+ in the coming months.
The trend remains intact — this bounce could mark the start of a major leg up.

Actions Nightmare Is About To Be FinishedHello, Skyrexians!
Recently I shared this article about CRYPTOCAP:OTHERS.D where I pointed out that this chart is about to print another one lower low. Now it's happening, but this is wave 5 and now it's time to look for the altcoins bear market bottom.
Here we have 4h time frame and the internal structure of the final wave 5. Our main reversal signal can be divergence on Awesome Oscillator, and now it can happen if this drop will be decelerated. Price is inside the large green box - reversal zone. If we will see 3 rising columns on the histogram it's going to be the reveal signal with the yellow Elliott waves structure. This structure can be changed if price continues going down now without pullbacks. In this case I will recalculate waves and may be it will reach 7%. Also it shall match with BTC dominance which also has some space to go up. It shall at least retest the high at 65.5% (potential shortened wave 5).
Best regards,
Ivan Skyrexio
___________________________________________________________
Please, boost this article and subscribe our page if you like analysis!

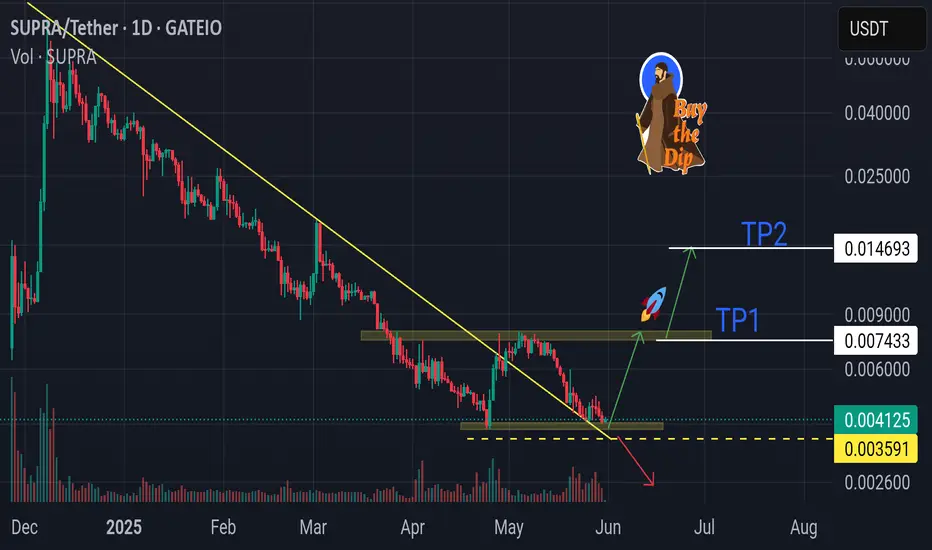
SUPRA !! Big double bottom setupSupra has potential for double bottom. invalid level if it falls below 0.003591.
DYOR!NFA!
Altseason is cancelled for now. But Should resume soon.If you're interested in altcoins, be sure to check out my ideas. I’m closely tracking CRYPTOCAP:BTC.D and CRYPTOCAP:OTHERS , and you’ll find plenty of valuable insights in those analyses.
So, what’s going on? My CRYPTOCAP:OTHERS prediction played out — May was bullish. But was it the real altseason? Not quite. The true altseason typically begins at the end of the Bitcoin cycle, and we’re not there yet.
Right now, we’re seeing price action reminiscent of December 2024. Bitcoin maximalists are aggressively buying BTC during a time it should be correcting, which is inflating BTC dominance and crushing any momentum for an altseason. They appear to be using altcoins as exit liquidity to pump BTC, especially as retail investors hesitate to buy Bitcoin above $100K.
What’s next?
The daily MACD suggests we’re entering a correction phase that could last around two weeks. A drop toward $1.2T is likely, as there's a major order block between the current level and that target. However, the real support lies below $900B — my "green box" — which I view as the ideal buy zone.
Historically, entries in this green box have offered 2x–3x returns on high-volatility altcoins from the top 100, especially in sectors like memes, DeFi, and AI.
I expect altcoins to correct into that zone in the coming weeks — keep an eye on it.
DYOR (Do Your Own Research).
#Crypto #Altcoins #Bitcoin #BTC #BTCdominance #Altseason #CryptoMarket #CryptoTrading #MACD #TechnicalAnalysis #DeFi #MemeCoins #AIcoins #AltcoinSeason #DYOR

Altcoins The Moon AwaitsLike always, everything is clearly outlined on the charts :
- As a trader, it's crucial to follow logic and technical analysis. If you get caught up in the news and listen to everyone on Twitter, you won't last long.
- The first major altcoin rally was in 2018, pushing the market to $300 billion. This level later acted as a key support throughout the 2022–2023 bear market.
- The last all-time high for the crypto market (excluding Bitcoin and Ethereum) reached $1.15 trillion in 2021. ( blue doted vertical line )
- This all-time high was retested in December 2024, with this ATH acting as strong resistance. ( second blue doted vertical line )
- The next move could be a breakout above this resistance. According to Fibonacci projections, the altcoin market has the potential to reach $4 trillion.
While the spotlight remains on Bitcoin and ETFs, altcoins could catch up with a sudden and powerful surge, so make sure you’re not left behind.
Hodl!
Happy Tr4Ding !

$FET is about to re-enter my buy green zone. Quick update on this coin:
The consolidation appears to have found its bottom, and the bullish divergence has played out as expected.
We’re currently seeing a slight cooldown on the daily timeframe, which is healthy after the recent move.
If NYSE:FET enters my green buy zone, it could offer a strong long entry opportunity.
As always, make sure to DYOR, especially during these uncertain times for altcoins.
#FET #CryptoUpdate #Altcoins #TechnicalAnalysis #BullishDivergence #CryptoTrading #BuyZone #CryptoMarket

$BTC.D Dominance forecast: update May 2025📉 BTC Dominance (%BTC.D) Update – At Resistance, Altseason in the Balance
Back on April 5th, I published a forecast highlighting the critical 65% resistance level on BTC Dominance. That analysis still holds: BTC.D reached 65% and got rejected, pulling back to 62% as of now.
⚔️ What’s Happening?
Bitcoin dominance is compressing, and we're approaching a make-or-break moment:
🔹 Resistance confirmed at 65%
🔹 We bounced down to 62% — not up
🔹 Market is hesitating, and the next move will shape the short-term direction for alts
🔍 The Bigger Picture
Bitcoin pumped hard recently, mostly due to:
MACD reversal on the weekly
Oversold conditions now turning bullish
Renewed institutional interest in risk-on assets
But let’s be clear:
🚫 We’re not in a full altseason yet.
What we’re seeing is cautious altcoin rotation, not a blow-off alt rally.
📊 Tech Indicators
MACD: Overheated
RSI: Still has room to move up
So technically, BTC.D could still break out above 65% — but it hasn’t yet.
⚠️ What to Watch:
If BTC.D breaks out above 65%, expect:
➡️ Altcoin bloodbath
➡️ BTC.D could head toward 70%, crushing the mini-altseason
But if BTC.D continues to drop from here?
➡️ Altseason starts to heat up
🔮 Outlook
A true altseason might not arrive until September/October. For now, the market is stuck in a range of uncertainty.
Keep your eyes on:
BTC.D reaction at 62%–65%
TradFi stress (bond markets, macro fears)
Bitcoin strength and ETH/BTC ratio
🧠 Take profits when you can. Protect your capital.
📌 Follow me for future updates—and don’t forget to DYOR.
📎 Original forecast:

Winter Is Coming — And LINK Is Leading the Charge (x25) Chainlink acts as a bridge between blockchain and the real world.
This asset has been on our radar for years, silently building strength. Its fundamentals are rock-solid, and the current price action is highly favorable for a strategic buy.
📈 On November 12, 2023, LINK officially confirmed its journey to $400 by breaking through our algorithmic confirmation zone. Since then, it’s shown a modest price increase… and right now, it's retesting one of the best buy zones we've seen.
But here's the catch:
In the coming weeks, we expect explosive rallies — the kind that won’t allow for optimal entries anymore.
✅ We are currently positioned long on LINK, and it’s proving to be one of our strongest investments to date.
And remember:
The assets we publish on TradingView have already confirmed their trajectory toward our predicted targets.
🎬Not even Trump... not even a world war could stop what’s coming.
🚀 Buckle up... because winter is coming.
And LINK is ready to lead the storm.
🔍 Disclaimer: This is our personal analysis and not financial advice. Always do your own research before making any investment decisions.
💬 What’s your take on this? Drop your thoughts in the comments and feel free to share this with your friends! ❤️

$DOT - Polkadot imminent bullish momentumHey traders!
Hope you are doing GREAT!
On this occasion I've decided to spot on CRYPTOCAP:DOT as its showing a clear bullish momentum ( as other alts). The chart is clear about the movement. There is no need to use fancy indicators neither a complex analysis.
Just price action.
As a brief comment, $Polkadot broke a clear bearish trend with confirmation on the daily timeframe. That's why I'm looking for a speculative trade (just in and out).
What I'm targeting? Prices between 6.00 USD and 7.00 USD in short term could be a nice zone to take profits.
Stay tuned!

ETH | New ATH on the cards | Fibonacci $7K TARGET Ethereum is gearing up towards the upside and we're seeing another resistance zone being crushed.
While BTC is trading sideways, we can expect ETH to play catch-up:
Don't miss yesterday's update on DOT:
_____________________________

HolderStat┆ADAUSD above the $0.72 levelCRYPTOCAP:ADA broke the falling channel, replaced by a higher-low structure; consolidation near 0.75 sits atop trendline support. Maintaining 0.65 keeps bulls in control for a push toward the 0.90 resistance band flagged above.

HolderStat┆BNBUSDCRYPTOCAP:BNB breakout watch: Binance Coin reclaims the 692 pivot, carving a triangle within an ascending channel and aiming at the 740 supply zone. Technical analysis notes firm trend-line support, bolstering a bullish continuation view for traders.

HolderStat┆XRPUSDCRYPTOCAP:XRP price pulse: Ripple leaps from consolidation and now coils just under 2.48 resistance inside a falling wedge. TA signals breakout toward the ceiling, mirroring earlier triangle bursts, while layered support keeps the bullish scenario in play.

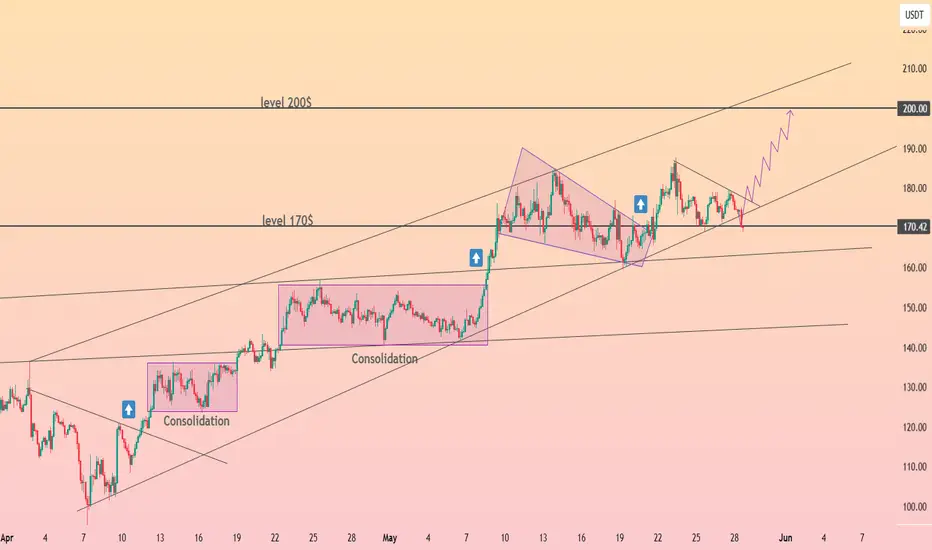
HolderStat┆SOLUSDCRYPTOCAP:SOL price radar: Solana escaped dual consolidations and now oscillates between 170 and 200 inside an ascending channel. Bulls defend trend-line support as a tightening wedge eyes 200. Chart structure and price analysis favor further upside momentum.
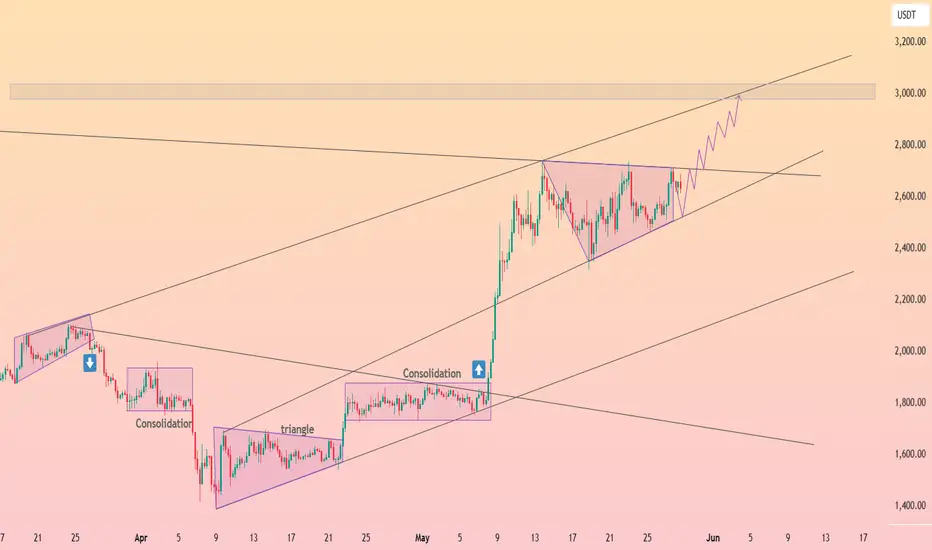
HolderStat┆ETHUSDCRYPTOCAP:ETH momentum check: After breaking consolidation, Ethereum rides an ascending wedge, clinging to support while eyeing the 3000 supply band overhead. Earlier triangle pops hint bulls may punch resistance. Chart bias and TA remain constructive.
DOG Main Trend. Reversal Zones 05/29/2025Logarithm. Time frame 3 days. The chart shows key reversal zones in the horizontal channel, and when exiting it. For clarity, percentages are shown from the skin reversal zone. This is convenient for understanding the risk and potential profit in long and short work. You can also work in spot from long, from key zones (more relevant, as margin trading on assets of such liquidity, is extremely destructive, due to price slippage under the market, but already on such assets by a huge percentage, for your liquidation (accumulation of liquidity-benefit of gambling addicts in general).
Now the price has hit the resistance of the internal channel, that is, the zone of the “main liquid” price movement. From the reversal, local profit is significant, therefore, when working, observe risk management and wait for a breakthrough of this resistance level (you can place a trigger order), or wait for a rollback (if there is one), for example, to the median of the channel.
The horizontal channel itself is reformatted into a potential “microphone” (what was half a year ago on bitcoin, with resistance to the 72 thousand zone, and liquidity collection 53-58).

GEC gecko inu ready for pump IHNS pattern, volume increase significantly is a sign of reversal 🚀🛰
NFA!DYOR!

Pancake swing tradePancake is getting ready to release all the pressure that was build up inside of it.
we have vast amount of liquidity above us that we need to take.
Get ready! 🚀🌕
(You have the full responsibility for each action that u take because I'm not your financial advisor)

QNT BreakoutTraders,
As you can see from the BINANCE:QNTBTC pairing, that QNT looks to be ready to breakout.
As well as on the CRYPTO:QNTUSD Chart on the right hand side, we are about to see a breakout of this trend pattern which looks to be a Symmetrical Triangle. We have many other indications that this market is soon to start moving on some of these top alt coins.
This is a simple chart posted to show areas of interest when QNT moves forward toward price discovery. It is very possible to see the final target depicted on the chart on the right by the end of this alt coin season that we firmly believe started last month. Meaning we saw the bottom of the markets for the alt coins that are looking ready to start moving within the next 6-8 weeks.
Stay profitable folks,
Savvy

ETH 2025: $3000 is Key to Escaping Ethereum's Consolidation TrapEthereum (ETH) May Remain Consolidated Throughout 2025 if it Fails to Hit $3000: Here’s Why!
May 27, 2025 – Ethereum (ETH), the world's second-largest cryptocurrency, finds itself at a critical juncture. After a period of significant volatility and notable gains, ETH's price has entered a prolonged consolidation phase. While numerous bullish signals point towards a potential surge, a formidable barrier stands at the $3000 mark. Failure to decisively conquer this level could see Ethereum locked in a sideways trading pattern throughout much of 2025, deferring hopes of a new explosive bull run. This article delves into the intricate factors dictating Ethereum's price trajectory, exploring the tug-of-war between bullish aspirations and the stubborn realities of market resistance.
Section 1: The Current State of Ethereum - A Prolonged Consolidation
As of late May 2025, Ethereum continues to trade within a defined range, struggling to make a sustained break in either direction. The price has been attempting to pierce pivotal resistance zones, with recent attempts this month failing to hold despite decent volume. Some market observers note that Ethereum is currently consolidating between the $2,400 and $2,750 range. This period of consolidation is not unusual in cryptocurrency markets, often representing a "breather" after significant price movements or a period of price discovery as market participants digest new information and sentiment.
Historical chart patterns suggest that Ethereum may have entered a crucial price range, an "accumulation zone," which could prevent a significant breakout for several months. Certain technical indicators, which help identify trends when growth rates fluctuate, show ETH price entering bands that have historically preceded consolidation periods, sometimes lasting nearly a year, before the next major bullish wave. Given that ETH has already consolidated for approximately four months, another similar period could be on the horizon if key resistance levels are not breached.
This consolidation is a focal point for investors and analysts alike. On one hand, it can be seen as a period of building strength before the next upward move. On the other, prolonged consolidation can lead to investor fatigue and a potential drift lower if bullish catalysts fail to materialize. The market is currently in a state of anticipation, closely watching for signals that could indicate the end of this sideways movement. Ethereum's price is currently hovering in the mid-$2,500s, recovering slightly after brief consolidation and respecting key support levels.
Section 2: The $3000 Hurdle - A Critical Inflection Point
The $3000 level for Ethereum is more than just a number; it represents a significant psychological and technical barrier. A decisive break above this level would likely instill strong bullish sentiment, potentially paving the way for further gains towards previous highs and beyond. Conversely, a repeated failure to surmount $3000 could confirm the strength of the resistance, leading to a loss of upward momentum and an extended period of consolidation throughout 2025.
Market sentiment often coalesces around such round numbers. A breakthrough can trigger a fear of missing out, attracting fresh capital. Failure, however, can lead to disappointment and profit-taking, reinforcing the consolidation range. As of May 2025, ETH is expected by some to trade between $2,400 and $2,900, with a monthly close above $2,750 strengthening the case for retesting $3,000 in the coming quarter. Some projections suggest ETH might hover near the $3000 resistance in the summer months, potentially seeing profit-taking before a new range is established. If ETH fails to rise above the ascending trend line it has held since mid-2022, and with technicals like a potential bearish "Death Cross" (where a shorter-term moving average crosses below a longer-term moving average on weekly charts), the price could remain restricted below $2500 for a while, making the $3000 target even more challenging in the near term.
Section 3: Bullish Signals Amidst Consolidation - The Hope for a Breakout
Despite the consolidation, several bullish signals offer hope for an eventual breakout and a more dynamic 2025 for Ethereum.
Altseason Hopes
The term "altseason" refers to a market phase where alternative cryptocurrencies (altcoins) experience significant price surges, often outperforming Bitcoin. Ethereum, as the leading altcoin, plays a crucial role in signaling or even triggering such a season.
Recent technical analysis suggests that Ethereum has reclaimed a key technical level – the mid-line of a significant channel indicator on the two-week chart. This moving average-based band tracks long-term momentum. Historically, closing above this mid-line has preceded sharp price gains for ETH and marked the start of altseasons. For instance, after surpassing this mid-line in 2020-2021, ETH rallied dramatically. A similar pattern in late 2023 saw ETH climb significantly within a year. As of May 2025, the upper band of this channel represents the next significant resistance. A breakout above this could target previous cycle highs.
The impact on the broader altcoin market has also been historically significant. The combined market cap of altcoins (excluding ETH) surged considerably over a year after Ether's close above this channel's midline in past cycles. Some analysts suggest that ETH reaching certain key levels could signal the potential onset of an alt season.
Bitcoin Dominance and Altcoin Market Cap
The prospect of a 2025 altseason is further supported by patterns related to Bitcoin dominance – Bitcoin's market share of the total crypto market capitalization. Historically, after Bitcoin halvings, Bitcoin dominance tends to drop sharply, triggering altcoin rallies. This was observed in previous post-halving periods. With the latest halving in April 2024, a similar period is approaching, and a decline in Bitcoin dominance could occur within the next few months. If this trend repeats, some market observers anticipate the altcoin market cap could surge toward substantially higher figures. A falling Bitcoin dominance implies that capital is shifting from Bitcoin to altcoins, making them the market's primary focus.
Technical Formations
Several bullish technical patterns are currently visible on Ethereum's charts:
• Ascending Triangle: Ethereum's price action has been forming an ascending triangle pattern, characterized by a horizontal resistance level and a rising support line. This pattern typically indicates that buyers are gaining strength, pushing prices to higher lows against a flat resistance. A breakout above the horizontal resistance of this pattern could lead to a significant upward move.
• Inverse Head and Shoulders: Some analysts have identified an inverse head and shoulders pattern on daily trading charts, a classic bullish reversal pattern. The neckline of this pattern is cited around the $2,700 mark. A decisive close above this level could confirm the breakout, with an immediate target of $3,000.
• Bull Flag: On the daily chart, Ethereum appears to be forming a bull flag pattern, which is a bullish continuation pattern that typically follows a strong rally. The current sideways price action forms the flag, and a breakout could lead to a significant price increase.
• Bullish Market Structure: Despite the consolidation, the broader market structure for Ethereum can still be interpreted as bullish, with the potential for consecutive higher highs and higher lows to remain intact if key support levels hold. ETH trading above its key Exponential Moving Averages (EMAs) indicates a strong technical structure.
Analyst Sentiment
Market observers are cautiously optimistic, with many eyeing the $3,000 level as the next major milestone. Some predict that if Ethereum stays above $2,550, a breakout toward higher levels is likely in the near term. Holding above $2,500 is seen as crucial. If bullish momentum persists and broader crypto sentiment remains favorable, ETH could target the $4,000–$4,500 range later in 2025. Institutional interest, evidenced by spot Ether ETFs attracting inflows and Ethereum's growing market capitalization, also underpins a positive outlook.
Section 4: The Bearish Undertones - Risks and Fragility
Despite the array of bullish signals, Ethereum's path is not without significant obstacles and inherent fragilities.
Substantial Supply Near Cost Basis
A concerning factor highlighted by on-chain data is the substantial amount of Ethereum supply acquired near the current price levels. Analysis of blockchain data indicates that a very large volume of ETH supply, valued in the tens of billions of dollars, is near its cost basis and at risk of flipping into a loss if prices dip. This creates a precarious situation. If ETH's price were to fall below these investors' average acquisition price, it could trigger a wave of selling as holders try to minimize losses or break even. This sell-side pressure could exacerbate any downward trend or prolong the consolidation phase. There is also a significant cluster of investor cost-basis distribution around the $2,800 price level, implying potential sell-side pressure as ETH approaches this zone from investors looking to offload assets near breakeven.
Stubborn Resistance Levels
Ethereum is currently coiling under significant resistance. The $2,700 level has proven to be a formidable barrier, with ETH facing rejections multiple times in May. This level represents a key hurdle for bulls. Failure to convincingly break above $2,700, and subsequently $2,800 and the ultimate $3,000 target, could see selling pressure intensify. Each failed attempt can strengthen the perception of these levels as a ceiling, encouraging more traders to sell at these points.
Macroeconomic and Market-Wide Factors
The broader cryptocurrency market is susceptible to macroeconomic headwinds. Factors such as interest rate policies from central banks, regulatory developments, and global economic stability can significantly impact investor sentiment and capital flows into riskier assets like cryptocurrencies. While some anticipate potential interest rate cuts later in 2025 which could be bullish, ongoing quantitative tightening could pose a challenge. Bitcoin's dominance, while potentially set to fall, has also surged in early 2025, overshadowing altcoins for a period and reflecting a "risk-off" environment at times. Any negative shifts in these broader conditions could dampen Ethereum's breakout prospects, regardless of its specific technical or on-chain signals.
Section 5: Why Failure to Hit $3000 Could Mean Extended Consolidation in 2025
The $3000 mark is a critical psychological and technical threshold for Ethereum. Should the cryptocurrency fail to breach this level decisively in the coming months, several factors could contribute to an extended period of consolidation throughout 2025.
• Loss of Upward Momentum: A failure to achieve a widely anticipated price target like $3000 can significantly dampen investor enthusiasm. Bullish momentum is often self-reinforcing; when it stalls at a major resistance, the energy can dissipate, leading to a more cautious or bearish sentiment. Traders who bought in anticipation of a breakout might exit their positions, adding to selling pressure.
• Strengthening of Resistance: Each time a price level like $3000 (or even preceding levels like $2,700-$2,800) successfully repels an upward advance, it becomes a more established and psychologically potent resistance zone. More market participants will view it as a ceiling, placing sell orders around it, thus making future breakouts even more difficult.
• Capital Rotation: If Ethereum's price remains stagnant while other cryptocurrencies or asset classes show more promising returns, capital may flow out of ETH. Investors are constantly seeking the best risk-adjusted returns, and a prolonged consolidation in ETH could lead them to look for opportunities elsewhere in the dynamic crypto space or even in traditional markets.
• Investor Fatigue and Profit-Taking: Extended periods of sideways movement can lead to investor fatigue. Those who have been holding ETH through the consolidation might become impatient and decide to sell, either to lock in existing profits (if any) or to free up capital for other ventures. This is particularly true for the significant portion of supply bought near current price levels, where the desire to break even can lead to selling pressure if upward momentum wanes.
• Confirmation of Historical Patterns: As mentioned earlier, historical chart patterns suggest that Ethereum can enter extended consolidation phases before major bull runs. A failure to break $3000 would align with these historical precedents, suggesting that the market might indeed be settling in for a longer period of range-bound trading.
• Impact on "Altseason" Narrative: Ethereum's performance is often seen as a bellwether for the broader altcoin market. If ETH struggles to break key resistance and enter a clear uptrend, it could delay or diminish the prospects of a widespread "altseason," further contributing to a more subdued market environment for ETH itself.
Essentially, a failure at $3000 would signal that the current buying pressure is insufficient to overcome the selling interest at that level. This equilibrium could persist for an extended period, leading to the price oscillating within a defined range as bulls and bears remain in a deadlock. Until a significant catalyst emerges – be it a major network upgrade with immediate perceived value, a shift in macroeconomic conditions, or a surge in institutional demand that overwhelms sellers – Ethereum could find itself tracing a path of consolidation through 2025.
Section 6: Scenarios for 2025
Looking ahead, Ethereum's trajectory in 2025 largely hinges on its ability to overcome the current consolidation and the critical $3000 resistance. Several scenarios could unfold:
Scenario 1: Breaching $3000 and Igniting a Bull Run
This is the optimistic scenario favored by many ETH proponents.
• The Breakout: Ethereum successfully smashes through the $2,700-$2,800 resistance zone and then decisively conquers the $3000 psychological barrier. This breakout would likely be accompanied by a surge in trading volume, confirming strong buying interest.
• Targets: Once $3000 is overcome, analysts eye targets such as $3,200, $3,500-$3,600, and previous cycle highs around $4,100. Some even more bullish long-term predictions based on chart patterns suggest significantly higher targets if momentum is sustained.
• Altseason Trigger: A strong ETH rally, particularly one driven by reclaiming key technical levels, could indeed trigger a wider altseason. This would see significant capital flow into other altcoins, potentially leading to a massive altcoin market cap surge if Bitcoin dominance concurrently falls.
• Market Sentiment: Overall market sentiment would turn decisively bullish, fueled by positive price action and the realization of long-awaited breakouts. Institutional interest would likely further increase.
Scenario 2: Failure at $3000 and Continued Consolidation Throughout 2025
This scenario represents the central thesis of this article – a prolonged period of sideways trading.
• The Rejection: Ethereum makes attempts to break $3000 (or even struggles to consistently hold above $2700-$2800) but is repeatedly met with strong selling pressure. The price fails to establish a sustained uptrend above these key levels.
• Trading Range: ETH would likely continue to trade within a familiar range, potentially bounded by support levels around $2,300-$2,500 and resistance capping gains below $3000. This range could persist for a significant portion of 2025.
• Investor Sentiment: Investor sentiment would likely become mixed and potentially frustrated. While long-term believers might continue to accumulate, shorter-term traders could become disengaged due to a lack of volatility and clear direction. The "wait-and-see" approach would dominate.
• Impact on Altcoins: A stagnant Ethereum could dampen enthusiasm for a broad altseason, leading to more selective and narrative-driven gains in the altcoin market rather than a widespread euphoric rally.
Scenario 3: A Bearish Breakdown
While many signals are bullish or neutral (consolidating), a bearish breakdown remains a possibility, especially if broader market conditions deteriorate or if key supports fail.
• Support Failure: Key support levels, such as $2,450, $2,300, or even the psychological $2,000 mark, are breached decisively. This could be triggered by the large supply near cost basis flipping into loss and causing a cascade of selling.
• Negative Catalysts: This scenario could be exacerbated by negative macroeconomic news, stringent regulatory actions, or unforeseen issues within the Ethereum ecosystem.
• Price Action: A bearish breakdown would see Ethereum enter a downtrend, potentially revisiting lower support levels from previous market cycles. Technical indicators like a "Death Cross" on weekly charts, if confirmed, would add to bearish sentiment.
• Market Sentiment: Fear and uncertainty would grip the market, leading to a flight to safety, possibly increasing Bitcoin dominance or a move towards stablecoins.
•
The most probable outcome will depend on a confluence of technical breakouts, fundamental developments within the Ethereum ecosystem (like the impact of future upgrades), institutional adoption trends, and the overarching macroeconomic environment.
Section 7: Conclusion
Ethereum stands at a pivotal moment in May 2025. The allure of a significant rally towards $4,000 and beyond, potentially heralding a new altseason, is palpable, supported by historical precedents and bullish chart patterns. However, the path is fraught with challenges, most notably the formidable psychological and technical resistance clustered around the $2,700 to $3,000 levels.
The current consolidation phase, while potentially a healthy accumulation period, also carries the risk of morphing into prolonged stagnation if upward momentum cannot be decisively seized. The significant volume of ETH supply hovering near its cost basis presents a tangible threat, where a dip could trigger further selling pressure, reinforcing the consolidation or even leading to a decline.
Therefore, the central thesis holds considerable weight: should Ethereum fail to convincingly breach the $3000 mark in the coming months, it is highly plausible that the cryptocurrency could remain locked in a consolidative pattern for much of 2025. This would test the patience of investors and potentially delay the much-anticipated fireworks of a full-blown altseason.
The cryptocurrency market is notoriously dynamic and influenced by a myriad of unpredictable factors. While technical analysis and on-chain data provide valuable insights, they are not infallible crystal balls. Investors and traders must remain vigilant, continuously reassessing the evolving landscape, managing risk, and preparing for various potential outcomes as Ethereum navigates this critical juncture. The battle for $3000 will likely define ETH's narrative for the remainder of the year.
