SEI : LIVE TRADEHello friends
We drew a Fibonacci to get the support area and a Fibonacci for the resistance areas.
Now using support and resistance we can understand where the buy and sell points are.
In this price growth we wait for a pullback and in case of a pullback we can enter a trade in the specified area with risk and capital management and move with it until the specified resistances which are targets.
*Trade safely with us*
Altseason

Bitcoin Dominance Elliott Wave Update: Wave ⑤ Near CompletionBTC Dominance has been unfolding in a clear 5-wave impulsive decline. Right now, price action is moving within the last leg — wave ⑤ — and has reached the 57.9% zone, which aligns with multiple confluences:
• ✅ 0.618 Fibonacci extension of wave (3)
• ✅ Bottom of the descending channel
• ✅ Strong psychological & structural support zone
This confluence suggests that wave ⑤ could be approaching its final stage of completion.
📌 Implication for Altcoins:
A local bottom in BTC dominance often translates into increased selling pressure on altcoins, as money flows back toward Bitcoin.
🎯 Key Levels to Watch:
• 57.9% → potential termination zone for wave ⑤
• 56.6% → full 1.0 extension of wave (3), deeper bearish scenario
⚠️ Invalidation:
If dominance breaks convincingly below 56.6%, the bearish extension continues, giving altcoins more room to breathe.
👉 For now, caution is advised on altcoins as BTC dominance nears completion of wave ⑤. Expect volatility and potential liquidity grabs.

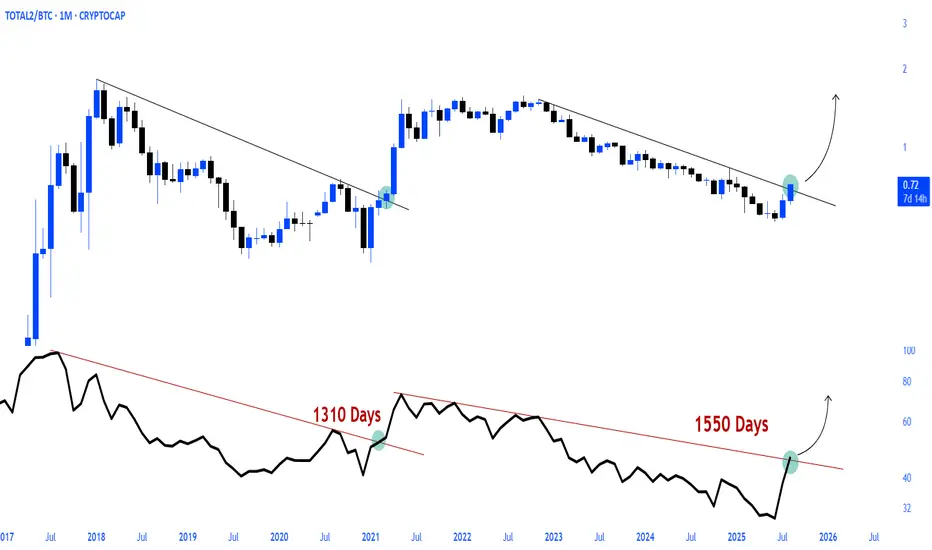
TOTAL2 / $BTCAltcoins Season Programmed.
After more than four years, a significant breakout occurred in the TOTAL2 / CRYPTOCAP:BTC pair, signaling major movements to come.
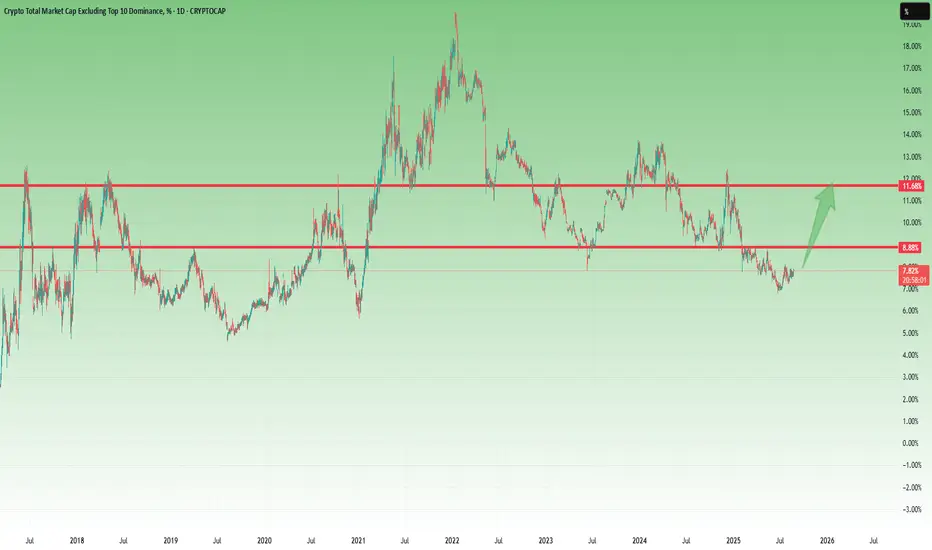
Crypto Market Cap (Others) – Ready for Breakout?When it comes to trading or investing, for sure we all want the best return possible. With both BTC and ETH at or very near ATHs, most of us are naturally looking at lower cap alts for opportunities.
For this reason, let’s analyze the chart for Crypto Market Cap excluding Top 10 and stablecoins.
Note: Although since the 2021 bottom there have literally been hundreds of thousands of new coins launched, I still consider this chart highly relevant.
The recent price action is clear:
• Since the July bottom, “Others” has shown a timid but constructive recovery.
• A higher low was confirmed at the beginning of August.
• A tight consolidation is now pressing against resistance.
On the 2H chart, this consolidation looks very promising, with pressure building for a breakout. Technically, a move above 7.88% dominance could trigger acceleration toward 8.88%, and if the optimism holds, even a medium-term extension toward 12% is possible.
📈 Trading Plan:
Look for coins in the Top 100 (excluding Top 10) that already show bullish chart structures. Combining this with the strong setup in the “Others” chart could be a solid approach to maximize returns in this phase of the market.
AVAX/USDT – Major Breakout on the Daily Timeframe!AVAX has finally broken out from its long-term descending trendline, signaling the potential start of a powerful bullish move. Let’s break down the setup:
🔎 Chart Analysis:
Pattern: Falling Wedge on the Daily timeframe.
Breakout Zone: Price has successfully closed above the resistance trendline around $25–26.
Support Zone: Strong accumulation support around $24–26
🎯 Trade Setup:
Entry Zone: $24–26 (current breakout retest levels)
Targets:
TP1: $35
TP2: $48
TP3: $60+
Stop Loss: $21 (below wedge & accumulation box)
📊 Risk/Reward:
R/R ratio: ~5:1
High conviction setup with breakout confirmation.
⚡ Key Takeaway:
If AVAX holds above the breakout zone, it could deliver a 2x–3x run in this cycle. Watch closely for volume confirmation on daily candles to strengthen the breakout signal.
🔥 Conclusion: AVAX looks primed for a strong bullish rally after months of consolidation. Accumulation zones are done — breakout traders could be rewarded big here!

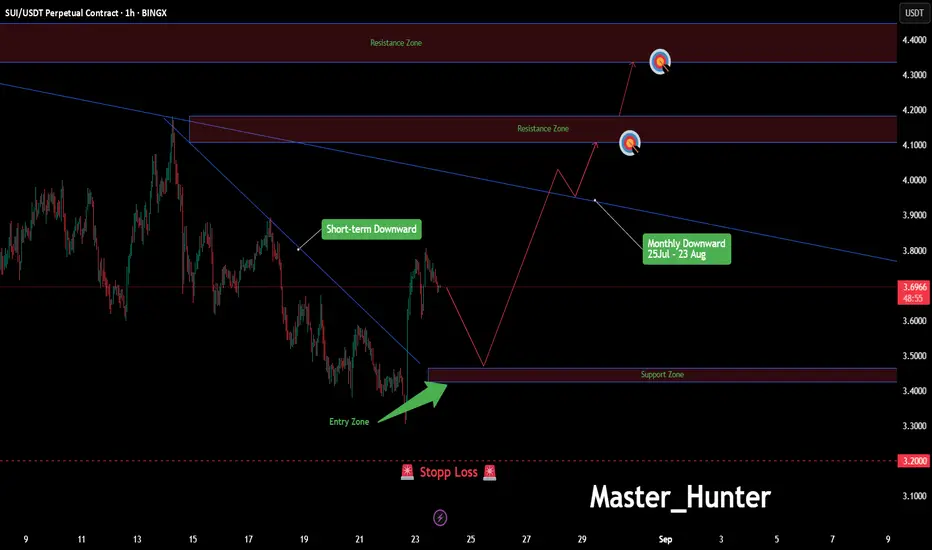
SUI/USDT: Bullish Blast to 4.44?BINGX:SUIUSDT.P is heating up on the 1-hour chart , with an entry zone between 3.465-3.425 near a key support and bullish divergence. 🎯 First target at 4.105-4.180 hits initial resistance, while the second target at 4.330-4.440 could spark a major breakout! 📈 Set a stop loss on a daily close below 3.2 to keep risk tight. 🌟 A break above 3.5 with strong volume could ignite this move, driven by market hype and altcoin momentum. Watch for confirmation candles! 💡 Ready to ride this wave? Drop your take below!
📝 Trade Plan:
✅ Entry Zone: 3.465 – 3.425 (support area + divergence)
❌ Stop Loss: Daily close below 3.20 to keep risk tight
🎯 Target 1: 4.105 – 4.180 (first resistance)
🎯 Target 2: 4.330 – 4.440 (major breakout zone)
#SUIUSDT #CryptoTrading #TechnicalAnalysis #TradingView #Altcoins #DayTrading #MarketSignals #Altseason
SOL Game Plan - Solana AltcoinSOL Game Plan
📊 Market Sentiment
Overall sentiment remains bullish, supported by expectations of a 0.25% rate cut in the upcoming FOMC meeting. A weakening USD and increasing global risk appetite are creating favorable conditions for further upside in crypto assets.
📈 Technical Analysis
Price has aggressively broken the HTF bearish downtrend and closed above it on the daily chart, indicating potential continuation to the upside.
In addition, price broke through the HTF resistance level, which is now acting as HTF support.
📌 Game Plan
I expect price to retrace back to the HTF support level at $194 and bounce from there, potentially retesting the broken HTF trendline as well.
🎯 Setup Trigger
I will monitor the 4H market structure for confirmation before initiating a position.
📋 Trade Management
Stoploss: Daily close below HTF support zone
Target: $296 (all-time high)
💬 Like, follow, and comment if you find this setup valuable!
⚠️ Disclaimer: This content is for informational and educational purposes only and does not constitute financial, investment, or trading advice. Always do your own research before making any financial decisions.

BTC Rotations Aren’t What They Used to Be — Trojan Cycle This chart uses the Trojan Cycle: Dip & Profit Hunter tool to evaluate recent BTC price action in relation to structural flow dynamics — specifically price and volume behavior through a statistical lens.
The tool is part of a broader effort to monitor the evolving nature of capital rotation in crypto — one that considers how institutional infrastructure, regulatory filters, and synthetic signals may be altering traditional cycle behavior.
🧠 What This Tool Is Designed to Do
Rather than issuing classic buy/sell signals, the tool evaluates where we are in the broader capital flow rotation by analyzing:
Z-Scores of price and volume (how far each has deviated from their historical norm)
Percentile ranks (where current values fall relative to past distributions)
Price vs. Volume momentum divergence
A contextual output based on combinations of these metrics
The aim is to offer a clearer view into whether a move is structurally supported or potentially hollow .
🔍 Live Signal Example (as shown on chart)
Metric Value
Z-Score (Price) +0.65 (mild extension)
Z-Score (Volume) -1.27 (subdued flow)
Percentile (Price) 64%
Percentile (Volume) 2% (extremely low)
Combined Context 📉 Price leading — flow lagging, be cautious
Structural Signal 🟣 No high-probability setup
🗣 Interpretation (not prediction):
While BTC has advanced in price, this configuration suggests a lack of supporting volume — at least from the perspective of the current model. In the context of a maturing, compliance-filtered market structure, these kinds of setups may align with the idea of synthetic rotations: price expansion without true structural inflow.
📘 Why This Matters
The goal isn’t to call tops or bottoms — it’s to better understand the character of a move .
This tool helps frame whether a move may represent:
📥 Accumulation
🔴 Distribution
🚨 Euphoric extension
🧨 Synthetic narrative trap
…or simply neutral structure , as in the current case.
🔎 Interested in the Thesis Behind This?
This tool is part of a broader analytical framework outlined in the Trojan Cycle and Synthetic Rotation theses.
To explore those ideas further, including full macro breakdowns and structural flow models, please visit the published charts for RWCS_LTD on TradingView.
📊 How I Use This Personally
I avoid adding risk when signals show price is leading while volume lags.
I scale in during “confluent buy” or “value + flow” setups.
I pair this with BTC.D, ETH/BTC, and TOTALES3/ETH to track relative strength and phase rotation.
💭 Final Thought
Whether this tool confirms your existing thesis — or challenges it — the intent is to help develop structure-informed judgment in a rapidly evolving market.

ROSE/USDT: 150-200% Easy Profit Potential?BINANCE:ROSEUSDT is showing strong bullish signals on the daily chart , with a potential reversal from its long-term downward trend. Key points include a higher low formation , indicating building buyer momentum , dabble bottom pattern in 1week chart , and the EMA 500 at 0.02765 acting as a dynamic support level .
The cumulative short liquidation zone suggests trapped sellers could fuel a squeeze upward. For entry, focus on the specified ranges in the chart (around 0.028), which offer optimal buy opportunities near support.
Targets aim for 150-200% gains , with stop loss below the higher low to protect capital—these ranges are ideal for precise risk management.
⚠️Note : This signal is for spot trading only . A break above resistance with volume could ignite this move.
Ready to hunt this ROSE? Share your view!
#ROSEUSDT #CryptoTrading #TechnicalAnalysis #TradingView #Altcoins #DayTrading #MarketSignals #Altseason

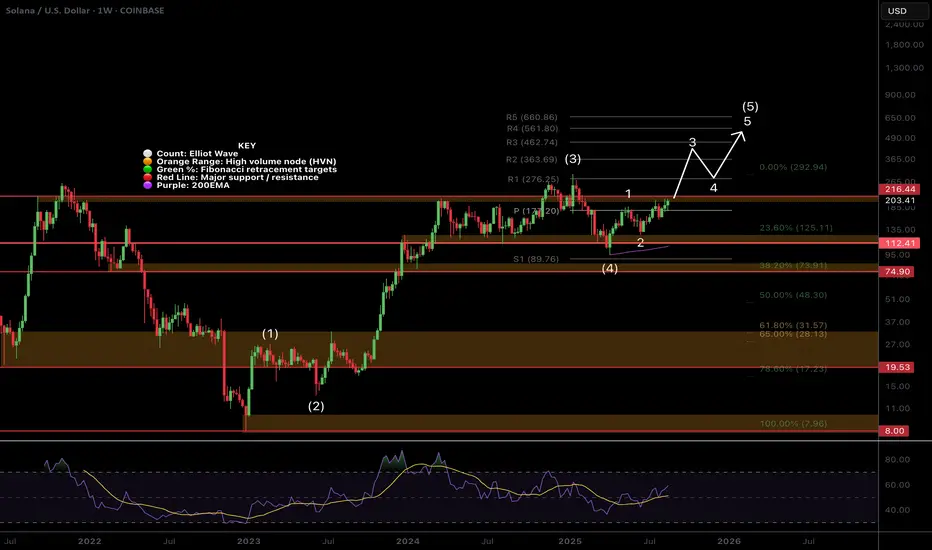
$SOL Ready for Price Discovery?CRYPTOCAP:SOL wave 3 of (5) appears to be underway but has to get through the major resistance High Volume Node at $216 and previous high first for an impulsive move.
Weekly pivot point was tested successfully as support and RSI has plenty of room to continue upwards.
Analysis is invalidated below $130.
Safe trading
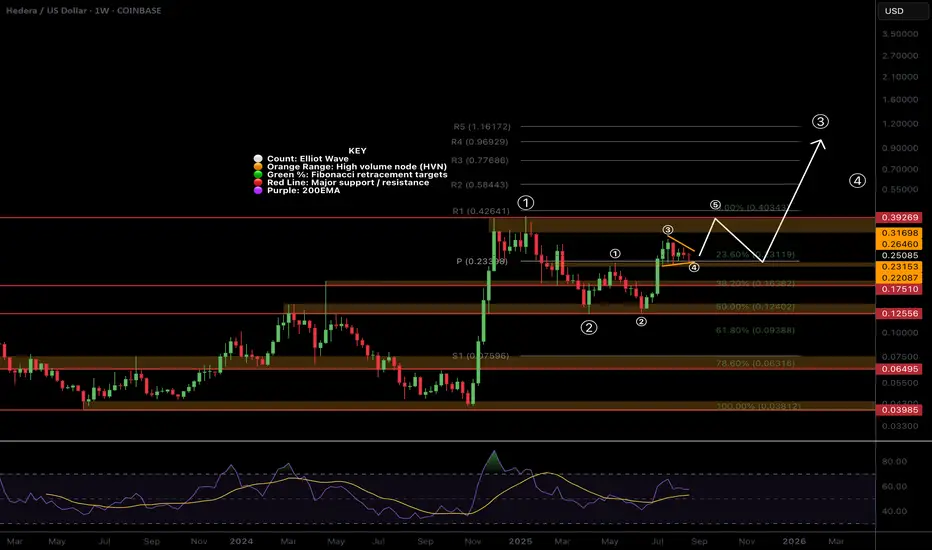
$HBAR Macro Chart - Ready for wave 5 of (1) of 3 up?CRYPTOCAP:HBAR appears to be printing a wave 4 triangle above the weekly pivot point. This implies the next move would be a terminal wave (5) of 1 of (3) likely completing with a poke above all time high to trap FOMO novice investor / traders. Classic Elliot Wave.
Wave 2 of (3) has a high probability of ending at the wave 4 triangle base which is the weekly pivot and 0.236 Fibonacci retracement adding confluence. This fib level support would indicating continued trend strength.
If it is a wave 1 of (3) is completing then we can expect the long term target to overextend the weekly R5 pivot point of $1.16, possibly reaching $3.
Weekly RSI remains at the EQ so plenty of room to grow.
Analysis is invalidated below the weekly pivot.
Safe trading
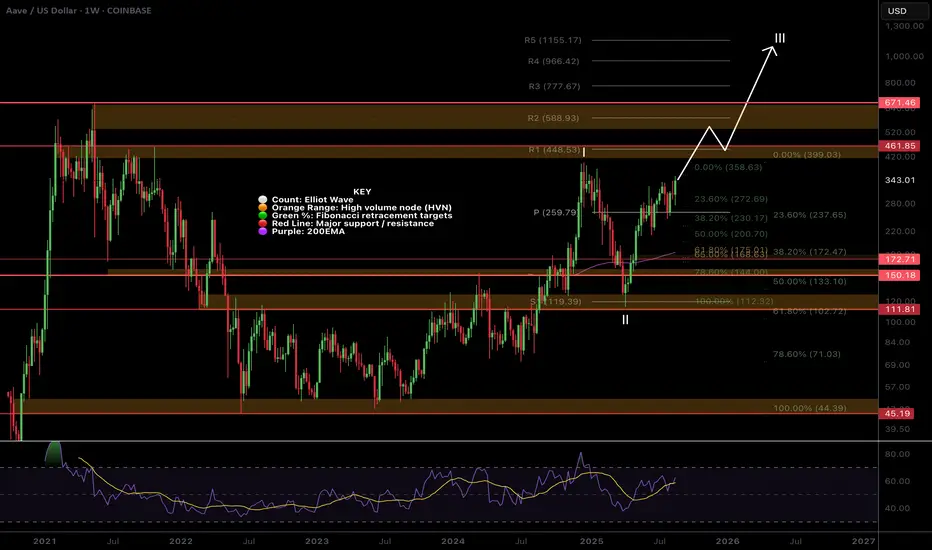
$AAVE Set for all time high?AAVE tested the weekly pivot as support and after a secondary pullback to the 0.236 Fibonacci retracement, sky rocketed alongside BTC and crypto yesterday to a new local high.
Wave III looks truly underway with this kind of price action and the target remains the R5 weekly pivot at $1155. High Volume Node resistance at $460 and $670 are the next targets.
Weekly RSI has plenty of room to grow to get to overbought.
Analysis is invalidated below $111 so plenty of room to breathe!
Safe trading
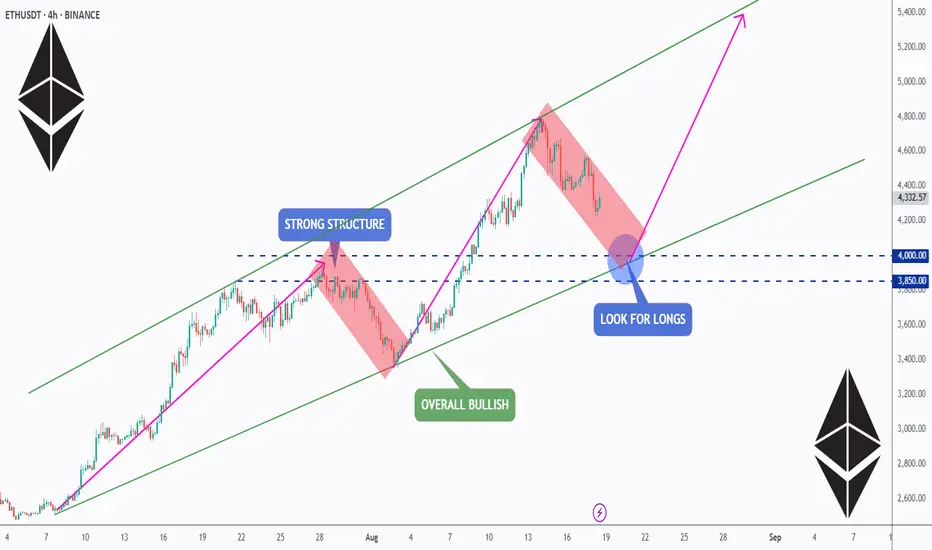
ETH Setup: Retest, Reload & Rally?ETH is pulling back after a strong run , but the bigger picture stays bullish. 📈
The $3,850–$4,000 zone is key — a solid structure + channel support. 🔑
If buyers step in here, we could see the next leg toward $5K and beyond. 🚀
Watching closely… time to retest, reload, and ride the rally? 👀
📚 Always follow your trading plan regarding entry, risk management, and trade management.
Good luck!
All Strategies Are Good; If Managed Properly!
~Richard Nasr
Mega Altcoins SeasonMega Altcoins Season ⏳
For the first time since 2021, signs of an ALTseason are literally there.
OTHERS + TOTAL2 + TOTAL3

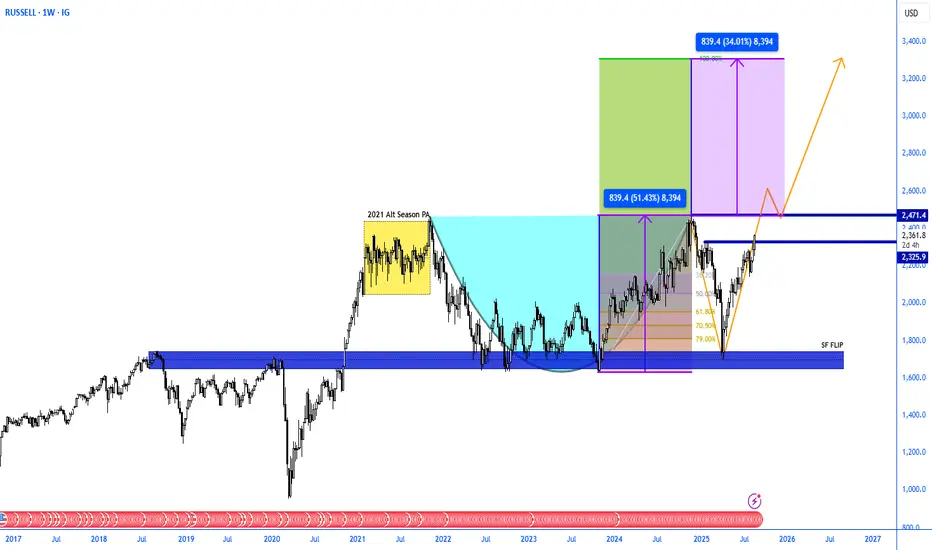
RUSSELL Generational Bullish Cup & Handle pattern Russell has created a generational sized bullish cup and handel pattern, with the crypto alt season heating up along side, i have highlighted the 2021 alt coin season to show that alts moed hundreds of percent where Russell made a strong impulsive move upwards but then consoldated, i believe this will be dwarfed on the alt coin charts with a huge breakout on Russell pending.
Target for Rusell 3300, target for alt coins Moon.
Massive ALTSEASON ahead.The Crypto Total Market Cap (excluding the Top 10) is staging a strong bounce on its 1M MA50 (blue trend-line), which as you see has been closing all 1M candles above it since November 2023!
With the multi-year pattern being a Channel Up, we are experiencing a prolonged Accumulation Phase similar to 2019. That gave rise to a Higher High on the 1.618 Fibonacci extension. This time the accumulation even takes place above the 0.5 Fib.
If the same 1.618 Fib Target is repeated, we are looking at a possible 1.63 Trillion market cap.
-------------------------------------------------------------------------------
** Please LIKE 👍, FOLLOW ✅, SHARE 🙌 and COMMENT ✍ if you enjoy this idea! Also share your ideas and charts in the comments section below! This is best way to keep it relevant, support us, keep the content here free and allow the idea to reach as many people as possible. **
-------------------------------------------------------------------------------
💸💸💸💸💸💸
👇 👇 👇 👇 👇 👇

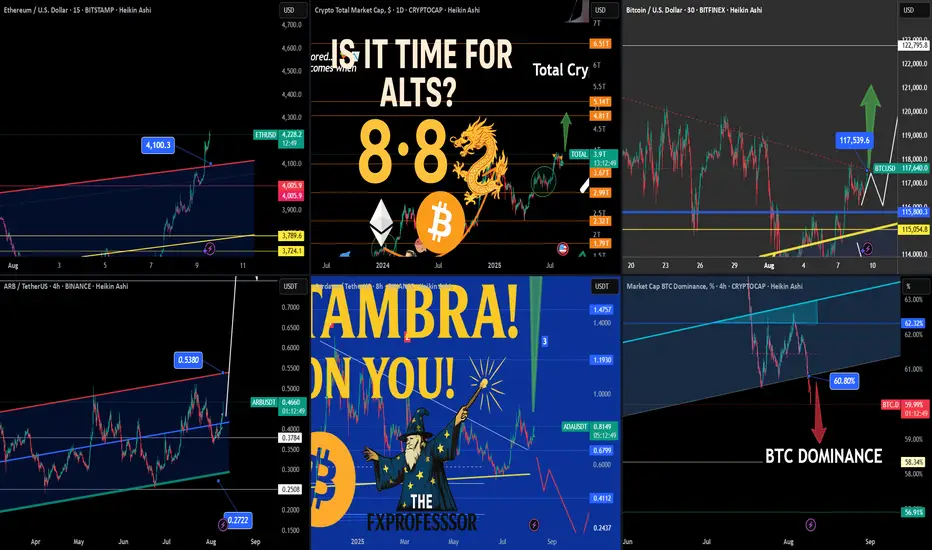
Today’s Crypto Market – From Ethereum Strength to ALTS Setup📅🔥 Today’s Crypto Market – From Ethereum Strength to ALTS Setup 🚀💡
In today’s market update video, we broke down what could be the critical handoff from Ethereum’s dominance to a broader ALT season.
The sequence is clear:
1️⃣ Bitcoin led the way.
2️⃣ Ethereum took control, smashing through $4,100.
3️⃣ Altcoins now have the setup to run, with BTC dominance breaking lower.
🎯 Key Levels from Today’s Charts:
Ethereum (ETH/USD) – $4,222 with breakout above $4,100.3; upside targets $4,420 – $4,800; supports at $4,005.9 and $3,789.6.
Bitcoin (BTC/USD) – Breaking out from wedge at $117,500; supports $115,803 & $115,054; upside potential to $120K+ and $122,795.8.
ARB/USDT – Rebound from $0.3784 aiming for $0.5380; key support $0.3500 and $0.2722.
Cardano (ADA/USDT) – At $0.8131; resistance $1.1930, then $1.4757; support $0.6799, $0.4112.
BTC Dominance – Breakdown under 60.80%, supports 58.34% & 56.91% — historically a strong trigger for ALT rallies.
📽️ Full breakdown and reasoning are in today’s video — we looked at why BTC dominance losing support is the green light for possible sector rotation, and which alts are primed.
One Love,
The FXPROFESSOR 💙
ETH Swing Long Opportunity ETH Daily Recap & Game Plan – 20.08.2025
📊 Market Sentiment
Overall sentiment remains bullish, supported by expectations of a 0.25% rate cut in the upcoming FOMC meeting. A weakening USD and increasing global risk appetite are creating favorable conditions for further upside in crypto assets.
📈 Technical Analysis
Price has been climbing in recent weeks, and we are currently in a retracement phase along with global markets (NQ and ES).
Price tapped into an untapped swing high, which is a strong zone I’m watching for reactions.
Additionally, price reached the equilibrium level of the Fibonacci (0.5), which places it in discount territory for me.
📌 Setup Trigger
The setup has already been triggered for me.
A 1H demand zone formed right after the EQ level was tested, so I entered the trade.
📋 Trade Management
Stoploss: 4035$
Targets:
TP1: 4279$
TP2: 4672$
TP3: 4888$ (ATH)
💬 Like, follow, and comment if you find this setup valuable!
⚠️ Disclaimer: This content is for informational and educational purposes only and does not constitute financial, investment, or trading advice. Always do your own research before making any financial decisions.

Ethereum held key level ┆ HolderStatOKX:ETHUSDT is retesting the $4000 breakout level after a 14% pullback. With strong bullish structure and flag formations in the past, this level acts as key support. If it holds, ETH could aim for $4780 next, with $5000 as the larger target.

Altseason Loading?Hello, Traders!
You know, crypto has its own seasons. Just like spring brings blossoms and winter brings snow, markets sometimes shift from BTC Dominance into what we call altcoin season, or, if you’re in a hurry, altseason. It’s the phase when altcoins, from big names like ETH to more adventurous projects, start outperforming Bitcoin in terms of returns. But before we all start dreaming of endless green candles, let’s remember: no single chart or altseason indicator can tell the whole story on its own.
What Is Altseason, Really?
At its core, alt coin season is about comparison. BTC remains the benchmark, but when altcoins start delivering stronger percentage gains, traders call it an altseason. The altcoin season index, a popular tool, checks whether at least 75% of the top altcoins are outperforming BTC over the last 90 days. If they are, the meter swings toward “yes, it’s altseason.”
The chart you see above shows the Bitcoin Dominance Index (BTC.D), one of the cornerstones behind the altcoin season index. When Bitcoin dominance is high, it means BTC is absorbing most of the market’s attention and capital. But when dominance starts to fall, that capital often rotates into altcoins, fueling what many call an altseason. This is why the altcoin season indicator doesn’t live in isolation: it leans on the shifts in BTC dominance to determine whether the market is favoring altcoins over Bitcoin.
Sounds simple, right? But here’s the restriction: the altseason index isn’t a fortune-teller. It’s more like a scoreboard that tells us how things have been going recently, not necessarily what’s coming next. And just to underline it, this indicator always needs to be paired with others, never used in isolation.
How the Altseason Chart Looks
The altcoin season chart is a visual snapshot of this dynamic. When it spikes, it suggests altcoins are collectively outperforming Bitcoin. During true alt season crypto, you’ll often see Ethereum gaining faster than BTC, smaller-cap tokens doubling, and market sentiment turning euphoric.
But these surges rarely last forever. As quickly as altseason arrives, it can fade. Bitcoin dominance tends to rise again, pulling attention and liquidity back. That’s why most analysts treat the altcoin season chart as part of a bigger puzzle, not a stand-alone answer. Once again, let’s stress it: the altseason indicator must be read in combination with other metrics like BTC.D or ETH/BTC ratios.
Why Altseason Feels Important
For newcomers, altseason is exciting because it looks like the best chance to multiply gains quickly. The 2017 rally made household names out of projects that otherwise might have stayed niche. The 2021 altcoin season chart looked like fireworks, with ETH and even DOGE stealing headlines. Still, it’s dangerous to treat the altcoin season index as a golden ticket. Some tokens rise with the tide, but many sink just as quickly.
The Bigger Picture
So, is it altcoin season right now? The truth is, the altseason index offers a glimpse, the altcoin season chart provides context, and the altseason indicator adds structure. But none of them are designed to function solo. They’re like instruments in an orchestra. Together, they make sense, but alone, they’re just noise.
Right now, the market is in a balancing act. Bitcoin’s dominance has weakened, but it hasn’t collapsed. That leaves us in a classic “altseason loading…” phase, where traders debate whether we’re at the doorstep of a new alt coin season or just witnessing a temporary shake-up.
Whether you call it altcoin season, alt season, or just plain altseason, the lesson is the same: indicators are tools, not prophecies. They shine brightest when combined, never when isolated.

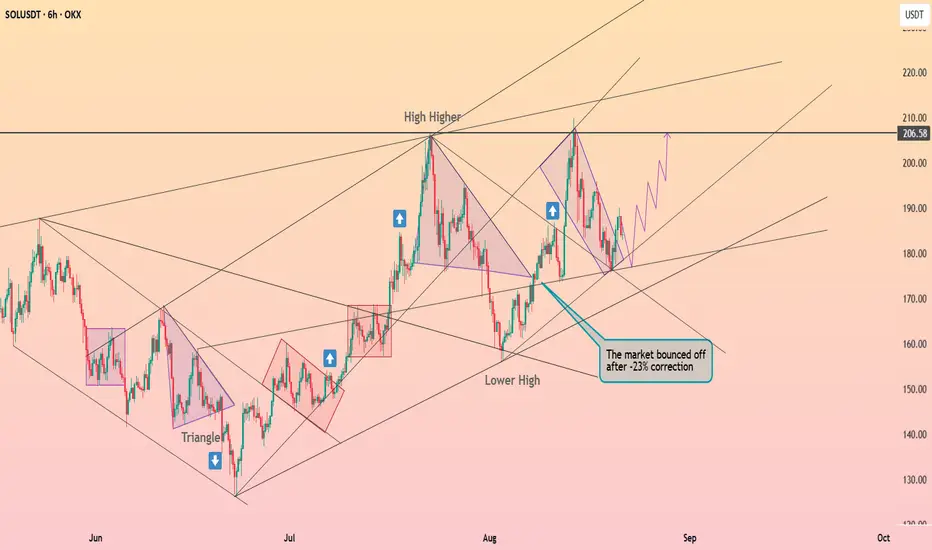
Solana exited the descending wedge ┆ HolderStatOKX:SOLUSDT has recovered quickly from a -23% correction, holding structure with higher highs and resilient rebounds. The market is now preparing for a retest of $206.58 resistance, and a breakout could fuel another push higher toward $220+.
Hyperliquid held above the $40 ┆ HolderStatKUCOIN:HYPEUSDT on the 4h chart is showing resilience as the market holds above the $40 level. The chart highlights a sequence of triangles, falling channels, and a recent rising channel, with price now testing the $47 resistance zone. A sustained break above this level would signal further bullish continuation, potentially reaching $50–52. The pattern suggests repeated rebounds from support with buyers steadily regaining control. As long as the price stays above $40, momentum favors the bulls, with accumulation zones indicating the potential for the next upward wave.

Others: Now or Never- As always, the chart tells the full story (Trend, Fibonnacci and Elliot Waves).
Historically, OTHERS.D (altcoin dominance) has had big swings depending on market cycles:
- During altcoin seasons (e.g. 2017, 2021), it has surged strongly as capital rotated from BTC and ETH into mid-cap and small-cap coins.
- Macro Cycle : if Bitcoin finishes its post-halving run (2025–2026), then money often rotates into altcoins, pushing OTHERS.D higher.
- Historical levels: OTHERS.D peaked near 20% in 2021. So 27% is ambitious but not impossible if altcoin adoption accelerates.
Remember, I only provide technical analysis and assumptions, fundamentals can shift everything at any moment, whether through governments, wars, unforeseen events, or even something as wild as an asteroid or alien invasion.
Happy Tr4Ding !
