ETH: LIVE TRADEHello friends🙌
✅Given the good rise we had, we had a small correction that was a buying opportunity and there is another support area where we can buy the second step in case of further correction.
We have also specified targets for you, be careful and do not act emotionally and observe capital and risk management.
🔥Follow us for more signals🔥
*Trade safely with us*
Altseason

ALT SZNThe altseason is starting. I expect a small pullback, followed by an altcoin rally that will last until mid-2026.
ETH Daily Recap & Game Plan – 15.08.2025ETH Daily Recap & Game Plan – 15.08.2025
📊 Market Sentiment
Overall sentiment remains bullish, supported by expectations of a 0.25% rate cut in the upcoming FOMC meeting. A weakening USD and increasing global risk appetite are creating favorable conditions for further upside in crypto assets.
Ethereum is approaching all-time highs, fueled by a $1B single-day ETF inflow. Additionally, rumors of potential SEC approval for Ethereum staking policy could directly boost ETH’s utility — strengthening the long bias.
📈 Technical Analysis
Price has started a retracement move after Bitcoin reached new all-time highs.
Currently, ETH is testing the daily demand zone (blue box) — a level where we may see a reaction. For confirmation, I want to see a 4H break of structure before initiating any trades.
Since it’s the weekend, I expect some choppy price action and possibly a deeper retracement. I’m watching two potential scenarios (Blue vs. Red).
📌 Game Plan
Scenario 1 (Blue)
→ Price sweeps 4H swing liquidity at 4255$, then rejects.
Scenario 2 (Red)
→ Price dips deeper, tapping the untested swing high at 4112$ and possibly into the equilibrium discount zone (0.5 Fibonacci), before rejecting.
🎯 Setup Trigger
Waiting for a 4H break of structure before entering any position.
📋 Trade Management
Stoploss: 4H swing low confirming the BOS
Target: Run directly toward all-time highs at 4867$
💬 Like, follow, and comment if you find this setup valuable!
Disclaimer: This content is for informational and educational purposes only and does not constitute financial, investment, or trading advice. Always do your own research before making any financial decisions.

ETH Long Idea - Daily Recap - 14.08.2025📊 Market Sentiment
Overall sentiment remains bullish, supported by expectations of a 0.25% rate cut in the upcoming FOMC meeting. A weakening USD and increasing global risk appetite are creating favorable conditions for further upside in crypto assets.
Ethereum is approaching all-time highs, fueled by a $1B single-day ETF inflow. Additionally, rumors of potential SEC approval for Ethereum staking policy could directly boost ETH’s utility — strengthening the long bias.
📈 Technical Analysis
Price has pulled back to the daily fair value gap. HTF fair value gaps are historically strong zones for potential bounces.
📌 Game Plan
I expect possible expansion toward all-time highs here, as we have broken the LTF market structure.
📋 Trade Management
Entry: 4602$
SL: 4455$
TP: All-time highs at 4867$
💬 Like, follow, and comment if you find this setup valuable!
Disclaimer: This content is for informational and educational purposes only and does not constitute financial, investment, or trading advice. Always do your own research before making any financial decisions.

Will $ETH remain bullish below $4,000?Ethereum hasn’t yet broken above its previous ATH.
The colorful lines you see are mostly Fibonacci retracement & extension levels, tools traders use to identify potential support and resistance zones.
• Support: a level where price might stop falling and bounce (e.g., $4,141, blue line).
• Resistance: a level where price might struggle to go higher (e.g., $4,728 and $4,781, red lines).
The RSI (Relative Strength Index) shows market momentum:
• Above 70 = overbought (possible pullback).
• Below 30 = oversold (possible bounce).
Currently, RSI is at 25.82, indicating oversold conditions, which could lead to a bounce, though oversold doesn’t guarantee an immediate reversal.

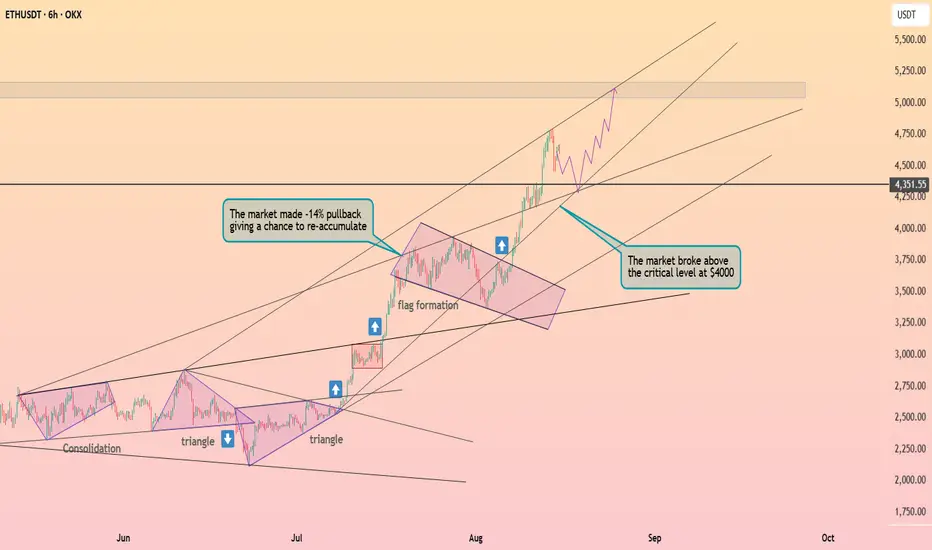
Ethereum above the $4300 level ┆ HolderStatOKX:ETHUSDT broke above the $4,000 mark after a healthy -14% pullback, signaling continuation toward $5,000–$5,200. Support at $4,000 remains the key level for bulls.
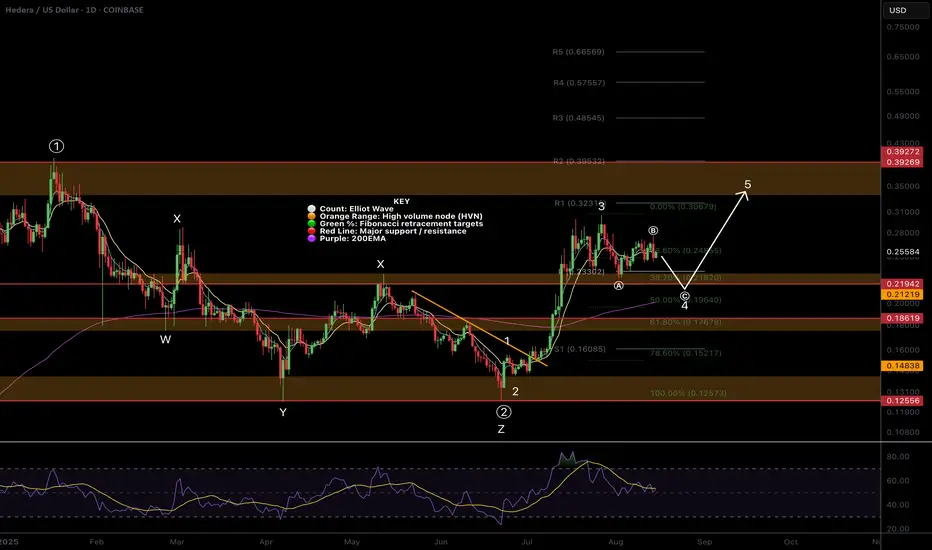
$HBAR Printing an ABC in wave 4?Wave C of an ABC correction in wave 4 appears to be underway in CRYPTOCAP:HBAR
This would see price have a quick drop below the daily pivot testing the major support High Volume Node and rising daily 200EMA as support before continuing up in wave 5. This is also the .382-.5 Fibonacci retracement a typical area for wave 4 to end per Elliot wave rules. Lots of confluence in this area.
RSI is still making its way down from overbought. Investor psychology is still irrationally bullish giving opportunity for professional traders to make some volatility bucks.
Analysis is invalidated if price breaks $0.273 upgrading the count to wave 4 completing at the current wave (a) bottom.
Safe trading
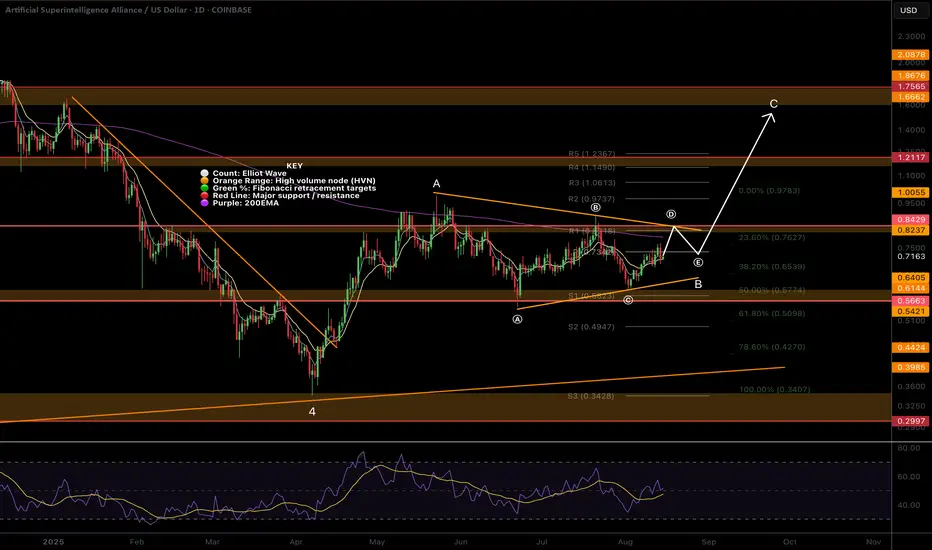
$FET Elliot Wave Updated, Triangle forming?NYSE:FET appears to be printing a triangle in a larger degree wave B of an ABC counter-bear trend correction.
Wave (D) is expected to finish at the descending resistance, poking above the daily 200EMA, while wave (e) is often shallow so expected to end at the daily pivot point. The target is $1.6 at he triangle pattern depth and major High Volume Node resistance.
An ABC corrective wave does not mean that the macro count is invalidated and may form part of larger ending diagonal series of ABCs to achieve my high degree wave 5 targets above all time high. I will update the weekly chart to reflect this shortly.
Safe trading
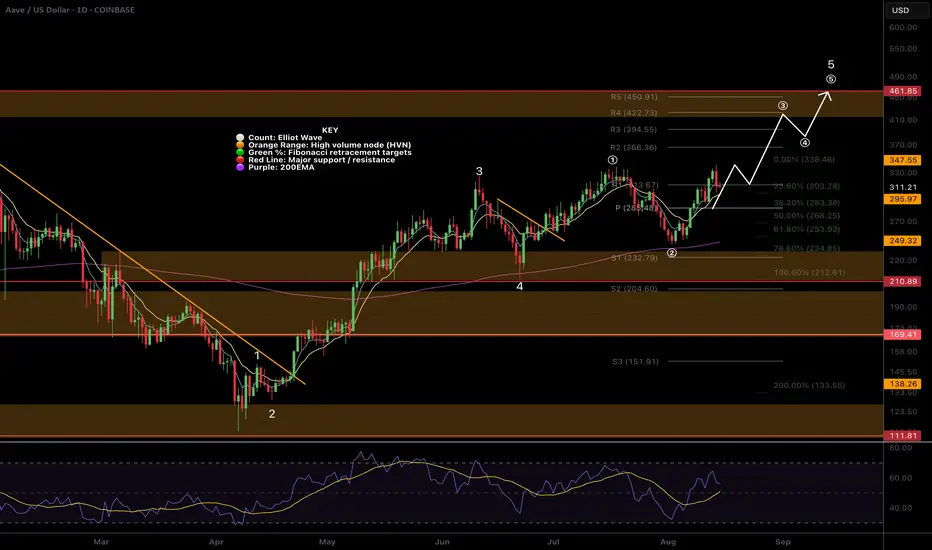
$AAVE Continues to follow the path!CRYPTOCAP:AAVE was immediately reject from the swing high as expected, per the percentage band take profit rules.
Daily RSI has plenty of room to grow to reach the all time High Volume Node resistance which is the next target at $430.
Based on the depth of wave (2) after touching the daily 200EMA as support, wave 3 is still underway to complete the larger degree wave 5 with a poke above all high, the highest probability terminal target per Elliot wave rules.
Safe trading
For those interested in trading signals / diary & trade management / trading parameters etc... Signals updated for 15/08/25
✅ LSE:ONDO DEMA Percentage Band rule added
✅ CRYPTOCAP:BTC hit take profit #2 for 2.59RR
✅ CRYPTOCAP:AAVE (DEMA) HIt take profit 1 for 1.45RR
✅ CRYPTOCAP:ADA moved 10% after signal activation but still not hit take profit 1
✅ NASDAQ:AAPL (Apple) very close to take profit #1
✅ BTC added to completed trade signals along side Take profit 2 for google, 700, HBAR and a few stop (INJ, SOL, BTDR) and invalidations for META, SHIBINU, WLD)
Safe trading
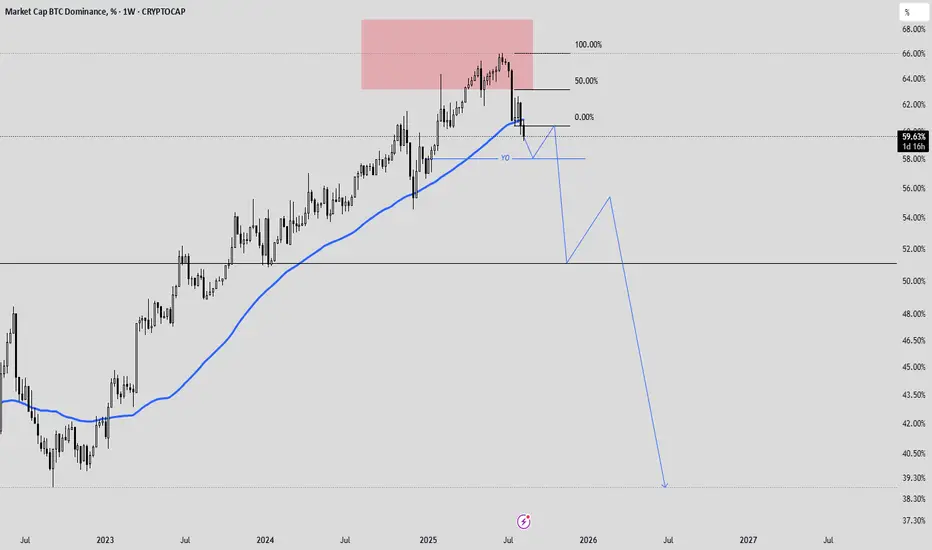
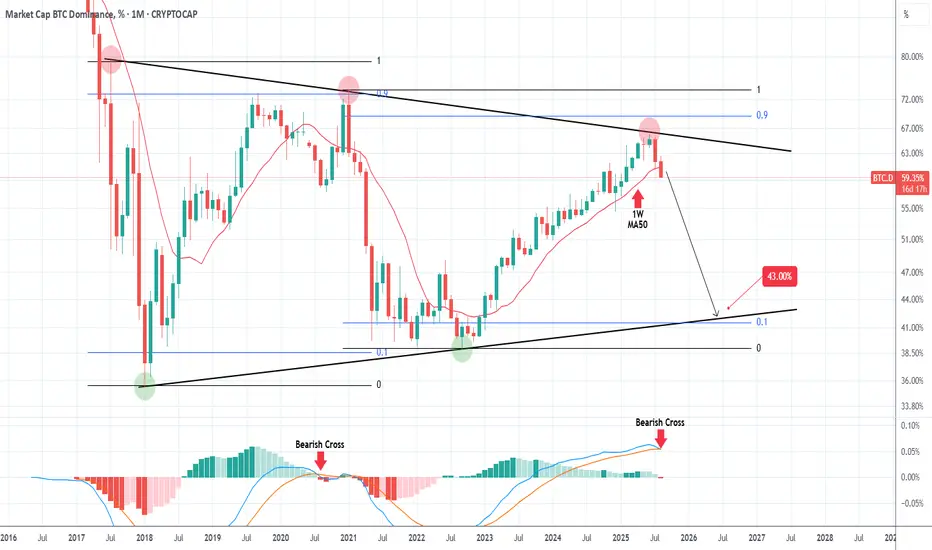
ALTSEASON has already started!The BTC Market Cap Dominance (BTC.D) has made an emphatic rejection at the top (Lower Highs trend-line) of the 8-year Triangle and if it closes the 1M candle of August below the 1W MA50 (red trend-line), it will largely confirm the new Bearish Leg.
With the 1M LMACD about to complete its first Bearish Cross in more than 4 years, it is more probable to see this strong and lengthy downtrend target the bottom (Higher Lows trend-line) of the Triangle near the 0.1 Fibonacci level, similar to the previous one.
The Target is 43.00%.
-------------------------------------------------------------------------------
** Please LIKE 👍, FOLLOW ✅, SHARE 🙌 and COMMENT ✍ if you enjoy this idea! Also share your ideas and charts in the comments section below! This is best way to keep it relevant, support us, keep the content here free and allow the idea to reach as many people as possible. **
-------------------------------------------------------------------------------
💸💸💸💸💸💸
👇 👇 👇 👇 👇 👇
The Trojan Cycle: A New Framework for Altseasons & Liquidity🧭 A Thesis for a New Crypto Cycle
This post proposes a new lens for understanding crypto’s macro structure in the institutional era—rooted in two frameworks: The Trojan Cycle and Synthetic Rotation .
It challenges the legacy “ M2 = liquidity, BTC = lead, alts = profit ” model, proposing a more engineered and asymmetric structure shaped by capital rails, narrative timing, and retail dynamics.
📖 Key Concepts
🔹 Trojan Cycle
A macro capital flow model where:
• BTC still triggers narrative momentum—but no longer drives liquidity alone
• Institutional capital enters via regulated wrappers like ETFs and through equities with crypto treasuries (e.g., MSTR, miners, COIN)
• Stablecoins replace M2 as real-time liquidity proxies
• Retail unknowingly front-runs these flows
🛠 Trojan access isn’t just through ETFs—it includes public stocks holding crypto on balance sheets. These Trojan equities serve as indirect exposure rails that institutions use stealthily.
🔹 Synthetic Rotation
Altseasons today are not spontaneous BTC profit spillovers. They are:
• Platform-driven
• Narrative-coordinated
• Liquidity-engineered
• Retail-targeted—by design, not coincidence
🛠 Media, influencers, and platform incentives synchronize narrative deployment to align with capital rotation windows, driving retail engagement at peak distribution phases.
🔹 ETH as a Structural Fulcrum
Ethereum isn’t just a top asset—it’s the bridge:
• Serves as a midpoint for capital between BTC and high-beta alts
• TOTAL3ES/ETH ratio reveals directional bias in rotation structure
🛠 ETH is a liquidity buffer and rotational fulcrum—not just a layer-1 narrative asset.
🔹 Structural Liquidity Fragmentation
Institutional and retail flows now move on different rails, timelines, and tools:
• Retail is incentivized through volatility and engagement
• Institutions scale in/out passively, through wrappers and proxies
🛠 These cycles don’t just desync by chance—they’re structurally misaligned. This is why retail often exits late and enters at narrative highs.
📊 Visual Framework
Using the Crypto Macro Cockpit script:
• Spread and slope = flow direction and acceleration
• Stablecoin cap = capital injection
• Stablecoin dominance = risk appetite
• TOTAL3ES/ETH = alt rotation pressure
• Composite regime classification = macro posture (Risk-ON/OFF, Caution, Waiting)
📎 Why It Matters
Understanding engineered cycles vs organic flows is key to staying ahead.
Legacy cycle models no longer apply.
New frameworks are needed to decode capital movement, timing asymmetries, and narrative deployment.
💬 This isn’t a prediction—it’s a proposed mental model for discussion.
Would love to hear your thoughts—how are you navigating the new cycle?
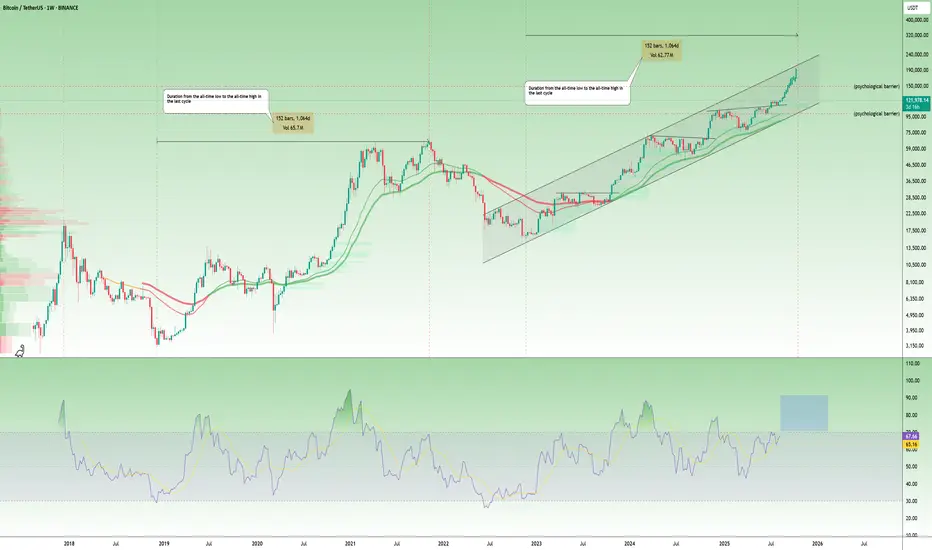
$BTC is repeating history, and it’s doing it with precision.CRYPTOCAP:BTC is repeating history, and it’s doing it with precision. 📈
In the last cycle, it took Bitcoin 1,044 days to move from the bear market bottom to a new all-time high. This cycle is on the same timeline, and we’re now well into that phase.
Price is staying inside the long-term rising channel, and momentum is building. If this continues, a macro top could form between late October and early November, maybe even by the first week of October if the rally speeds up.
The RSI is also climbing toward the same overbought levels seen before past tops. The cycle pattern isn’t random.
It’s the guide.
Solana Summer Kick-Start Lunar MissionCRYPTOCAP:SOL IS REPRICING.
Gimme a Weekly Close above this POI and it’s gonna rip your mother’s face off.
Bullish Engulfing Candle kicked off the 3D run with a close above the 50% Gann.
Riding well above the DMA9.
RSI has plenty of gas left in the tank.
You've been warned.

$BTC Macrolast idea remains intact—we are still bullish. Alts have held strong while BTC plunged. (I don’t own any BTC, and neither should you above $100K.)
I predicted the exact $15.5K bottom on X, as well as the August 5th crash and bottom. Unfortunately, I wasn’t on the charts in December and missed the biggest, clearest signal on USDT.D for a potential local top, which otherwise would have 2x'd my current portfolio but mistakes were made)
BTC taking the hits while alts hold steady is a strong sign that whales are taking profits from Bitcoin and preparing for "rotation".
Most traders believe the cycle is over—and there are valid reasons for that (some of them are):
- A monthly bearish engulfing candle
- A structure resembling the 2021 top, suggesting one last rally before the bear market
- Worst of all, double bearish divergence on the monthly, which worries me too
However, there are strong counterarguments.
The biggest? The cycle has never topped with BTC.D this weak. That’s why I’m still leaning toward a bullish scenario until proven otherwise.
Update on the above chart:
The parabola is intact with a beautiful reaction. That doesn’t mean we can’t still visit the red box—there’s only air between them—but I’m holding, and that remains my primary scenario.
Alts can make new lows, but RR isn’t worth it. As I’ve said before, the time to sell spot bags has passed. You don’t sell in between unless invalidation occurs.
Timing is everything. We failed to time this market, assuming it would mimic past cycles—but everyone was wrong. Traders won this cycle, while investors (except BTC holders) struggled... until now, at least.
ONLY DIFFERENCE BETWEEN BOTH SCENARIOS (MENTIONED ON CHART) FOR ALTS?
You have to wait way longer on the second scenario but both would take us to our goal.
Worst case? We break and HTF close on USDT.D - last hope, officially ending bull market!

TICK... TOCK... ALTSEASONTICK... TOCK... ALTSEASON
OTHERS + TOTAL2 + TOTAL3 \ ALTCOINS
1380-day major resistance breakout!

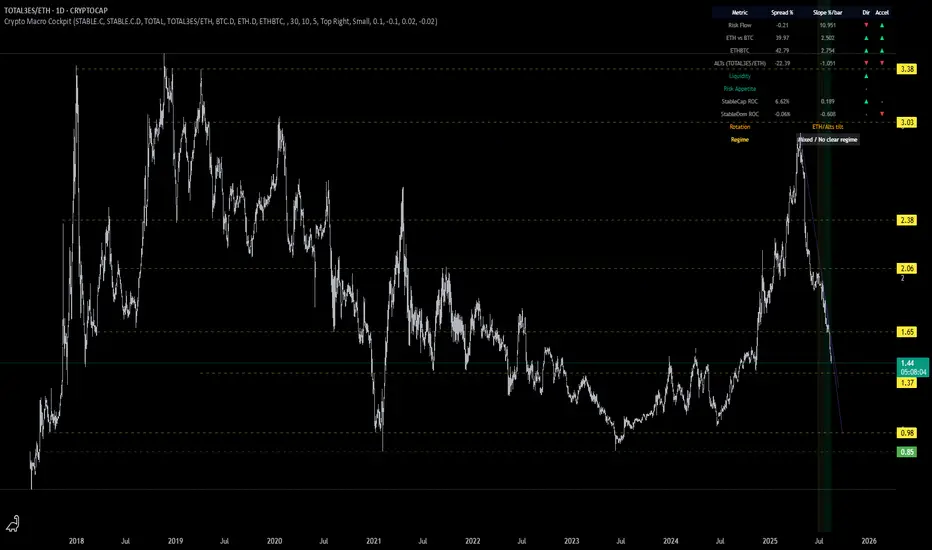
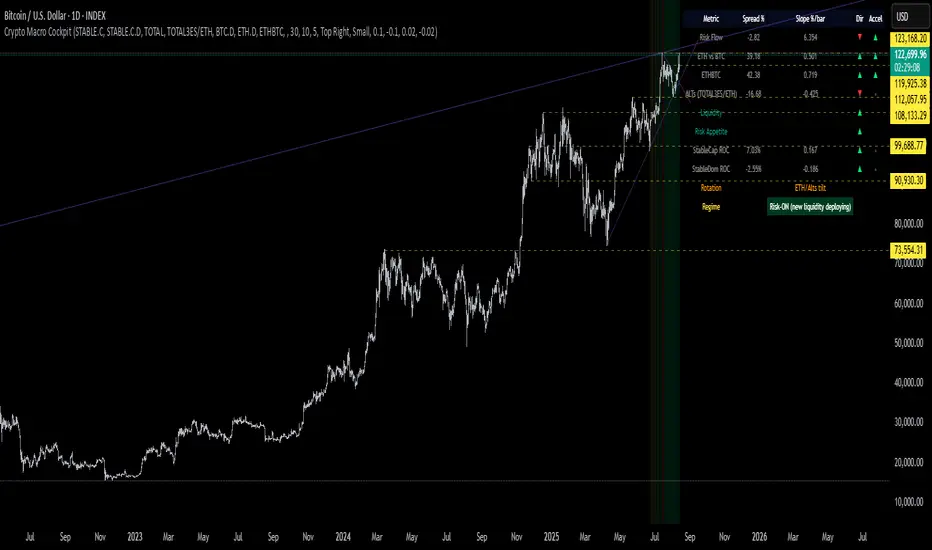
Crypto Macro Cockpit: Risk-ON Regime ConfirmedThis chart presents a live macro overlay for crypto markets using the new Crypto Macro Cockpit, a Pine Script-based dashboard that blends traditional flow metrics with institutional-era proxies.
We're currently reading a Risk-ON regime as fresh liquidity deploys into the system—confirmed across stablecoin metrics and sector rotation.
🔍 Key Insights
Risk Flow: Stablecoin cap is rising slower than total market cap → suggests active deployment (Risk-ON)
Liquidity Context: StableCap ROC at +7%, confirming real dry powder growth
Rotation: ETH vs BTC and ETHBTC both accelerating upward → ETH/Alts tilt
TOTAL3ES/ETH ratio: Softening short-term → confirms engineered altseason with ETH as the core liquidity channel
Macro Regime: Risk-ON (new liquidity deploying)
🧠 Thesis
This aligns with the Trojan Cycle thesis:
Institutional liquidity enters through safe, regulated channels (e.g. stablecoins), while synthetic altseasons are engineered to engage and extract liquidity from retail participants.
Legacy macro tools like M2 are no longer as effective. In today’s structure, stablecoin metrics offer real-time, blockchain-native liquidity signals.
- Stablecoin Market Cap reflects actual capital inflow (dry powder entering)
- Stablecoin Dominance proxies sentiment: declining = risk-on, rising = risk-off
- Their spread vs Total Market Cap reveals whether capital is being deployed or parked
As institutions and ETFs reshape market dynamics, this cockpit adapts.
M2 is out. Stablecoins are in.
⚠️ Disclaimer
This is not financial advice.
This script and dashboard are informational tools meant to support macro-level context and regime awareness—not trade signals.
Always do your own research.
XVG/USDT LONG SET-UPBINANCE:XVGUSDT
Waiting for a small retracement
FVG = Buying Area
keep an eye , spot buy only

DYDX LONG SET-UPBINANCE:DYDXUSDT
dydx Looking Bullish , waiting for a small retracement
expecting 40-50% Upside Rally
spot buy only

FET/USDT LONG SET-UPBINANCE:FETUSDT
FET/USDT Long Set-up 🟢
Entry - 0.702
Avg - 0.680
SL - 0.637
Target - 0.850 , 0.95++
Lev & margin as per your risk capacity

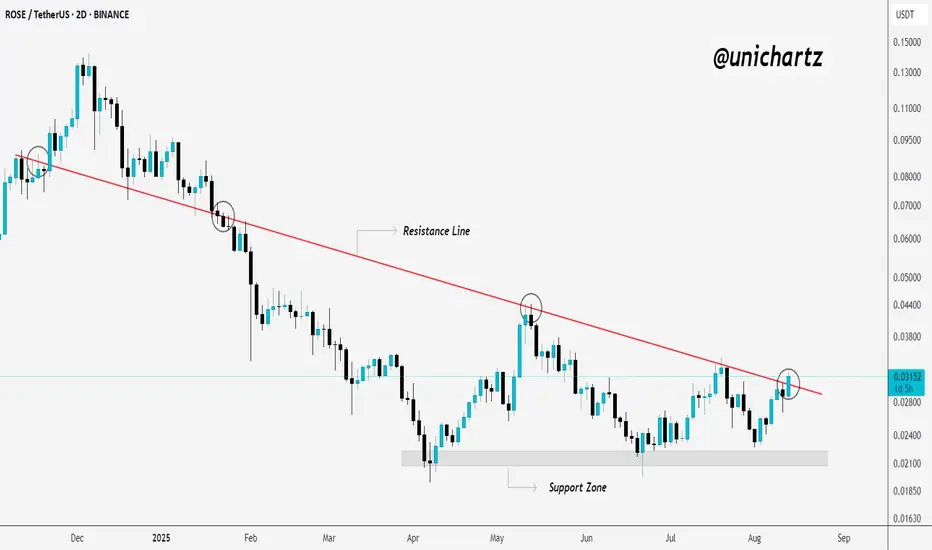
Triple Bottom Power – ROSE Eyes Explosive Upside!$ROSE/USDT has formed a triple bottom pattern, signaling strong buying interest at the support zone. Price is now testing the key descending resistance line.
If it manages to close decisively above this level, we could see a strong upside move.
Until then, keep it on your watchlist and monitor closely for a breakout confirmation.
DYOR, NFA

TONCOIN could move 60% from here the key levels to watchCRYPTOCAP:TON is holding above a strong support zone at $2.40–$2.70, showing buyers are defending this level well.
Price is moving higher without facing major resistance immediately ahead.
If momentum continues, it could aim for the $5.00–$5.50 zone next, while a drop below $2.40 would weaken the bullish outlook.
DYOR, NFA

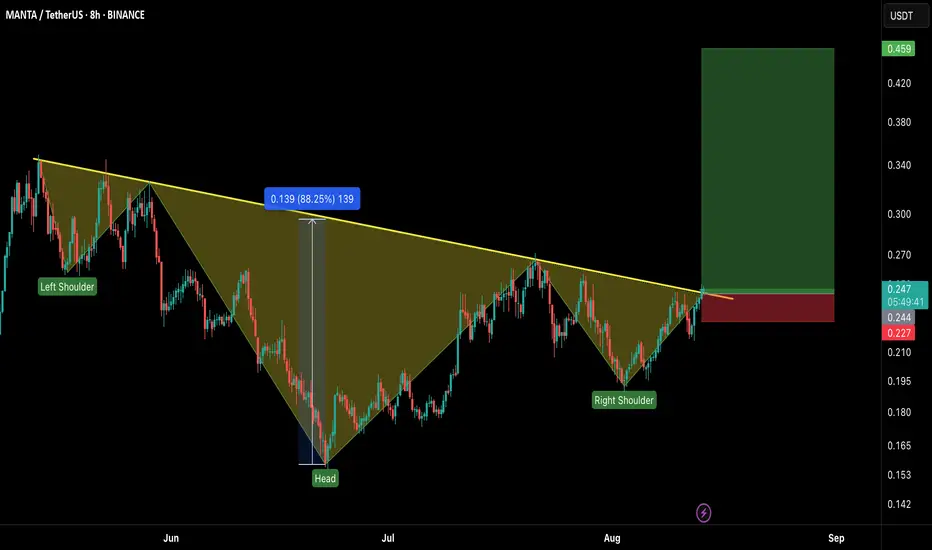
MANTA/USDT – Long Setup Alert!MANTA has just broken out of a massive Inverse Head & Shoulders pattern on the 8H chart — a bullish reversal signal that could ignite a strong upside rally. 📈
Setup Details:
Entry: CMP – 0.248
Stop Loss: 0.227 (below neckline retest)
Targets:
🎯 TP1: 0.34
🎯 TP2: 0.42
🎯 TP3: 0.459
Leverage: 5x max (adjust risk accordingly)
Why This Setup?
✅ Clean breakout above neckline after weeks of consolidation
✅ Volume supporting the breakout
✅ Pattern target aligns with strong resistance zone above
⚠️ Risk Management: Stick to your SL. A failed retest can trap late entries.
Bulls are in control — let’s ride this momentum!