Altseason

$OTHERS and altcoin mcap is hitting resistance zoneCRYPTOCAP:OTHERS is reaching a multi-year resistance zone.
From here, two scenarios are possible:
1️⃣ It breaks through and flips the zone into support, or
2️⃣ It gets rejected.
🔎 1H Time Frame
Price is touching the multi-year red resistance line — a key level to watch.
- Stochastic RSI is high, suggesting a possible short-term cooldown.
- However, the local structure remains bullish, showing a clear uptrend with periods of consolidation.
📆 1D Time Frame
- The trend boxes indicate that the broader, higher-timeframe trend is still bearish.
- We still have 2–3 days of Stochastic RSI uptrend, followed by about a week of downtrend.
📈 Summary
We’re seeing a bullish reaction in the short term (1H),
but the macro / higher timeframe (1D) trend remains bearish.
If I were looking for a long-term entry, I would personally wait until the 1D Stochastic RSI resets to the bottom, but in the current macro environment anything can happen — news and liquidity shocks can override technicals.
⚠️ DYOR and trade carefully.

TIA - BULLISH SETUP ONGOINGLSE:TIA - Update:
Same view share few days ago 📈
As anticipated; the 0.600$ is acting as a long term bottom.
The plan is the same - 0.780 - 0.800$ likely next 🎯
#tia #trading

COAI - ACCUMULATION PHASE BEFORE MOONSHOT ?GM legends!
$COAI made a +30% move yesterday! 🔥✅
Hope you booked your gains because this volatility is crazy on both side and the current price is back at the main accumulation area (same point) around 0.540 - 0.550$
I expect to see a similar move if price keep consolidating. Long term bottom could be in as long as LL isn't break! 📈

Solana: Is the Bottom In, or More Downside Ahead? SOL has already climbed more than 15% from last Friday’s low at its peak, potentially signaling the completion of wave ii in orange. For now, however, we’re still keeping open the possibility that this move could dip to a new low—within our green Target Zone ($155.80–$113.20). In any case, once this interim correction wraps up, wave iii in orange should kick off an impulsive rally, only losing steam above resistance at $295.31.

TURBO/USDT : SELLHello friends
Given the good pump we had, this currency was unable to stabilize the price above the specified resistance, which means that buyers were unable to decisively break the resistance and when this happens, the price can correct.
This analysis is purely from a technical perspective and is not a buy or sell recommendation.
*Trade safely with us*

PEPE/USDT : BUY LIMITHello friends
Well, you can see that after the price fell, it was able to rise by buyers. Now we have an important area where this resistance needs to be broken for the trend to change and the price to rise.
This analysis is purely technically reviewed and is not a buy or sell recommendation, so avoid emotional behavior.
*Trade safely with us*

PEPE/USDT : LIVE TRDEHello friends
Given the growth we had, the price has now formed lower floors and ceilings, which we have identified as sellers most likely pushing the price down.
Observe risk and capital management and avoid emotional behavior.
*Trade safely with us*

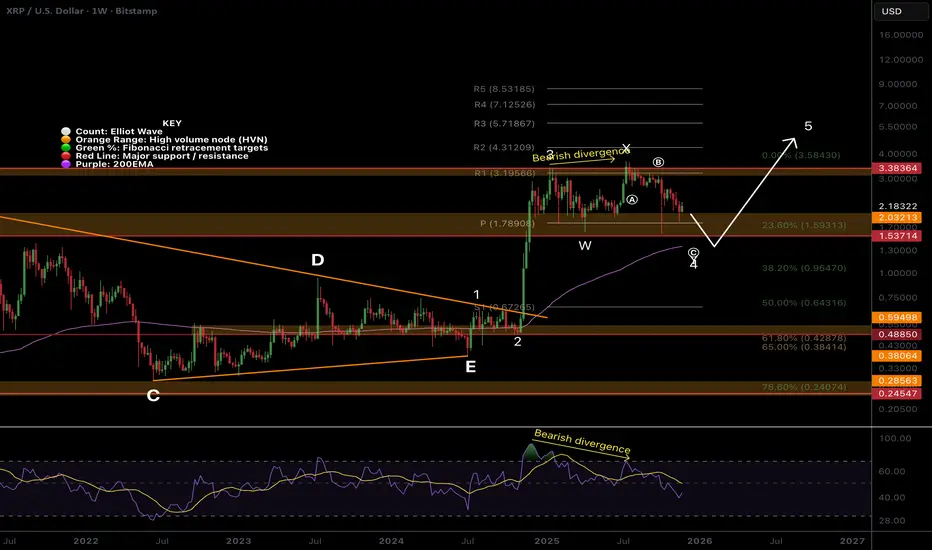
$XRP count changed, wave 4 underwayCRYPTOCAP:XRP Wave 4 appears to be a flat correction defined by the poke above the all-time high. Wave 4 is expected to end at the 0.382 Fibonacci retracement, also the weekly 200EMA ~$1.2.
The multi-year triangle is a penultimate move, so continuation in wave 5 to price discovery is my preferred count. For no,w price is stuck in a range aboev the weekly pivot.
🎯 Terminal target for the business cycle could see prices as high as $4.31 based on the weekly pivots
📈 Weekly RSI is bearish with room to fall after printing bearish divergence
👉 Analysis is invalidated if we fall below $0.64, as wave 4 can not go below 0.55 Fibs
Safe trading
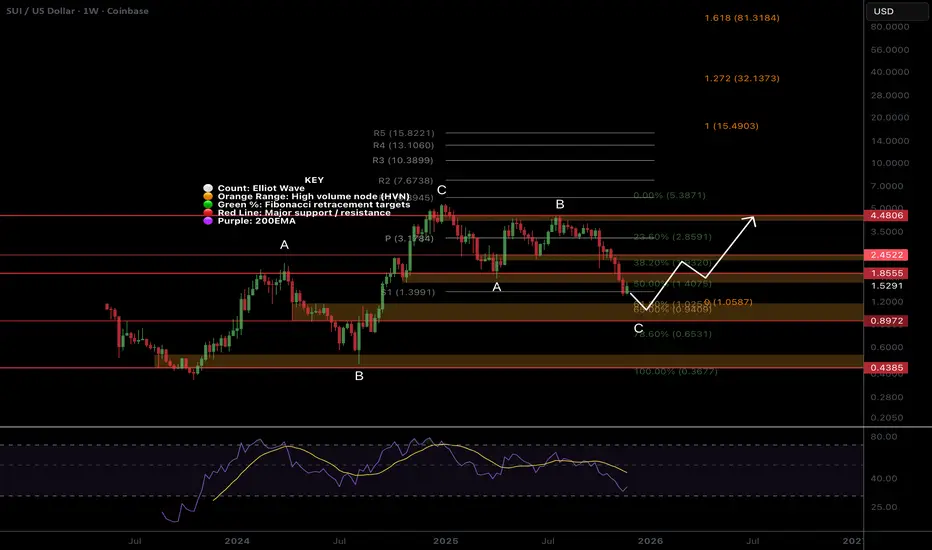
SUI Macro outlook changed...Price appears to be near the completion of a wave C correction.
Price is falling below the S1 pivot, bringing up the next target of the golden pocket and High Volume Node. There is no weekly 200EMA. The series of macro ABC’s suggests upside targets may be limited to the R3 pivot.
🎯 Terminal target for the business cycle could see prices as high as $10 based on weekly pivots
📈 Weekly RSI is bearish, almost oversold with no divergence
👉 Analysis is invalidated below wave B at $0.43
Safe trading
Sol continues to hold up strongCRYPTOCAP:SOL is holding up well with only a shallow retracement to the 0.382 for wave (4)- the weekly 200EMA.
Price is above the weekly 200EMA, which is bullish, but lost the pivot, which is bearish, giving the overall pattern ambiguity. Wave C is underway, but looks near completion at wave 4’s expected Fib targets.
🎯 Terminal target for the business cycle could see prices as high as $660 based on weekly pivots
📈 Weekly RSI is bearish with room to fall, but doesn’t often reach oversold.
👉 Analysis is invalidated if we close back below $50, as wave 4 can not go below the 0.5 Fib.
Safe trading

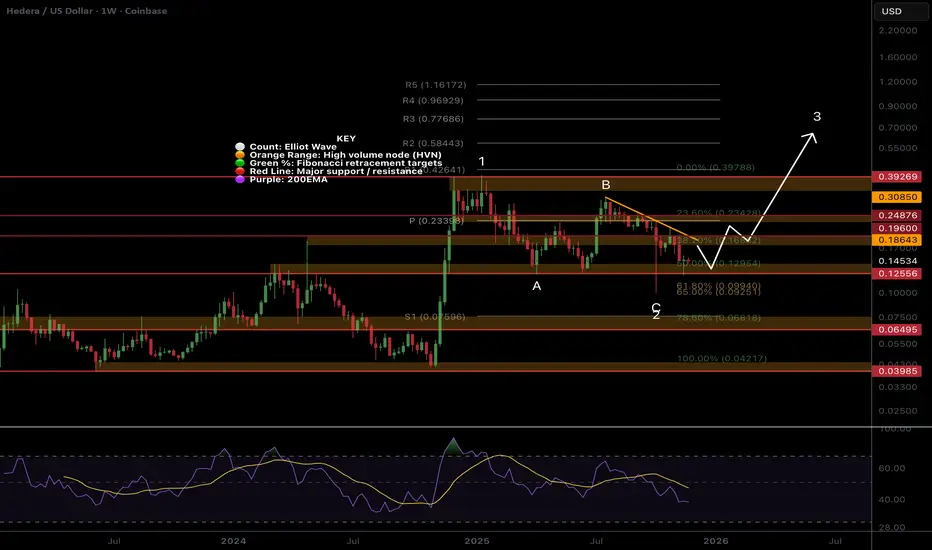
HBAR still holding strongCRYPTOCAP:HBAR Price has printed a textbook ABC for wave 2, but as long as we are below the descending trend-line, the probability is lower still. The wick has now been revisited, which is expected behaviour.
Price is below the weekly pivot. The next downside target is the S1 pivot at $0.075, which is also the alt-coin golden pocket, 0.786 Fibonacci retracement and High Volume Node support.
🎯 Terminal target for the business cycle could see prices as high as $0.8
📈 Weekly RSI is bearish with no divergence
👉 Analysis is invalidated if we close below wave 2, keeping wave 2 alive.
Safe trading
FET looking more and more like a pump & dump scam.Huge engulfing candle from the oversold threshold just above the 0.786 alt-coin golden pocket.
The trend remains down despite this candle with no bullish market structure yet. The weekly 200EMA is finally turning down. Until we get above the descending trend-line, the probability is lower. The 5-wave structure down hints at no new all-time high, as this is a motif wave.
🎯 Terminal target for the business cycle could see prices as high $1.2 when momentum returns
📈 Weekly RSI tapped oversold with no divergence and can remain here for months
👉 Analysis is invalidated above the weekly pivot
Safe trading

ETH hit my downside target now what?Wave 1 appears to have completed a leading diagonal with a poke above all-time high- what we expect from wave 1. Wave 2 is underway, testing the weekly 200EMA so far, and an expected reversal point- also the 0.382 Fibonacci retracement.
The retracement has been shallow, but ETH was beaten down and undervalued, making a shallow pullback expected. The 0.5 Fibonacci retracement is the next downside target at the S1 pivot.
🎯 Terminal target for the business cycle could see prices as high as $9000
📈 Weekly RSI was oversold with bearish divergence and has now reset below the channel EQ.
👉 Analysis is invalidated only if we get below the wave (4) bottom $1365
Safe trading

DOGE, Weekly bullish divergence!Uptrend remains intact from the wave 4 bottom. We could still be in wave 4 as they are characterised by their long, complex ranges. A flat or a triangle is possible.
Wave (1) appears complete as a leading diagonal followed by a deep wave (2), which is expected after this pattern. Price is bullishly riding the weekly 200EMA but bearish below the pivot. Wave (3) should be powerful and fast; any slow grind may hint that we are still in wave IV
🎯 Terminal target for the business cycle could see prices as high as $1.7 based on Fibonacci extensions
📈 Weekly RSI has printed bullish divergence, a good sign but it can take weeks to play out
👉 Analysis is invalidated below wave (2)

BNB Count changed, wave 4 underwayPrice completed a macro wave 3. Wave 4 is expected to end at the 0.382 Fibonacci and may not extend below the 0.5. Crypto assets can overextend in wave 5, which I believe we will see over the next year.
ave 4 is underway testing the previous all-time High Volume Node and 0.236 Fibonacci retracement zone. Price remains in an uptrend.
🎯 Terminal target for the business cycle could see prices as high as $2000, the R5 weekly pivot
📈 Weekly RSI printed bearish divergence from overbought and is already resetting below the EQ. It rarely gets oversold.
👉 Analysis is invalidated below the weekly pivot and 200EMA
Safe trading

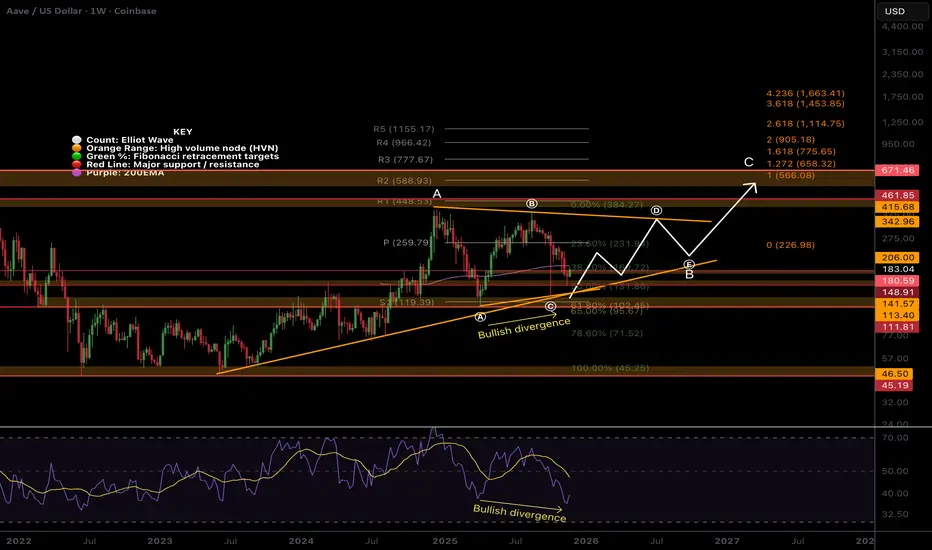
AAVE Macro outlook, weekly bullish divergenceA price range between $440 and $130 continues. Price appears to have completed triangle wave (c) of a larger wave B. Wave (D) is next, with a target of the upper boundary trend-line ~$340.
Price has lost the 200EMA but followed the outlined path of a pump and pullback after wave ©. The weekly pivot is the likely termination point for wave (E), but there is work to be done first. Price found terminal support at the golden pocket Fibonacci retracement.
We are just in a huge range, and there isn’t much more to say on the macro. This asset has been one of the best winners for trading the last 3 years, sticking to the rules strictly.
🎯 Terminal target for the business cycle is still the 1:1 Fib extension, but may be overextended to the 1.272, per wave C rules. Both are around the all-time High Volume Node ~$600
📈 Weekly RSI has room to fall and has printed bullish divergence.
👉 Analysis is invalidated below wave (A) or wave (B)
Safe trading
DCRUSDT LongDecred is forming a strong bullish pattern. After a period of consolidation following a strong impulsive move, it is now beginning a new wave. The minimum target is to break and renew the current high at the 70 level.

QNT - BULL MISSION SOON ?? Is GETTEX:QNT set for a huge daily breakout?? 🚀
For now, the current price action on the daily looks good. But;
Price remain stuck inside the daily wedge structure & key resistances.
✅Double bottom daily
🟥No breakout confirmed yet , Safer to wait for clean candle break above the structure & 93 - 94$ resistance.
🎯Key previous resistance for consolidation level & possible buy zone:
80 - 82$
🍳Any news cooking??
💎We are surely at the bottom of a monthly TF accumulation phase.
Let's keep an eye on this one !
Not a financial advice.

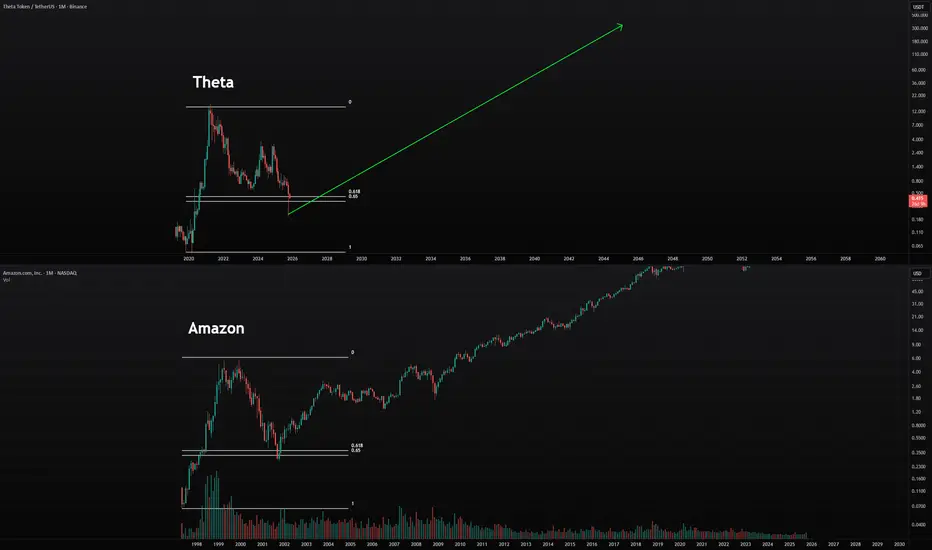
Theta long-term analysis.Today, I take a look at a long-term analysis of Theta, comparing it to Amazon. I believe Theta will perform very well in the big picture. I see it following a major upward trend similar to Amazon’s. However, it could happen much faster than shown on this chart—be ready for big things in this market.
As always, stay profitable.
– Dalin Anderson
Get Ready for a Strong Recovery on Theta in the Near Future! I believe Theta will see a strong recovery very soon based on this ABC correction, the same pattern BCH experienced. This will lead to a sharp recovery and a strong bullish move in the near future. It could be very profitable and mark the beginning of a massive run for this coin in the bigger picture. Theta is heavily undervalued and ready for big things.
As always, stay profitable.
– Dalin Anderson

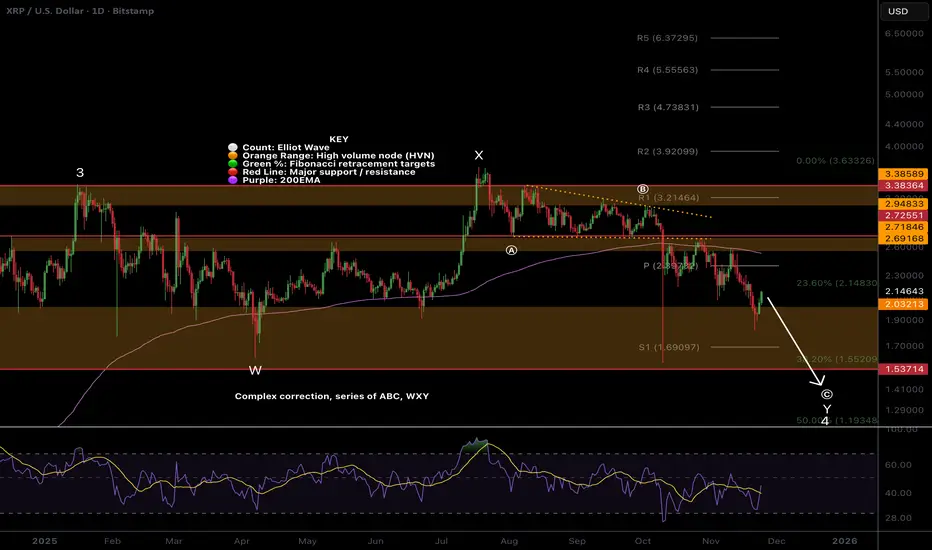
XRP count changed, wave 4 underwayPrice appears to have completed a WXY after the Oct 10th flash crash, but further downside is possible to complete wave 4.
Wave (B) completed a barrier triangle, which suggests the thrust down was the final move before reversal. Price has revisited the wick- expected price behaviour, and we are now looking for a bottom.
Price is below the daily 200EMA and pivot, which is bearish.
📈 Daily RSI reached oversold with no divergences
👉 Continued downside brings up the $1.75 High Volume Node EQ
Safe trading
SUI Dropped hard! More to come?Price accelerated in a downtrend, falling below a major High Volume Node support, invalidating the macro triangle.
Wave C of a textbook ABC correction is underway with a target of the golden pocket. and S2 pivot at $1.
📈 Daily RSI is oversold with no divergence
👉 Continued downside has a next target of $1
Safe trading
