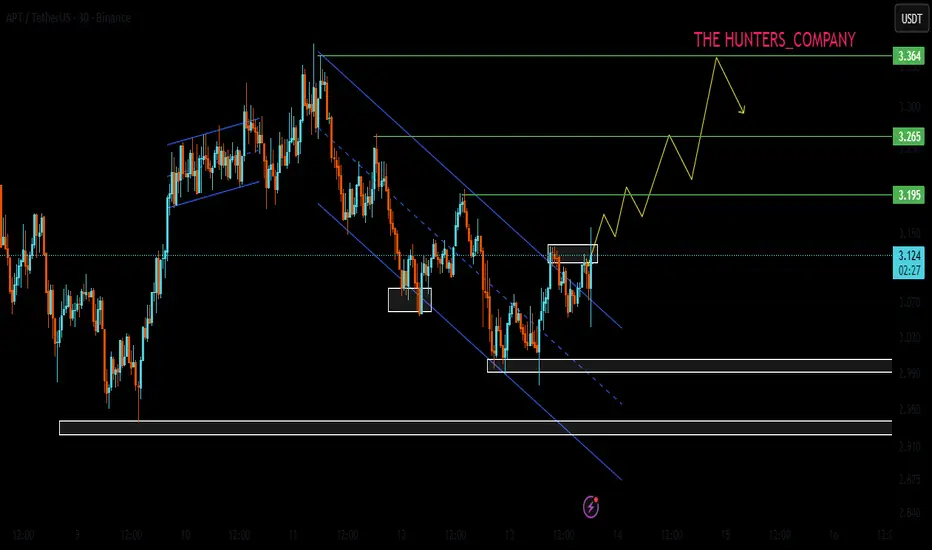
APT;Is it possible to climb the stairs?Hello friends
Considering the rise we had and the subsequent price compression that occurred, there is now an important resistance in the way of the price, and buyers can take the price to the higher targets that have been identified by breaking this resistance.
In case of further correction, we have also identified two other support areas.
Don't forget risk and capital management.
*Trade safely with us*
Altseason
ALTcoin Dominance Is On The Rise; ALTseason?BTC.dominance is coming down, while ALTcoin.dominance is on the rise, so ALTcoins could be doing better than Bitcoin in upcoming days/weeks, but for the real ALTseason, we need Crypto TOTAL market cap chart back to bullish mode.
OTHERS.D chart - ALTcoin dominance is breaking channel resistance line, so some ALTcoins are already nicely recovering, although Bitcoin is still searching for support.
As you can see, even OTHERS Crypto TOTAL market cap chart, which excludes top10 cryptocurrencies, is looking for a continuation higher after the recent complex w-x-y correction.
So, if it manages to break back above channel resistance line near 260B area, then ALTseason could be here, especially if Bitcoin starts recovering as well.

STRK/USDT – Position accumulation in a descending channel.StarkNet - is a permissionless decentralized Validity-Rollup (also known as a “ZK-Rollup”). It operates as an L2 network over Ethereum, enabling any dApp to achieve unlimited scale for its computation – without compromising Ethereum’s composability and security, thanks to StarkNet’s reliance on the safest and most scalable cryptographic proof system – STARK.
StarkNet Contracts and the StarkNet OS are written in Cairo – supporting the deployment and scaling of any use case, whatever the business logic.
CoinMarketCap : #106
Twitter(X) : 346,4k
Currently, STRK is trading within a large descending channel , with the price sitting at the support of the inner channel . After the hype, the price has dropped by -95% ! The Series B & C Round zones are being tested. A -30% drop to the support of the outer channel is not ruled out.
STRK will likely move only when ETH starts growing , as it is an L2 solution.
During the listing phase , this coin was heavily hyped— bloggers were screaming to buy before it "took off" , but they forgot to mention that the rocket was headed downward . Most of them had no real idea what they were doing—it was all just for hype and content .
Now, few still believe in its potential … faith is gone .
But this is exactly why fear is unnecessary . Historically, negative zones often provide some of the best entry points.
I expect STRK to outperform ETH in profitability due to its low liquidity.
I’ve marked everything on the chart—consider this in your trading strategy.

PEPE BUY!Hello friends
Due to the good growth we had, the price has corrected and formed a flag pattern and this pattern has been broken by buyers and now with risk capital management and in a stepwise manner, you can buy and move with it to the specified targets.
*Trade safely with us*

FLOKI : BUY MARKETHello friends
According to the technical analysis carried out, we can say that with the entry of buyers, it is possible to enter into a transaction with risk and capital management and move towards the specified goals.
*Trade safely with us*

DOGECOIN : LIVE TRADEHello friends
According to the technical analysis conducted, we can say that with the entry of buyers in the pullback and their support of the price, it is possible to enter the transaction with risk and capital management and move with it to the specified goals.
*Trade safely with us*

A gift from Trump will launch the ALTSEASON - BTC dominance!📣 Hello everyone!
US President Donald Trump has said he wants to pay the country's citizens "dividends" from customs duties in the amount of at least $2,000 per person. The corresponding entry was posted by the head of the White House on Sunday, November 9, on the Truth Social network.
"People who are against tariffs are FOOLS! We are now the richest and most respected country in the world, with virtually zero inflation and record stock market performance," Trump said.
"We are receiving trillions of dollars and will soon start paying off our HUGE DEBT of $37 trillion. The United States is experiencing record investments, and factories are being built everywhere. Everyone will be paid dividends in the amount of at least $ 2,000 (excluding those with high incomes!)," the message continues.
__________________________________________
The National Cryptocurrency Association has presented the results of its largest study on cryptocurrency owners in the United States, showing a wide and diverse population using digital assets for everything from purchases to long—term investments. The report, based on a Harris Poll conducted in late January and early February 2025, analyzed the responses of 54,000 adults, identifying 10,000 current cryptocurrency owners.
The audience is far from elitist: 21%, or one in five American adults — approximately 55 million people — own at least a small part of the cryptocurrency. Some use it to invest in their financial future, others for art and games, and still others are just curious and trying out a novelty. In addition, many are already using cryptocurrency for everyday purchases.
__________________________________________
Anonymous Trader: Part of these payments from Trump will inevitably go into investments in the cryptocurrency market. Against the background of a reduction in the interest rate of the US Federal Reserve, risk appetite will grow, at least until a certain plateau in the rate is reached or the question of raising it against the background of renewed inflation does not arise at all, but it's too early to think about it yet! At least one more decrease is forecast on December 10, 2025, and the next Fed meeting will be held only on January 28, 2026! And of course, it is worth noting the curtailment of the QT program from December 1, 2025, the balance will no longer be reduced, but there are also no words about printing money until the labor market collapses - but this is a positive moment in any case for risky assets.
In the meantime, where should I invest the $2,000 I received for free?? - Of course, to the violas! - People don't want to earn 10-20-30% in Bitcoin in half a year, but they want to earn +200-300% in alts in a month!
__________________________________________
Technical information:
1. For the first time in the last 3 years, a "death cross" has formed on the Bitcoin dominance chart, which threatens Bitcoin's dominance for at least the next 1-2 months.
2. We saw exactly the same bearish crossover in April 2020! The dominance of Bitcoin has collapsed from 69% to 57%
_________________________________________
Total: The exact date on which payments of the $2,000 gift from President Trump will begin is unknown. Despite this, the chart shows BTC dominance.D I expect a decrease in November-December to at least 55%, which will have a positive impact on the altcoin market. I do not rule out that dominance may break through the 55% support and go even lower, launching a full-fledged altcoin season for strong fundamentals and from the point of view of altcoins charged for growth. 🚀🚀🚀
That's all for today, I wish you good luck in making independent trading decisions and profit. Please analyze the information you receive from me, always think only with your head!
Goodbye! ✊

TIME TO LONG BITCOIN (READ BELOW) Hey traders!
Here again. Since my last analysis a lot of things happened in $BTC. I've been shorting Bitcoin since 110 - 115K as you saw on my last analysis and now I think it's time to shift to a more bullish idea.
The last tho months were tricky. USA shutdown, liquidity contraction.. all the indicators led me to the bearish way. I'm not gonna lie, I thought all those liquidity tensions could blow up the entire markets on a mid term ( 1 - 5 months).
However, since the government is about to reopen again ( liquidity incoming) and the REPO MARKET seems to be healed from those FED massive injections, I decided to take the risk and try to profit from a bullish momentum.
What am I expecting?
One of my first targets are 110K on short term ( incoming days). Then I will close 10 - 20 % of my longs. After that, if martkets allows, another 30% will be closed above 116k level. The rest... ATH?
1st target - > 110K
2nd - > 116K
3rd -> ATH
Don't overtrade and staf saye. Momentum could shift anytime soon.

BTC Dominance at Resistance! Alt Season Possible? Folks, take note! The BTC Dominance is currently hovering at a crucial resistance level
If it decides to drop, then brace yourself for an Alts Rally during an Uptrend. But if it breaks out, the Alts may either tumble or move sideways based on the Market Momentum

ZEC - PRICE UPDATE:CRYPTOCAP:ZEC - Price Analysis:
The daily uptrend remains strong and ongoing, but we're seeing some warning signs:
⚠️ Daily bearish divergence on RSI
⚠️ Overbought territory reached
Bulls still appear in control within the H4 uptrend channel, though it's difficult to determine if we've reached a local top just yet.
Price could consolidate between 700− 500 (yellow zone) before we see the next significant move.
Short term play:
Below $ 680 would likely turn bearish, with the following support levels to watch:
🎯 $ 560
🎯 $ 535
🎯 $500
Globally, above 400 - 410$ = bullish on the weeekly basis.
Remember:
No breakout of the high = No trend continuation.

Bitcoin Dominance Breakdown Ahead? Altseason Signals Emerging!Analysis:
BTC Dominance is showing strong signs of weakness.
After a failed breakout and rejection from the upper boundary of the descending channel, dominance is now testing the short-term ascending trendline (orange).
Losing this level (~59%) could trigger a deeper drop toward 57% and possibly 54.5%.
Main scenario (65% probability):
🔻 Breakdown below 59% → bearish continuation → capital rotation into altcoins.
Alternative scenario (25%):
⚖️ Sideways movement between 59–61% before decision.
Bullish invalidation (10%):
🟢 Daily close above 61.5% → short-term BTC strength continuation.
Momentum and structure both favor downside — altcoins may soon take the lead.

Bitcoin Recovery Setup: BTC Price Rebound Signal & Trade IdeaHey traders.
Short update for BTC and next movement.
Basically we moving in the bullish flag and according to some signals most-likely we going to see BTC going to the top of this channel.
Few reasons:
1) RSI crossed and confirmed (red circle marked)
2) Recovery of the whole market
Points to watch:
1) Low volumes - seems like we not going to break much this flag range (be careful)
2) Money can flow to altcoins - so BTC going to flat
If you want to trade, set up TP at the price around orange line and follow RM.
Share your insights in the comments

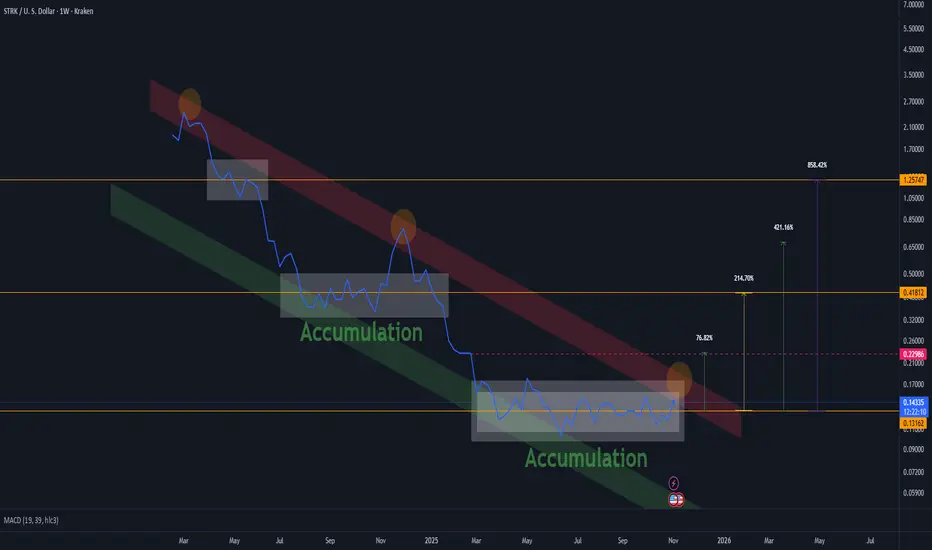
STRK STARKNET - 1W CHARTThere isn’t much to explain here — accumulation → pump → distribution.
Once the descending channel is broken and price moves above it, the potential targets are shown on the chart.

Bitcoin: The Epic Golden Bull RunYes, I get it. Everyone thinks we're already in a bear market. Hope is lost. Life-changing money evaporated. The October crash saw $19 billion in forced liquidations —the largest in crypto history. Some tragically took their own lives. No one wants false hope right now.
But I don't think the bull market is over. And here's why—backed by data, not hopium.
────────────────────────────────────
⚠️ DISCLAIMER
This post is strictly my personal beliefs and thoughts, and should NOT be construed as financial advice, nor does it mean the market must go this way.
This will be a long read but would be worth the time. Sit tight and grab a beer 🍻
────────────────────────────────────
Context: Where I Stood in September
First, I want to share that as of the last week of September, I gave a detailed breakdown of the market and shared why I thought the bull market was over, which I tagged "The Great Convergence." Read below if you missed that:👉
In that post, I worked with the IG:BITCOIN halving cycle theory (along with TVC:SPX and TVC:GOLD ), which for over a decade has been the most efficient, accurate, and proven method for timing IG:BITCOIN rallies, tops, and bottoms.
By halving theory, the bull market should have ended by August/September 2025.
What Actually Happened:
Early October : IG:BITCOIN briefly touched a new ATH near $126,296
October 1st : US government shutdown begins, draining $700B+ from markets via TGA
October 10th : Trump's 100% China tariff threat triggers $19.13B liquidation cascade in 24 hours
IG:BITCOIN crashed from $126K to below $104K—an 18% drop in days
October became the first "red October" since 2018
1.6 million traders liquidated—20x larger than COVID crash, 12x larger than FTX
November 8th (Today) : Market hovering around $100-102K in extreme fear (Fear & Greed Index: 21)
────────────────────────────────────
🔍 What's Different About This Current Cycle
Here's what stands out as fundamentally different:
1️⃣ The Recent CRYPTOCAP:TOTAL Crypto Liquidation Wasn't Capitulation—It Was Infrastructure Cleansing
This wasn't profit-taking or true capitulation. The numbers tell the story:
$19.13 billion in forced liquidations in 24 hours
1.6 million traders wiped out
20x bigger than the March 2020 COVID crash ($1.2B)
12x bigger than the FTX collapse ($1.6B)
This was leverage-driven, not sentiment-driven.
The weak hands and overleveraged positions got flushed out. Meanwhile, strong hands (institutions, whales) continued accumulating through the chaos.
Key Difference : In true bear market capitulations, holders capitulate. In October, leveraged speculators capitulated while spot holders held firm .
────────────────────────────────────
2️⃣ The Liquidity Vacuum Is Temporary (This Is Critical)
Here's what most people are missing about October:
The crash wasn't just about tariffs—it was about a government-induced liquidity crisis .
What Happened:
US government shutdown began October 1st
Treasury General Account (TGA) balance swelled from $800B to over $1 trillion in just 20 days
That's $200+ billion drained from the financial system
Standing Repo Facility (SRF) usage hit $50.35 billion on October 31—highest since the pandemic crisis in March 2020
This indicated severe dollar shortage in the system
Why This Matters:
COINBASE:BTCUSD correlation with dollar liquidity remains near 0.85
When the government shutdown ends and resumes spending, that liquidity floods back
BitMEX analysts project a strong relief rally when hundreds of billions are injected back
This isn't a structural bear market—it's a temporary liquidity vacuum.
────────────────────────────────────
3️⃣ Institutional Holders Aren't Selling Like Retail Did in Past Cycles
Whale Accumulation Data:
1,455 wallets now hold over 1,000 BTC
UTXO Age Distribution shows a 5% spike in "Over 8 Years" buckets
Long-term holders are doubling down , not distributing
Whale Originating Transaction Count:
Miner Behavior:
Post-halving, miners anticipated higher prices and chose to hold rather than sell immediately
While smaller miners face profitability pressure, institutional holders are not showing distribution patterns
ETF Context:
U.S. spot Bitcoin ETFs saw $1.2B+ in outflows during the crash week
October 16 alone: $536 million in panic redemptions
BlackRock's NASDAQ:IBIT : $268.6M out | ARK's ARKB: $275.2M out
BUT HERE'S THE KEY : These were temporary panic outflows, not structural distribution. Year-to-date, institutional accumulation has been relentless . The October outflows represent weak hands being shaken out—exactly what you'd expect in a mid-cycle correction, not a cycle top.
────────────────────────────────────
4️⃣ No FOMO. No FUD. No Euphoria. (Strongest Psychological Indicators)
Let's compare sentiment metrics:
Current Sentiment:
Crypto Fear & Greed Index: 21-25 (Extreme Fear) as of November 7-8
BINANCE:BTCUSD RSI as at Oct ATH: ~60 (far below euphoric 75+ levels)
Market Mood: Despair, capitulation narrative, "bear market confirmed"
True Bull Market Top Sentiment (for comparison):
Fear & Greed Index: 80-95 (Extreme Greed)
RSI: 75-85 (overbought for weeks)
Market Mood: "Bitcoin to $500K," taxi drivers asking about crypto, covers of mainstream magazines
We haven't even come close to euphoria.
The 2024 meme coin craze was a micro-cycle within the broader structure—too early and too isolated to be considered true market-wide euphoria.
────────────────────────────────────
5️⃣ The CHART Does Not Reflect a Bull Market Yet
This is where I'll let the charts speak.
First, Look at Gold's Bull Market: 👉
Clean. Parabolic. Obvious. No second-guessing needed.
Now Look at Bitcoin: 👉
Ask Yourself Honestly:
Does this chart scream "parabolic bull market"?
Does the recent ATH look like a blow-off top?
Does the volume profile suggest distribution?
If you can't answer YES with conviction, then the answer is NO.
A Simple Psychology Principle I Use:
If I can't say YES without doubting my decision, then the answer is NO.
────────────────────────────────────
6️⃣ Cycle Coincided with AI Tech Mania and CAPITALCOM:GOLD Super Rally
This cycle is unique because capital had competing destinations:
AI Tech Mania : Nvidia, AI stocks absorbed massive capital flows
CAPITALCOM:GOLD Super Rally : TVC:GOLD broke out to all-time highs, attracting safe-haven capital
Risk-On Delay : BITFINEX:BTCUSD became less attractive as capital rotated elsewhere
This delayed the typical IG:BITCOIN Bitcoin cycle dynamics—it didn't end them.
────────────────────────────────────
🧠 My Contrarian Thesis
While this might sound crazy, I believe we are still in the OPTIMISM phase of this rally.
Unlike previous cycles, I believe we will experience an extended rally lasting through Q1/Q2 2026.
My Thesis is NOT Based On:
❌ Traditional Halving Cycle Theory — I believe that timeline will be extended and recalibrated this time
❌ Stock-to-Flow (S2F) Alone — Though I lean toward its supply dynamics
My Thesis IS Based On:
✅ Pure naked price action and structure
✅ Volume profile analysis showing accumulation
✅ Market structure and RSI positioning
✅ Government liquidity mechanics and TGA dynamics
✅ Institutional vs retail behavior divergence
✅ Psychological playbook of market cycles
────────────────────────────────────
🔄 Why the Halving Cycle Is Extended, Not Broken
Many are saying "the 4-year cycle is dead." I disagree.
It's not broken—it's being distorted and extended by new factors:
The ETF Factor Changed Everything:
Traditional Halving Cycle:
Post-halving scarcity → slow accumulation → parabolic phase ~500-550 days later
2024-2025 Cycle:
January 2024: Spot OANDA:BTCUSD ETFs approved
ETFs brought forward typical post-halving demand 12 months early
This created an early rally into March 2024, then consolidation
October 2025: Temporary ETF panic outflows (weak hands exit)
Framework : The cycle hasn't ended—it's been stretched across a longer timeframe
Historical Context:
Historically, most significant price appreciation occurred between days ~500-550 post-halving
For the April 2024 halving, that window ends Q3 2025 ... but if we factor in the time lag and the now running ~2-Months Govt shutdown delay then that window could be adjusted to Q3 2025 - Q1 2026
See it like a football match, time delay during match is added as extra time, it doesn't mean the 90min rule is broken simply means wasted time must be accounted for.
We're literally in the window right now
Expert Analysis:
Leading analysts suggest the era of the strict 4-year cycle is evolving
Market maturity, institutional concentration, and dampened volatility mean the traditional rhythm is being replaced by liquidity-sensitive, macro-correlated behavior
The cycle isn't gone—it's adapting to a new market structure
────────────────────────────────────
📈 The Current Chart Breakdown
Look at the Chart Again: 👉
Four Critical Questions:
1. Does this move look like a completed rally?
→ No. It looks like mid-cycle consolidation with a violent shakeout.
2. Does the recent ATH reflect a distribution top?
→ No. Volume and RSI don't support distribution behavior. The ATH was a brief spike , not a prolonged distribution phase.
3. What does the volume profile show?
→ Accumulation zone. Heavy volume during the $95K-$110K range indicates re-accumulation, not distribution.
4. What is the RSI telling us?
→ Sitting on base support —the same level that triggered every prior bull market explosion in this cycle.
Conclusion:
If both price action and volume show accumulation rather than distribution, we're in a re-accumulation phase, not a post-rally distribution phase.
────────────────────────────────────
🎯 The Macro Setup
CRYPTOCAP:BTC is Positioned Perfectly:
✅ Inside the macro demand zone that has held since late 2023
✅ On the ascending channel that guided every major leg of this cycle
✅ Channel from 2023 is intact and pointing into six-figure territory
✅ Weekly demand zone holding with precision — re-accumulation, not distribution
✅ Weekly RSI on base support — same level that triggered every bull explosion
✅ Nothing is broken. Nothing is topping.
This is positioning, not exhaustion.
────────────────────────────────────
I shared this analysis yesterday, you can read the full or the summarized version below:
📅 Cycle Structure: The 14-15 Week Expansion Pattern
Every expansion leg in this cycle has followed a pattern:
14-15 weeks of expansion
Followed by 16-18 weeks of correction
Where Are We Now?
End of the correction window
Beginning of the next expansion phase
Historical Precedent:
If we follow 2017's pattern (euphoric Nov-Dec Rally) where CRYPTOCAP:BTC gained +200% in price between Nov 17 -Dec 17 from 5.6k+ to 19.6k+, we could see an explosive acceleration starting from Next week Mid-November - December 2025
With institutional adoption and extended liquidity cycles, this could push into Q1 2026
This would make the current cycle the longest on record , not the end of one
────────────────────────────────────
🔥 What the Chart Is Screaming
Key Technical Signals:
Ascending Channel Intact — Channel from late 2023 still pointing to six figures
Demand Zone Holding — Weekly demand zone defended with precision
Breakout Level Clear — $126K break = ignition point for macro acceleration
RSI Base Support — Weekly RSI at the exact level that preceded every rally
Projection Untouched — Path to $150K–$170K remains structurally intact
────────────────────────────────────
🚀 Two Scenarios Moving Forward
Scenario 1: Direct Blast-Off ⚡
Demand zone holds firm here
Government shutdown ends → liquidity snap-back
$126K breaks decisively within weeks
New ATH confirmed
Vertical acceleration into $150K–$170K by December 2025
Extended rally continues through Q1 2026
Scenario 2: One Final Manipulation Flush 🌊
Wick below demand zone (liquidity grab to $95K-$98K)
Mid-channel tap for final shakeout
Violent V-shaped recovery and reclaim
Same ultimate target: $160K–$170K
Timeline delayed by 4-8 weeks but destination unchanged
Both scenarios end at the same place. The path differs, but the structure remains intact.
────────────────────────────────────
❌ The Only Invalidation
I will abandon this thesis if:
Primary Invalidation:
Weekly close below the ascending channel (currently ~$80K)
Secondary Warning Signals:
TGA doesn't release liquidity when government reopens
Institutional ETF outflows continue for 2+ consecutive months
Fear & Greed Index stays below 30 through EOY 2025
IG:BITCOIN fails to reclaim $110K by end of November 2025
Weekly RSI breaks below 40 and stays there
Until these conditions are met, the bull thesis remains structurally intact.
────────────────────────────────────
💡 The Liquidity Snap-Back Thesis
Here's the mechanism most traders are missing:
How Government Shutdowns Affect Crypto:
Phase 1: Shutdown (October 1 - Present)
Government stops spending
TGA balance grows ($800B → $1T+)
Liquidity drained from system
Dollar shortage (SRF at $50B+)
Risk assets crash
Phase 2: Reopening (Coming Soon)
Government resumes spending
TGA balance depletes back down
$200B+ floods back into system
Dollar shortage resolved
Risk assets rally violently
BINANCE:BTCUSD 0.85 correlation with dollar liquidity means:
When liquidity drains → Bitcoin falls
When liquidity returns → Bitcoin rips
This isn't speculation—it's mechanical.
The October crash was a liquidity event, not a sentiment event. When that liquidity returns, CRYPTOCAP:BTC will respond proportionally.
────────────────────────────────────
📊 Why October's Liquidation Was Different From Bear Markets
Let's compare major crypto crashes:
The Critical Difference:
Previous crashes: Spot holders capitulated
October 2025: Spot holders accumulated while leveraged traders got wiped out
This is cleansing, not capitulation.
────────────────────────────────────
🎨 Compare: What a Real Bull Market Top Looks Like
Signs of a Cycle Top We DON'T Have:
❌ Fear & Greed Index at 90+ for weeks
❌ RSI pinned above 75
❌ Parabolic vertical price action
❌ "Bitcoin is going to $1 million" headlines everywhere
❌ Taxi drivers and hairdressers asking about crypto
❌ Massive miner selling at highs
❌ Whales distributing to retail
❌ Everyone you know is suddenly a crypto expert
❌ Cover stories on TIME, Forbes, Bloomberg
❌ New ATHs multiple weeks in a row
Signs of Mid-Cycle Correction We DO Have:
✅ Fear & Greed at 21 (Extreme Fear)
✅ RSI at 46 (neutral to oversold)
✅ Choppy consolidation in range
✅ "Bull market is over" narratives everywhere
✅ Retail giving up and selling
✅ Whales accumulating quietly
✅ Liquidation event clearing out leverage
✅ Volume profile showing accumulation
✅ Market despair and hopelessness
We're not at a top. We're in the middle of the game.
────────────────────────────────────
💰 Why I'm All In
In my last post I said I went ALL IN on IG:BITCOIN and my selected alts. (after earlier shorting around 120k and sitting on cash)
Not because I'm reckless. Not because I'm ignoring risk.
But because:
The macro structure is intact
The demand zone is holding
RSI is at historical launch support
Volume shows accumulation, not distribution
No euphoria has occurred yet
The chart does not reflect a completed bull market
Government liquidity will return mechanically
Largest liquidation in history = weak hands removed
Institutional holders aren't selling
We're in the historical extended post-halving window
This is structure. This is patience. This is conviction based on data.
────────────────────────────────────
🙏 Final Thoughts
I know many of you are hurting right now. I know hope feels dangerous.
But look at the data objectively:
October was the largest forced liquidation in history—not organic selling
The government shutdown created a temporary liquidity vacuum
Zero signs of euphoria anywhere in the market
Institutional holders and whales are accumulating
The chart structure shows mid-cycle correction , not cycle top
Sometimes, the best opportunities come when:
Everyone is bearish
The crowd has capitulated
Fear is at its peak
And the chart is quietly building the foundation for the next explosive leg
This is not hopium. This is structure. This is the setup.
The Golden Bull Run hasn't even started breathing yet.
We're not at the end— we're at the reset point before the real parabolic phase.
────────────────────────────────────
📌 Key Levels to Watch
Support Levels:
Primary Demand Zone: $98K - $104K (current position)
Mid-Channel Support: $90K - $95K
Critical Invalidation: $85k-$90K (weekly close)
Breakout Levels:
Ignition Point: $126K (previous ATH)
Confirmation: $130K (weekly close above)
Targets:
Conservative: $150K - $160K (Q2 2025)
Base Case: $170K - $180K (Q3 2025)
Extended Cycle: $200K+ (Q4 2025 - Q2 2026)
Timeline Checkpoints:
End of November 2025: Reclaim $110K
December 2025: Break $126K and establish new ATH
Q1 2026: Parabolic acceleration phase and potential cycle peak(extended thesis)
────────────────────────────────────
🎯 What Would Make Me Change My Mind?
I will publicly update and reassess if:
Weekly close below $85k-$90K (channel break)
TGA remains elevated 4+ weeks after shutdown ends
Institutional ETF outflows persist through December
RSI breaks and holds below 40
Fear & Greed stays below 30 through Q1 2026
Failure to reclaim $110K by November 31, 2025
I'm bullish, but not blind. The market will tell us if the thesis breaks.
────────────────────────────────────
🔚 Bottom Line
This bull market isn't slowing down—it's resetting for the real parabolic phase.
CRYPTOCAP:BTC is gearing up for expansion, and alts will follow with the delayed but inevitable altseason wave.
This next 12-18 months is where:
Generational wealth is made or missed
The real euphoria begins
The masses FOMO in—not out
The chart finally looks like a bull market
Don't let October's liquidation event fool you into thinking this is over.
The chart says accumulation. The structure says intact. The liquidity says temporary. The sentiment says despair.
That's not a bear market— that's the setup for the next leg.
🐂🔥
────────────────────────────────────
Not financial advice. This is my personal analysis based on current data. Markets are unpredictable. Trade responsibly. Manage your risk. Do your own research.
If you found this analysis valuable, feel free to boost/share. Let's see who's still standing when IG:BITCOIN crosses $150K.
────────────────────────────────────

OTHERSBTC – Altcoin Market Bottoming Before Major Breakout (1W)The altcoin market (OTHERSBTC) has been forming a massive falling wedge since 2021, and we’re now sitting right at the top resistance of that pattern.
Historically, every time this setup appeared, it marked the end of a bear cycle and the start of an altcoin expansion phase.
On the weekly TPA MACD, there’s a clear bullish divergence — momentum is rising while price made lower lows. This is exactly how previous alt seasons started (2017, 2020).
📅 What I expect:
November 2025: Still some sideways action (0.10–0.13 zone).
Dec 2025 – Q1 2026: Possible breakout → first targets 0.16–0.20.
Mid–Late 2026: If momentum continues, we could see a full altseason with 0.30–0.35 area retest.
Personally, I’m accumulating quality alts here and planning to hold through 2026. This looks like the final accumulation phase before the next big rotation out of BTC dominance.
⚠️ This is just my personal view based on the chart and what I’m planning to do — not financial advice.

Altcoins season Others / BTC has re-touched the same demand zone where the 2021 bull run began.
Momentum and disbelief are at historic lows.
Once this chart's recovery begins, it will drive waves of expansion for altcoins.
Altseason is inevitable.
Because I don't make the rules.

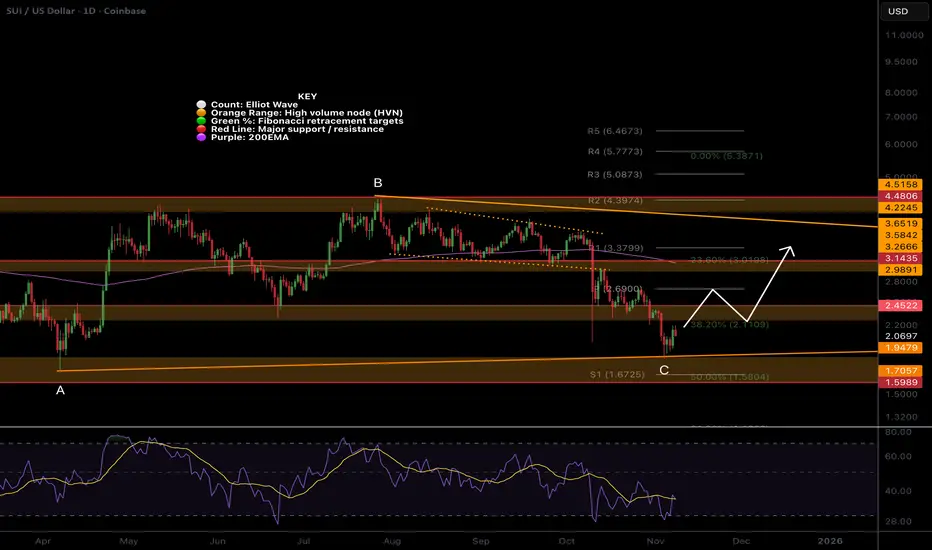
SUI remains in a shallow Fib triangleCRYPTOCAP:SUI Price remains in a downtrend, falling below a major High Volume Node support, tapping the macro triangle lower boundary.
Wave C of the triangle appears complete. If this count is correct, we should accelerate to the upper boundary around $3.6 over the next month or so, with some difficulty at the daily 200EMA and pivot as resistance.
📈 Daily RSI printed bullish divergence from oversold
👉 Continued downside loses the triangle pattern, and the next target is $1.6
Safe trading
SOL holds up wellCRYPTOCAP:SOL Price continues lower in the channel, a textbook ABC correction so far.
Wave 1 ended with a wedge throw-over. Price has found support above the Fibonacci golden pocket and High Volume Node at the channel's lower boundary. The probability is a continuation to the downside with a target of $140.
📈 Daily RSI tapped oversold with no divergence to suggest a bottom
👉 Continued downside brings up the $112 target, a great buy opportunity
Safe trading

ONDO,1 more push lowerLSE:ONDO Price is sitting just above High Volume Node support, testing the descending trend-line as resistance. As long as we are below the trend-line, the probability is to the downside.
Wave 2 appears complete after 5 waves down from the wave X flat correction. Price was front-run at the golden pocket Fibonacci retracement, but only a bounce so far. We are below the daily pivot and 200EMA, which is bearish.
📈 Daily RSI tapped oversold twice with slight bullish divergence.
👉 Continued downside has a target of the bottom of the High Volume Node at $0.5
Safe trading

HBAR back in the channel!CRYPTOCAP:HBAR Price is back in the descending range after dropping below during the flash crash, which can be viewed as an anomaly.
Wave 2 appears complete at the golden pocket Fibonacci retracement. Price was rejected at the daily 200EMA and channel upper boundary and has lost the daily pivot and High Volume Node, suggesting further downside is to come.
📈 Daily RSI reached oversold and has printed hidden bullish divergence, which is bullish
👉 Continued downside has a target of the $0.13 High Volume Node
Safe trading

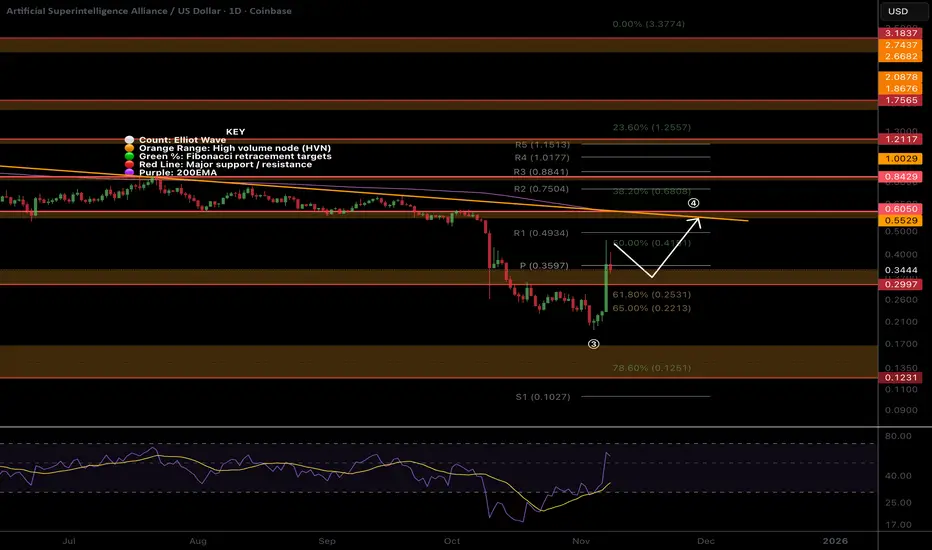
FET, Pump and dump?NYSE:FET Price bounced with a one day candle of 70% recovering the High Volume Node resistance and daily pivot from the golden pocket Fibonacci retracement.
Chasing candles higher is what’s on the cards of naive investors now. Greed and FOMO immediately took over socials with much gloating. This is a recipe for lower, humbling them.
📈 Daily RSI went too high, too fast, and now has bearish divergence in a bear market, a strong signal.
👉 Continued upside has a target of the daily 200EMA and High Volume Node resistance at $0.6.
Safe trading
ETH Correction complete?CRYPTOCAP:ETH Wave 2 is taking the form of a complex WXYXZ correction broadening wedge. Ugly, hard to trade or find any entries. This will cause a lot of stress. This is also potentially a wave 4, but my preferred count is 2 for now.
Wave 2 appears complete with a swing below the boundary, but the recovery should have been stronger by now; instead, we are stalling below the daily 200EMA. The trend is down, and so we should expect more down. Wave X printed a triangle
📈 Daily RSI has not reached oversold and is still bearish with no divergences.
👉 Continued downside has a target of the High Volume Node $2600, where I will be adding.
Safe trading
