BNB Bearish continuation?CRYPTOCAP:BNB Price appears to have completed wave (1) at the R1 pivot and has retraced to the daily 200EMA, 0.5 Fibonacci retracement and S1 pivot so far. A tough nut to crack.
Wave (2) appears complete with a textbook ABC correction ending at strong support. The downtrend is intact, so the probability is still to the downside until the structure flips.
📈 Daily RSI has not reached oversold and is still bearish with no divergences
👉 Continued downside loses the 200EMA and brings up the Golden pocket as support $740
Safe trading
Altseason

AAVE local analysis updated, Bear trend continueEURONEXT:AAVE Locally, price continues bearish after falling out of the wedge, completing wave 1. Until the price gets above the orange descending trend-line, the probability is downside continuation.
Wave 2 appears complete after the big drop, black swan event. I was looking for a dip back into the long lower wick, which we have and price found support. This suggests we grind higher from here, but we must get through the daily 200EMA, just above the High Volume Node resistance and daily pivot. This area will be tough to crack.
The alternative count is a triangle forming discussed below, which is the (A)(B)(C) shown.
📈 Daily RSI has printed bullish divergence from the oversold threshold, which is bullish and a bottoming signal.
👉 Continued downside has a next target of $150.
Safe trading

NEAR Is Super Bullish (3D)One of the strong Layer 1 projects in the market with a solid chart that is not showing a correction like most altcoins is NEAR.
It has a bullish contracting pattern on the higher timeframes, and it seems that its strongest wave has just started.
This coin has good growth potential in the larger timeframes.
It can be considered for investment and holding, even in this non-bullish market phase.
It’s likely that NEAR will be among the first altcoins to lead the upcoming altseason.
For risk management, please don't forget stop loss and capital management
When we reach the first target, save some profit and then change the stop to entry
Comment if you have any questions
Thank You

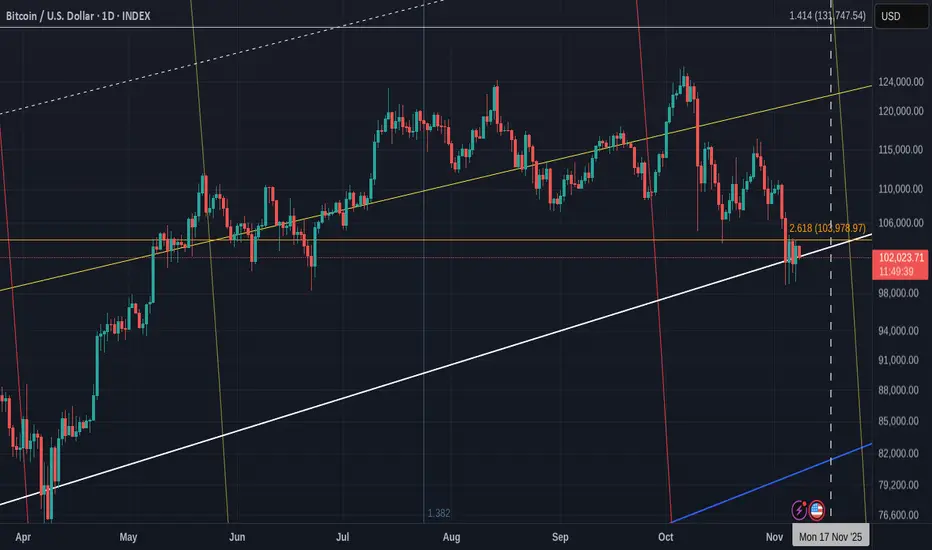
Various things point to a Bitcoin Move higher within next 9 days
There are a number of simple things, basic YA, that points towards A Move from Bitcoin.
The Pennant being printed Right now, with PA squeezed between the 2.618 Fib and a Long Term line of rising Support, could be seen as Bearish
The rising line of support is Strong however and we last touched it back in April 2025 and bounced well.
We arrived there after a long sustained Drive by the Bears to push us down, as is the case right now.
If we zoom into the 4 hour, we see more detail
There is a sustained Ceiling (2.618 fib ) and each time PA gets rejected the Bulls step in and we now are working with in a decreasing Range.
But the Bears ARE in control right now and this is why we are were we are now.
PA being Squeezed and heading to an Apex.
PA Always reacts BEFORE the Apex and I expect the latest this could happen to be around the 17Th November.
But the MACD Always shows us another side, a trend formation.
Lets look at the Weekly first
So we see how the Weekly MACD is falling Bearish still and will likely do so until it meets its first line of support around.....17 November. See the Vertical blue cashed line on the PA 4 hour chart and then look where that is on this MACD chart
Then see the rising dashed line that previous MACD Lows seem to have bounced off.
NOTE, there is a possible inaccuracy here as trends require 3 touches to be Valid....This has had 2. So, we wait to see..........
Otherwise, the projected MACD arriving at Neutral is around 22 December......
The Daily MACD
The Fact that Naily MACD has not been this low for a Long time, also points towards a Move in the near future.
In fact, the last time MACD was this low, was March 2025, just beofre PA hit long Term Support and bounced....
Bitcoin Dominance is approaching a local line of support
Conclusion
While there are Bullish signs, it should be remembered, we can still drop lower while sentiment fall and the Rotation of Money towards ALTS gains momentum. But as had happened so many times this cycle, Things can turn VERY quick and if you are selling to Buy ALTS< Remain Very cautious
As mentioned in my monthly Candle colour report, I mentioned that November could close Red......But it may not.....it is honestly a very difficult market right now....
But one thing is Certain.. BTC PA will make a bigger move soon......We just do not know for sure, in which direction but for me, the odds are that it will go higher.
Time will tell
BTC - What if #1What a move corn, what a move.
Although it's a what if for, becomes an expectation when i see that bear div on rsi.
An impulsive move like this may very well complete as diagonal, and when you see diagonals at the highs with HTF divs, you run away.
If that happens to work, i'd not think for a second to buy that dip as the expection should be new highs, but i'd not be married to that idea - which takes me to the 2nd idea :

LTC/USD +2000%All you need is not a chart. The market is much simpler than it seems. The last “bull market” on Litecoin was only +400-500% in 2021. In fact, it wasn't a bull market, but a fake pump test after the real bull market in 2017 to drain people who hold this coin. After all, we have 7 years of accumulation, and in this case, +1000% is the minimum I expect. The ETF is not the real reason, it is just a cover for the positions taken during this entire period.

PEPE - BULLISH CRYPTOCAP:PEPE - bullish setup above yellow zone 🚀
Key demand zone weekly📈
Bull div RSI daily 📈
Beautifull chart,
Unstable area & oversell one, subject to a bull correction. FOMO retracement could be see.
Long term resistance to be break: 0.00007800$.
I just share a 90%+ success view, I draw the magic lines, you decide. #NFA

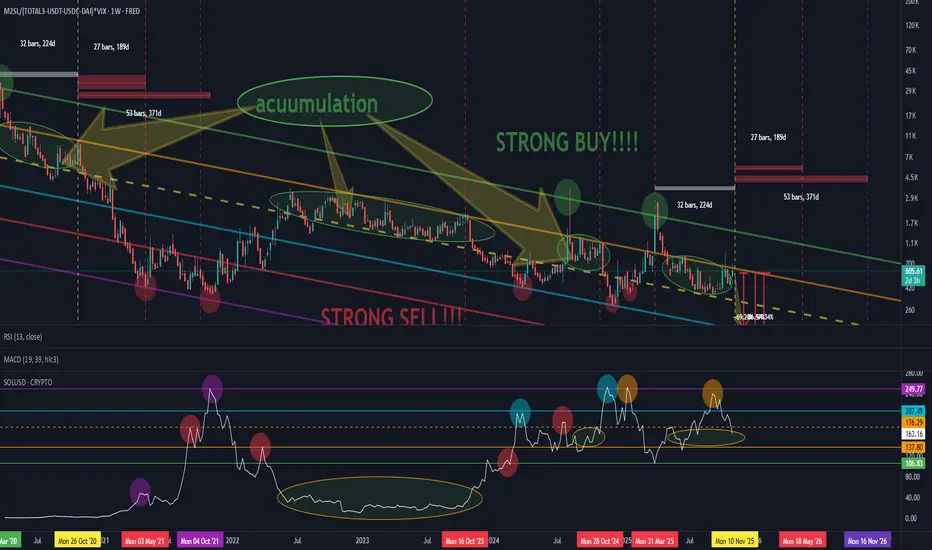
Altseason Indicator: Liquidity and Cycle CorrelationAltseason Indicator: Liquidity and Cycle Correlation
I’d like to share some observations reflecting the dynamics of the altseason.
This setup may perform differently on certain assets, but during testing on Solana (SOL) it showed quite interesting results — the project has been around long enough to clearly display cyclical behavior.
The formula is based on the relationship between global money supply (M2) and crypto market capitalization excluding stablecoins, BTC and ETH :(Total3 – USDT – USDC – DAI), combined with market risk sensitivity via the VIX index.
!Observation!
Periods of altcoin accumulation tend to coincide with moments when the “money” (liquidity) metric moves sideways — between the orange dashed and solid yellow lines (shown as ellipses on the chart).
On the coin’s chart, it’s clearly visible when liquidity starts flowing back into the asset — the colored circles mark the points where price bounced off the lower liquidity boundary.
When comparing the current cycle to 2020–2021, an interesting parallel appears:
The absolute market bottom occurred on March 10, 2020.
After 32 weeks, a steady recovery began.
After another 59 weeks, the cycle peak was reached.
What followed was a drop in confidence and a final “overinflation” toward the top of the previous cycle.
In the current cycle, we seem to be in a similar phase:
about 32 weeks after the recent bottom, a move toward new highs may be forming — just like in 2020.
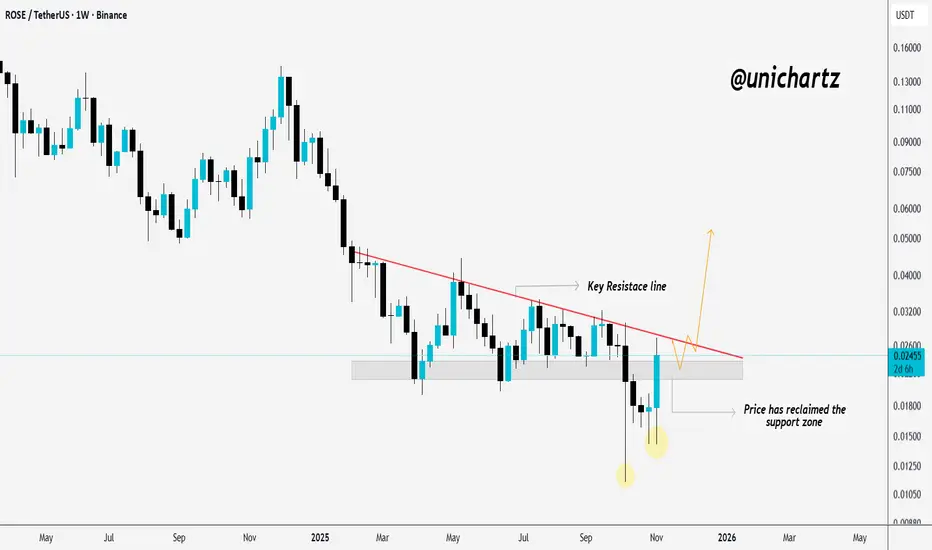
ROSEUSDT: Eyeing a Breakout Above Key ResistanceLSE:ROSE has rebounded strongly from the bottom and reclaimed its support zone.
It’s currently trading just below a key resistance trendline, if it manages to break and hold above this level, we could see a potential upside move ahead.
DYOR, NFA
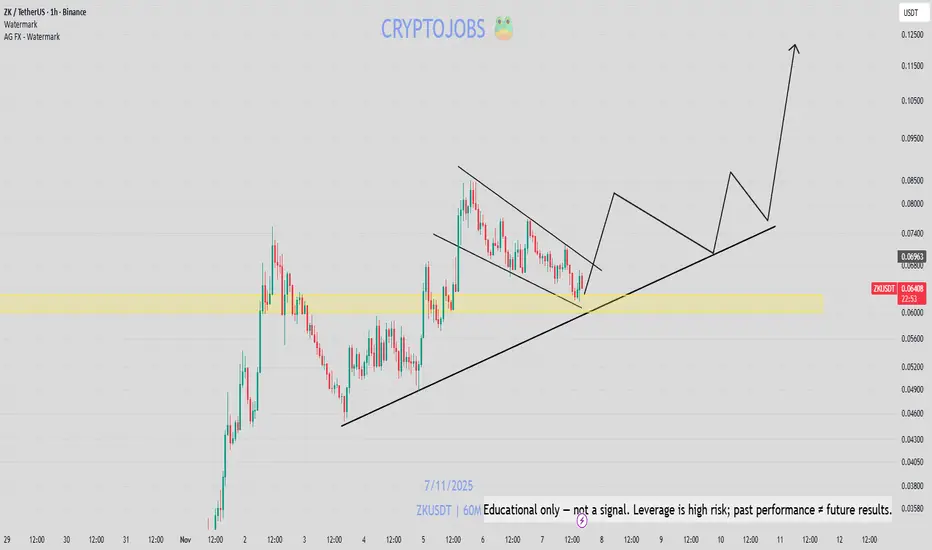
Following my previous outlook: ZK = bullish BIG BREAKOUT INCOMING ON NYSE:ZK ??? 🚀
Am I sniping every chart?? 🎯 Likely YES!
NYSE:ZK --> From 0.850$ to 0.650$ ✅
Following my plan: Demand zone & retest hit!✅
I enter in position here! 📈
0.100$ Next??
I know that My charts looks perfect again, but always #DYOR before investing !
GRASS - ANOTHER TP4 HIT!! In long or in short? I don't care, my Froggy Guru technical outlook skills is pure experience 🐸🔥
Yesterday's setup:
#GRASS -->my TP4 HIT ✅🔥
-12% ✅

ROSE - +60% SETUP COMPETED!! Maybe you have to smash the like button?
SETUP COMPLETED
LSE:ROSE + 60% up

AIA VS BLESS - MOONSHOT SESSION INCOMING ??? OMG IS THAT REAL? 👀👀👀
NASDAQ:AIA made a 2300% + pump in few days.. 🔥
Guess what,
SET:BLESS Chart structure looks similar 💣
Price manipulation, or real moonshot session incoming for #BLESS ?? 🟩🚀

COAI - ITS TIME?? $COAI - It's TIME ?? 🚀🚀🚀
🟩YES
🟥NO
IF THIS ONE TOUCH 2.00$ before tomorrow, I'll give 50$ to one lucky winner who comment, like & share! 📈🎁

BTC.D and altseason until the end of 2025BTC.D will refuse to show a significant fall in 2025. First week of 2026 is the beginning of altseason preview. It will end in March.
Currently BTC.D is #overbought and relief bounce in alts is imminent lasting for a couple of weeks with suddent reversal.

$FET looks ready for a bigger moveAfter breaking key resistance on strong volume, it’s now testing the zone. Everything points to another upward push.
🟢 Entry : 0.2215$ - 0.2170$
🎯 Tps : 0.232$ - 0.245$ - 0.26$
🔴 Stop : 0.20$
Holding above 0.215$ thn we could see a good move ✅ DYOR

Altseason? Not yet — but the real move is coming... soon.As shown in the chart, the weekly MACD reset isn’t complete yet. A similar setup happened in September 2024 — we got a fake pump that fooled many, while the real breakout started in December 2024.
🔍 Why does this happen?
Impatient whales — often close to the “crypto president” — start buying early. Using influencers and media hype, they push the "New ATH" narrative and lure in retail. But this early FOMO creates a massive bearish divergence — the RSI hasn’t reset yet, and the market isn't ready.
📉 The result?
A painful 6-month correction that punishes impatience. The market always reverts to math — and math doesn’t lie.
You can’t fake momentum forever — no matter how much money you throw at it.
💡 My forecast remains unchanged:
Once the MACD weekly crossover happens, the real pump begins — no ETF, no Saylor needed. The market moves on its own, as it always has.
📊 Check the chart. Read the signals. Trust the data.
#Bitcoin #BTC #CryptoTrading #CryptoWhales #MACD #TechnicalAnalysis #BearishDivergence #Altseason #DYOR

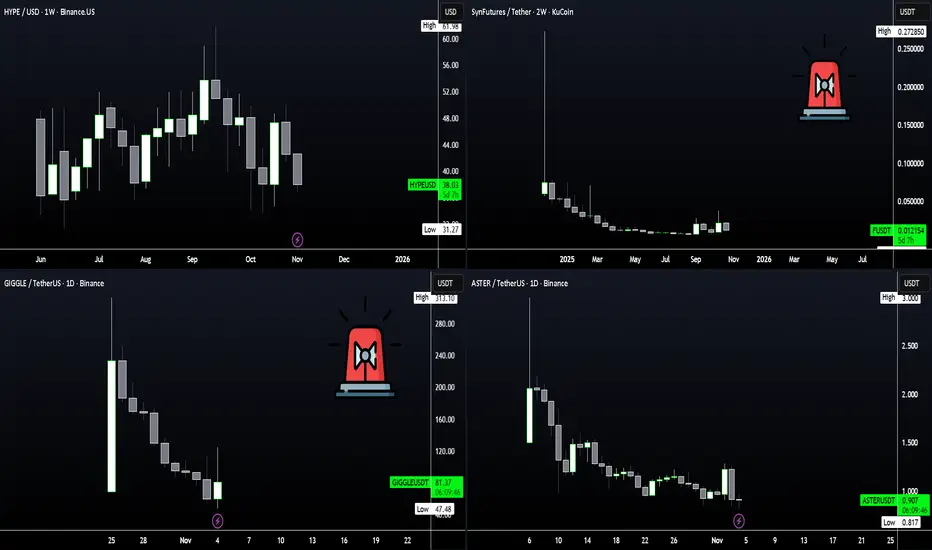
How To Trade NEW ALTS - SECRET PATTERN !!New Alts - a Pattern
Newly released alts all seem to follow the same pattern, at least for the first few weeks. From the frontpage chart, you'll notice a very interesting "fractal" if we can call it that.
It goes something like this:
🚀 Opening Candle 💥 Top Out 👇 Hard Drop ❕ Re-enters opening price or goes under 🔁 Bottoms out (HERE IS WHERE YOU BUY) 🚀 Higher Highs follow.
With this said, it seems evident that you should WAIT to buy a coin that has just been released on the exchange. Although you could try to jump in to the moving train, the risk is simply too high if you do not already have a position.
ALTS that have already retraced, bottomed out and establishing higher lows. These alts you could easily preset TP targets from 15% onwards, depending on your risk appetite.
📈HERE are some examples:
JTO, almost there:
RVF, full retracement and beyond (This could be a warning sign as a liquidity drain)
RAY, clear bottom, full retracement, approaching re-accumulation zone:
ADA, full retracement, hard bounce, approaching key re-accumulation zone:
ALWAYS remember to take caution in the volatile world of crypto with a SL and reasonable targets. Remember that trading newly released alts and memecoins greatly increase the risk on top of the existing risk of crypto.
ROSE – Bullish Setup Triggering LSE:ROSE – Bullish Setup Triggering 🚀
After fighting through short-term noise (thanks, #BTC dip under 107K), ROSE just printed a clean double bottom at $0.01430.
Why this matters?
✅Strong bullish pressure despite market weakness ✅Privacy narrative heating up (timing is everything) ✅Fundamentals? Still a top-tier project, not just hype
Next potentiel levels?
🎯 0.0220 → 0.0230 → 0.0260 $
Long-term confirmation needed:
🔹 Daily close & breakout above 0.02100$
🔹 If this holds? Potential for serious multiples like $ZEC.
My take? This could be a gift of an entry, but safer to wait for confirmation.
Patience pays.
Long term, confidence & HODL even more!💎
Not a financial advice. #DYOR

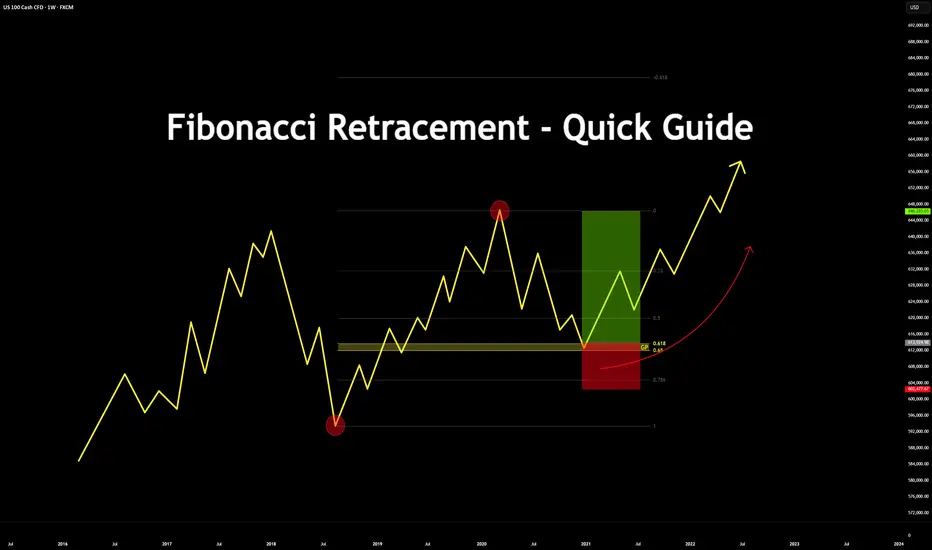
Fibonacci Retracement - Quick Guide in 5 StepsTrading the Fibonacci Retracement - Quick Guide in 5 Steps.
What is the Fibonacci tool?
The Fib Retracement Tool is a tool used widely across many charts. From crypto to stocks.
It assists in identifying the Golden Pocket, along with any potential Support and Resistance zones based on the sequence in Fibonacci.
Investors & Traders draw it from a previous high/low or low/high.
On a chart, each key level shows where price might pause or reverse during a pull back, before it continues the trend.
In this guide you will learn how to use the Fibonacci tool in 5 steps.
1. Configurations
Open up your Fib Retracement Tool's settings, apply the below configurations.
(You can change the color to your choice)
2. Identify High/Low's
Identify, recent highs and lows of your current chart/pair.
3. Applying Fib Retracement
Select your Fib Retracement tool. Place it on your chart starting from the swing low to the swing high.
4. Once completed
Highlight the Golden Pocket Field in the zone (0.65-0.618)
5. Review Entry
Price will eventually make it's way back down to the Golden Pocket to retest and reverse.
SL Placement would be on a previous low or key level, TP placement would be at a previous high or key level.
Bonus:
See the real time example below:
Please like, comment and follow if this guide was useful to you.
If you have any requests on analysis or tutorial requests, let me know and I'll be happy to make one!
ZK - TP4 HIT IN SHORT! WHATS NEXT?? NYSE:ZK TP4 hit almost in my short position 🔥📉
Following my plan, I'll take a long entry around 0.0450 - 0.04600$!
Bull reaction can be expect here!
Not financial advice. #DYOR

USDT.D Eyeing Resistance, Altcoin Holders Stay Alert!USDT.D is trading right at the edge of a breakout near the resistance zone. If it manages to break above, we could see another sharp drop in altcoins in the coming days.
However, a rejection here might give altcoins some much-needed breathing room.
DYOR, NFA
#PEACE

$TOTAL Crypto Market Cap DANGER ZONESame same, but different.
Crypto CRYPTOCAP:TOTAL Market Cap is still indecisive...
playing with fire within the DANGER ZONE 🔥
Bulls need back above the 20WMA and .236 fib ASAP
Clock is ticking 🕘
