ETH back above resistanceCRYPTOCAP:ETH megaphone channel is being respected as we approach the upper boundary after overcoming resistance High Volume Node now support.
The daily pivot will also proof tough to overcome and there should be no clean breakout to all time high as we climb the wall of worry from all of the cycle top nonsense... FEAR
Price tested the daily 200EMA as support, normal behaviour and printed bullish divergence from oversold W to Y.
Safe trading
Altseason

BNB respecting the trend-lineCRYPTOCAP:BNB tested the lower boundary support line and caught a bid flipping bullish market structure.
Daily RSI printed bullish divergence from the EQ where price continues to find a bottom
Even during the flash crash price only tested the 0.382 Fibonacci retracement demonstrating the power of the macro uptrend and token reliability
Analysis is only invalidated below the trend-line. Elliot wave count is particularly difficult on BNB but it appears a macro wave 5 is underway which can extend for months.
Safe trading

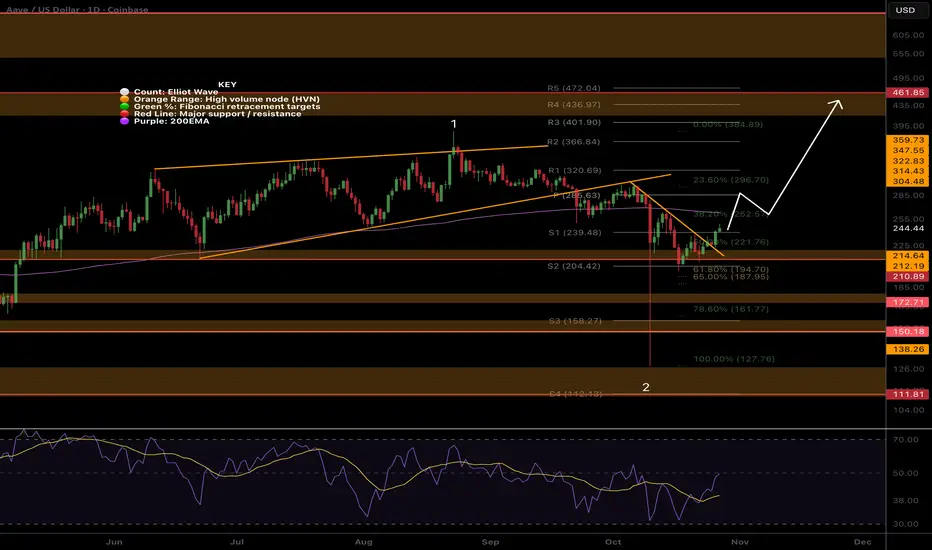
AAVE Bullish structure from supportEURONEXT:AAVE has printed bullish structure from support but the daily 200EMA looms ahead, once cracked AAVe should move well. Price tested the golden pocket Fibonacci retracement.
AAVE did not pullback as much as most alt-coins and is expected to be one of the first to break into all time high / price discovery. First target is $460 High Volume Node.
Daily RSI almost hit oversold twice in what looks like a double bottom
Analysis is invalidated if we drop below $187
Safe trading
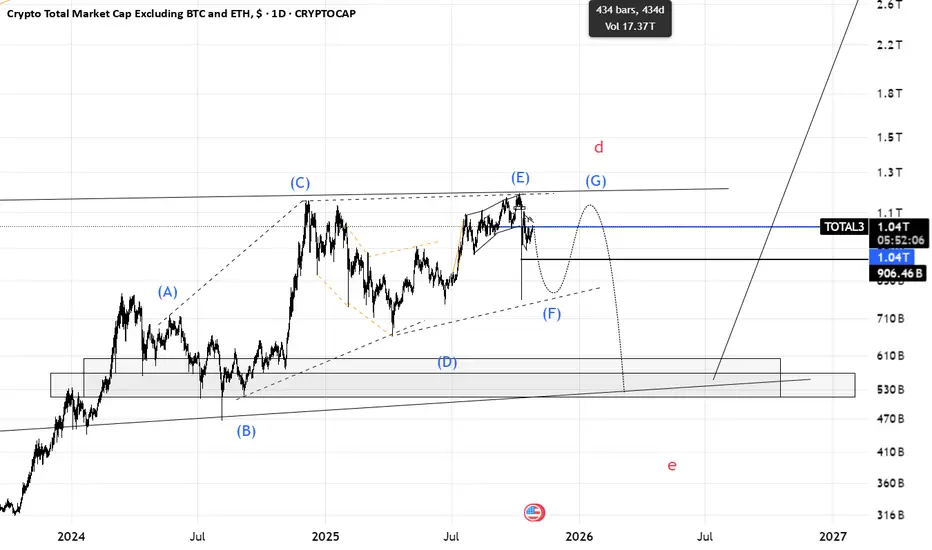
Total3(based on NEo wave)I think this branch is diametric. in last chart I thought its a triangle but its a diametric.
we should for wave F to finish and wave G to start then there is a heavy bearish wave for total3 and altcoins.
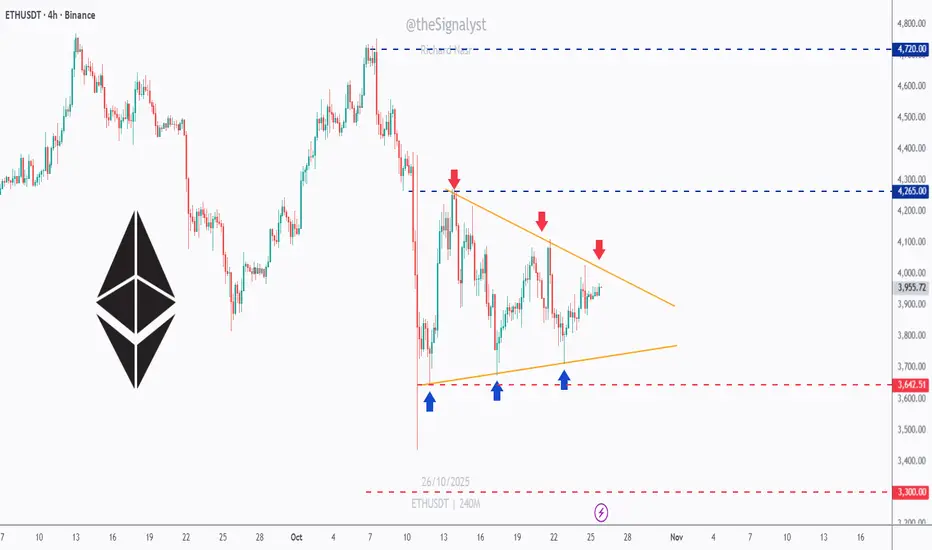
ETH - The Symmetrical Triangle of the Month!Ethereum has spent most of October coiling inside what can only be called the symmetrical triangle of the month => a textbook compression of volatility where both bulls and bears are building pressure for the next decisive move.
📦Price is trapped between the $4,265 resistance and $3,640 support, with multiple clear reactions from both boundaries. Each time ETH bounces off the lower orange trendline, buyers step in aggressively… but every push higher has been capped by lower highs, a perfect battle of strength versus patience.
The breakout from this formation will likely dictate ETH’s next major swing.
- A break above $4,265 could ignite a rally toward $4,720 and beyond.
- A break below $3,640, however, would expose $3,300, a strong historical demand zone.
⚔️ Until one side wins , it’s all about staying patient, waiting for confirmation, and letting the structure do the talking. The tighter this triangle gets — the bigger the breakout tends to be.
⚠️ Disclaimer: This is not financial advice. Always do your own research and manage risk properly.
📚All Strategies Are Good; If Managed Properly!
~Richard Nasr
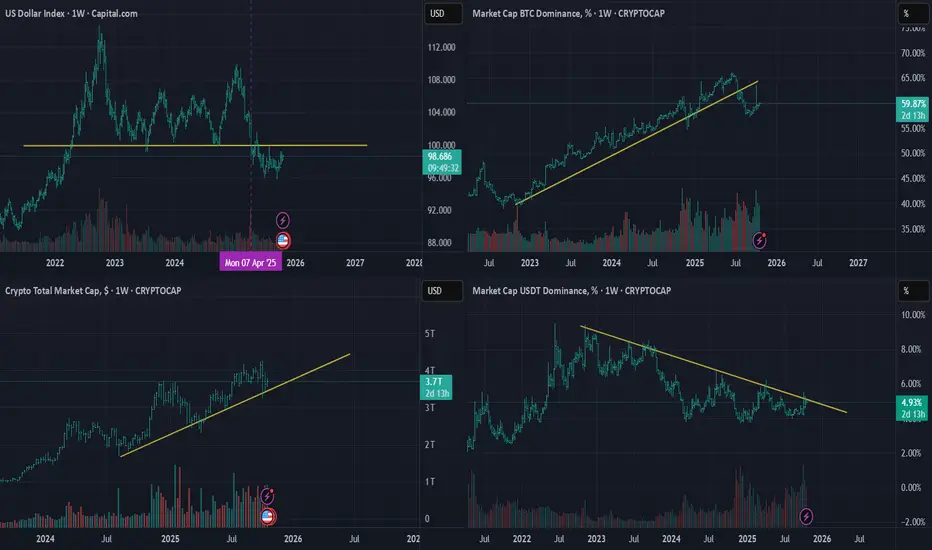
USD Index, BTC Domination, Crypto Total Market USDT Domination Hi everyone,
I just noticed a rare and exciting opportunity — the global market indexes are currently in sync in favor of altcoins.
All the charts are lining up perfectly, and to me, this looks like one of the best times to enter the market or add to your existing positions.
Wishing you all the best! :)
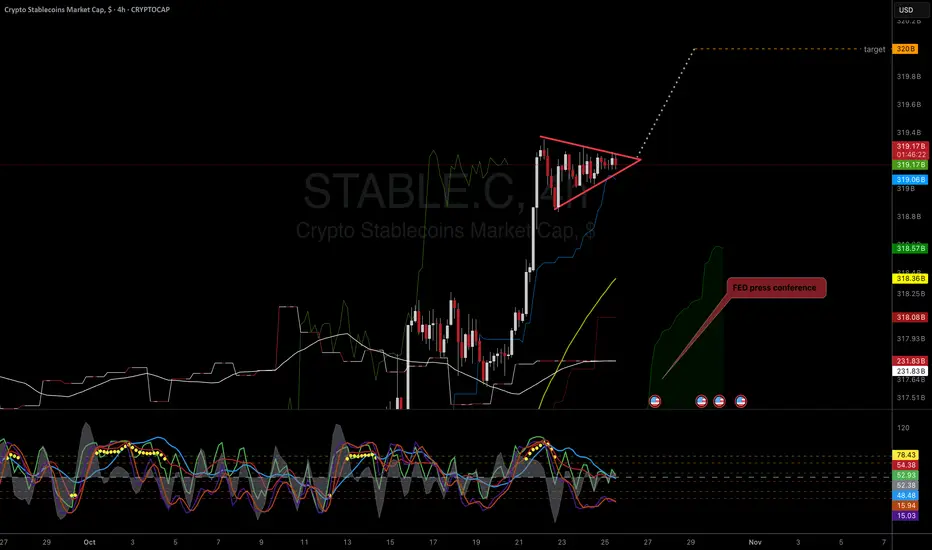
STABLES Market Cap to 320B Afternoon my friends,
Do NOT think the stable coin market cap is headed towards a downtrend. So, to me, we pump next week and break above the 320B market cap. If this happens, we can expect a very nice relief rally across the crypto market.
Lets hope it delivers!
Trade thirsty, my friends!
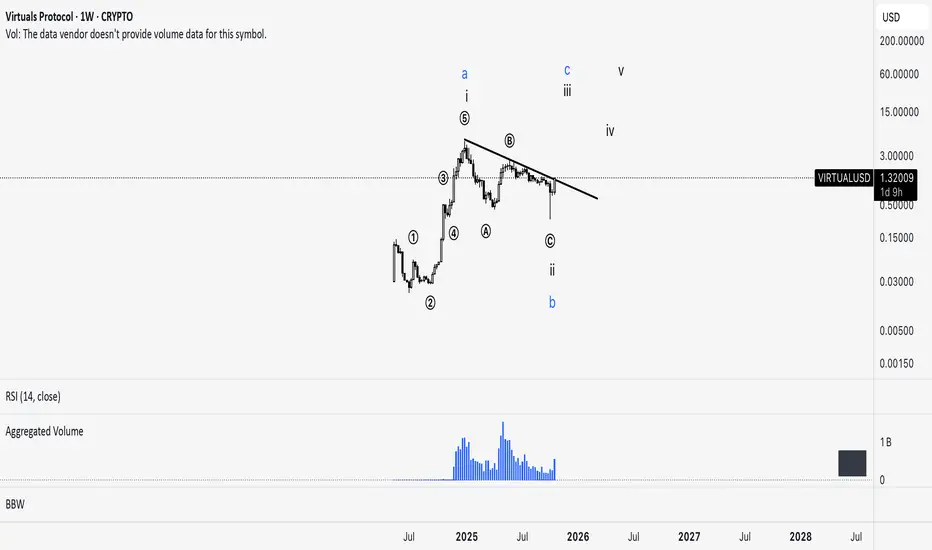
VIRTUALS – wave 3 in progress?VIRTUALS is currently trying to break through its downtrend line with increasing volume. The decline from January to October 2025 can be seen as an ABC zigzag forming wave 2 within a larger impulsive structure. Could this mean we’re just starting wave 3? The risk/reward ratio isn’t very favorable at the moment, but any pullbacks could be viewed as potential buying opportunities.
AITECH – parabolic advance soon?Trading doesn’t have to be difficult. Elliott Wave Theory provides clear, logical invalidation levels and targets. It also shows that the biggest and fastest profits usually come from wave 3 — especially from subwave 3 of wave 3. That’s the best possible setup. Is that exactly the situation we’re seeing on the AITECH chart? The risk is limited — stop loss at 0.018, with targets at 0.13, 0.26, and higher.

KGEN - PERFECT SETUP. SET:KGEN - update:
perfect; Almost -30% down from resistance zone given! 🔥
If the 0.2550 - 0.2600$ support zone hold, then bull could push price higher. Volatility is huge, and price remain stuck under big levels. Not a safe bet to me.
#dyor #trading

Total2 \ AltcoinsTotal2 HTF is also forming a strong reversal pattern.
The fall trend breakout and retracement process have been completed, with the price holding steady above MA21 and the uptrend.
The 2021 ATH region has still not been breached, but the current structure is at the beginning of a new expansion phase.

DOGE - BULLISH BREAKOUT AWAITEDCRYPTOCAP:DOGE - price analysis:
Similar vibes as yesterday:
Neutral PA, and price remain stuck under many big resistances.
I see a potential daily uptrend channel .
Hence, Bulls may be in control above the 0.1800$ - 0.17500$ suppor (daily basis).
Above this level, I can expect to see a bull breakout to visit upper resistances:📈
🎯0.2280
🎯0.23500
🎯0.25500
🎯0.26400 (to fill the previous gap)
Sum up:
My bias: bullish inside the uptrend channel daily 📈
In case of bearish candle close daily under 0.17500$, would love control ==> Lower key demand zone: 0.1650 - 0.1400$
Medium term outlook & possible setup in my chart.
. Timing is important. #DYOR

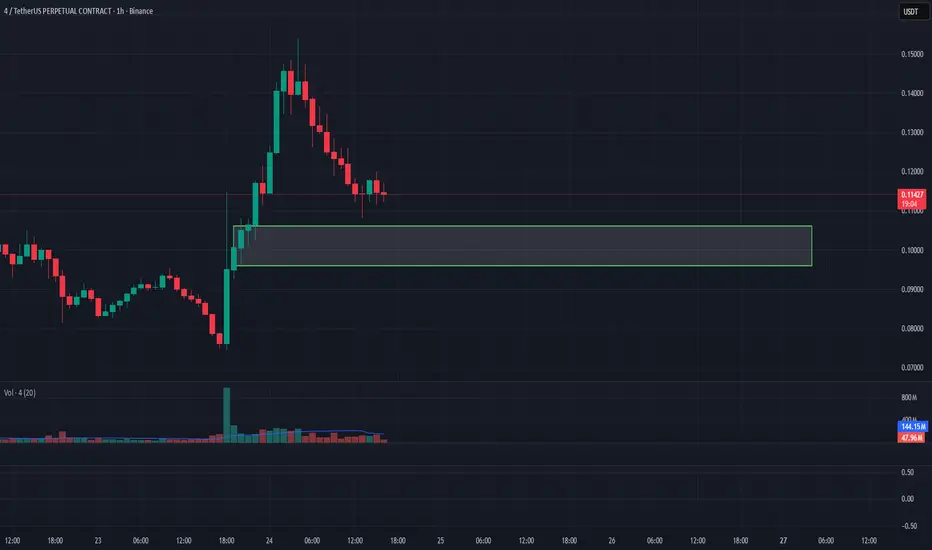
4/USDT Analysis. Long Setup
For this asset, we’ve noticed strong buyer activity, while during the pullback volumes are almost absent, suggesting a momentum-based decline rather than active selling.
Below the current price lies a strong volume zone at $0.106–$0.096 — a bullish reaction from this area could trigger a long setup with an initial target at $0.16.
This publication is not financial advice.
MYX - BULLISH LEG UP INCOMING? Is LSE:MYX ready for another leg up? 🚀
Technical analyses outlook:
-Bull div RSvI Daily ✅
-Solid support forming above the 2.500$ level✅
-85% down from Triple TOP weekly resistance!
-H1 Triangle structure Breakout ✅
-Bullish morning star candle daily? 💣
In my opinion, as long as prices consolidate above the green zone , we could see another bull rally like 50%+! 📈
Do you have Any informations about the project, dev etc...?

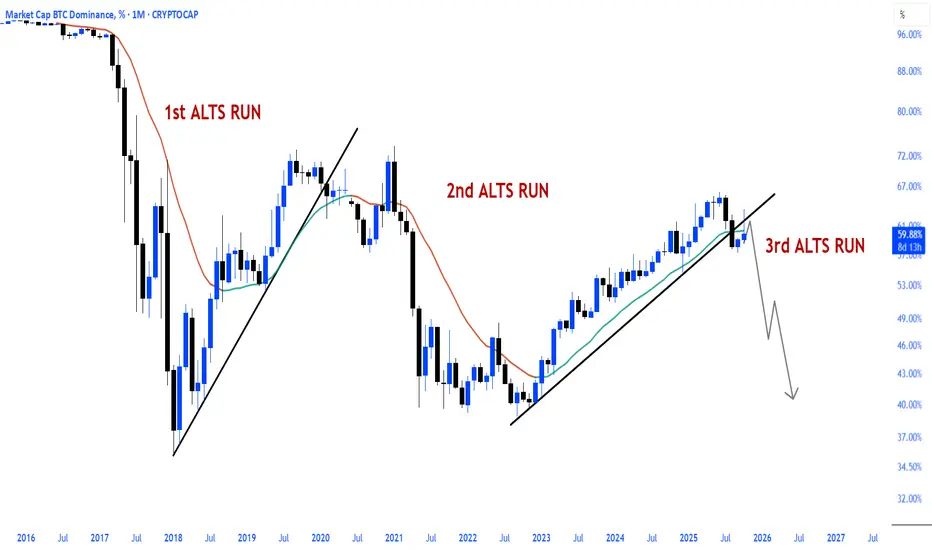
$BTC.D down $BTC up : ALTS run.CRYPTOCAP:BTC.D down CRYPTOCAP:BTC up : ALTS run.
Bitcoin dominance has broken down from its major uptrend and is currently in a retest.
It's important to remember that dominance alone isn't an altseason indicator; the key is for dominance to decline alongside Bitcoin's rise.
When this scenario plays out, a healthy altcoin season, as seen in the past, will resume.
So why did Altseason start in 2017 when BTC was falling?
1. Capital Rotation from Bitcoin to Altcoins
When Bitcoin approached $20,000 at the end of 2017, investors fell into the mindset that "BTC has risen too much, altcoins are cheaper."
Those who realized their profits sold Bitcoin and moved to altcoins.
So money didn't leave the market — it just changed direction within it.
That's why altcoins soared even as BTC fell.
2. New investor influx and FOMO
New investors entering crypto at that time turned to coins like Ethereum, Ripple, IOTA, ADA, and NEO, saying "Bitcoin is expensive."
New money flowed directly into altcoins.
So even as Bitcoin fell, the total market value continued to grow.
3. The historic collapse of dominance
BTC dominance fell from 65% in December 2017 to 35% in January 2018.
This was the sharpest "altcoin rotation" in history.
In short, everyone was "dumping their BTC profits into altcoins."
4. The ICO boom
Thousands of new projects were issuing ERC-20 tokens.
Demand for Ethereum skyrocketed because everyone was participating in ICOs with ETH.
This accelerated the shift from BTC to ETH and ignited the altcoin bull run.
5. Liquidity staying in the market
The stablecoin ecosystem was not yet developed (USDT was limited).
So when investors wanted to take profits, they were fleeing to altcoins instead of cashing out to fiat.
This caused altcoins to shine.
$OTHERS possible scenariosIt’s decision time for CRYPTOCAP:OTHERS , arguably the most accurate index to gauge the true altcoin market.
We’re now testing the $220 billion level, a critical support zone.
From here, two paths emerge:
either we bounce and start a meaningful trend reversal,
or we break down and revisit the wick from October 10, 2025.
Either way, altcoins may have to bleed a bit more before finding stability.
A massive head-and-shoulders pattern is clearly taking shape — and its theoretical target is near zero (no joke).
If this setup isn’t invalidated soon, we could be heading toward a major correction.
Let’s hope the $220B neckline holds strong.
If it fails, we might be watching the crypto equivalent of the dot-com crash — a potential black swan in the making.
Interestingly, the previous cycle also formed a similar head-and-shoulders pattern pointing to zero.
In reality, the downtrend bottomed out around $82 billion, not zero — so let’s hope history rhymes rather than repeats.
This time, the bad scenario suggests a bottom near $160 billion, which could mark the final stage of the altcoin bear market.
DYOR
#Altcoins #CryptoMarket #OTHERS #CryptoAnalysis #Bitcoin #Ethereum #CryptoCrash #HeadAndShoulders #MarketAnalysis #CryptoTrading #AltcoinSeason #TechnicalAnalysis #CryptoInvesting #BearMarket #CryptoNews #BTC #ETH #CryptoCycles #TradingView #MarketUpdate

AVAX : Under the priceHello friends
well, technically, this currency has hit its resistance and formed a double top pattern, and here we have found good and strong support, which can be purchased in stages with capital and risk management, and moved with it to the specified target.
From this perspective, you should note that this currency is currently trading below its intrinsic value, and given that it is a good project, there is a good opportunity to buy it with this decline.
*Trade safely with us*

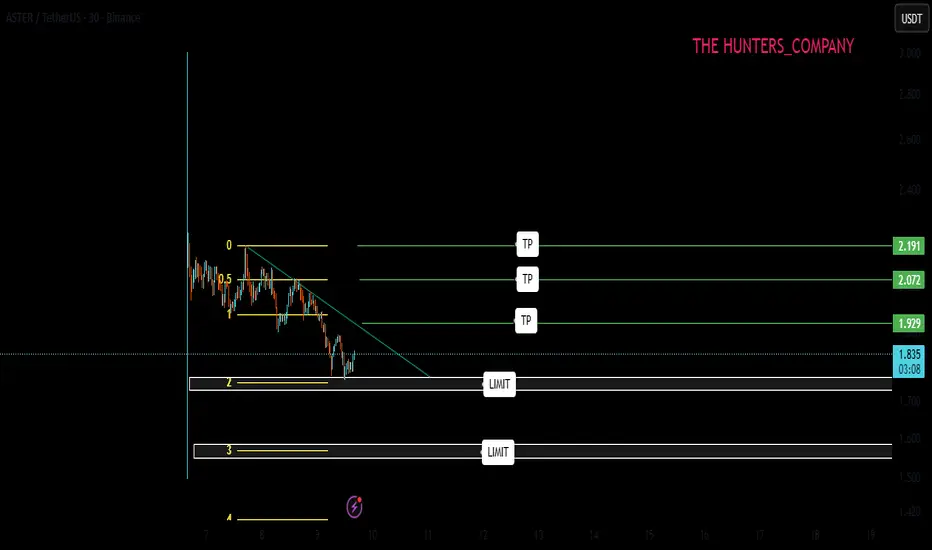
ASTER ; If you have any left, buy it here.Hello friends
We came with the analysis of this trending and noisy currency. Last night I wanted to give you the signal. Anyway, we are going to use it now, of course, with risk and capital management.
Well, you can see that after the listing of this currency, we witnessed a sale and in the identified support areas, buyers were able to provide good support for the price and considering the good pattern that is being created, we can buy in steps.
We have also set goals for you.
Observe capital management.
*Trade safely with us*
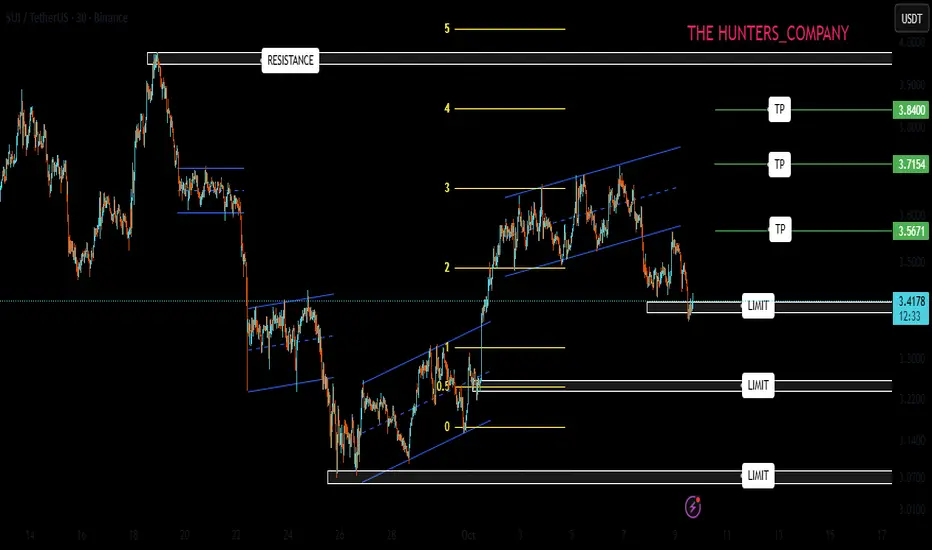
SUI/USDT ; A decline is the best buying opportunity.Hello friends
Given the price decline that we are witnessing, the price has created good channels at the specified support and buyers have entered and supported the price, which is a good sign for the currency.
Now, given the trend reversal and the price being pushed up by buyers, we can buy in steps with risk and capital management and move towards the specified targets.
We have also identified an important level that if the price reaches it, a correction can be expected and it is very important to take profits in these areas.
*Trade safely with us*
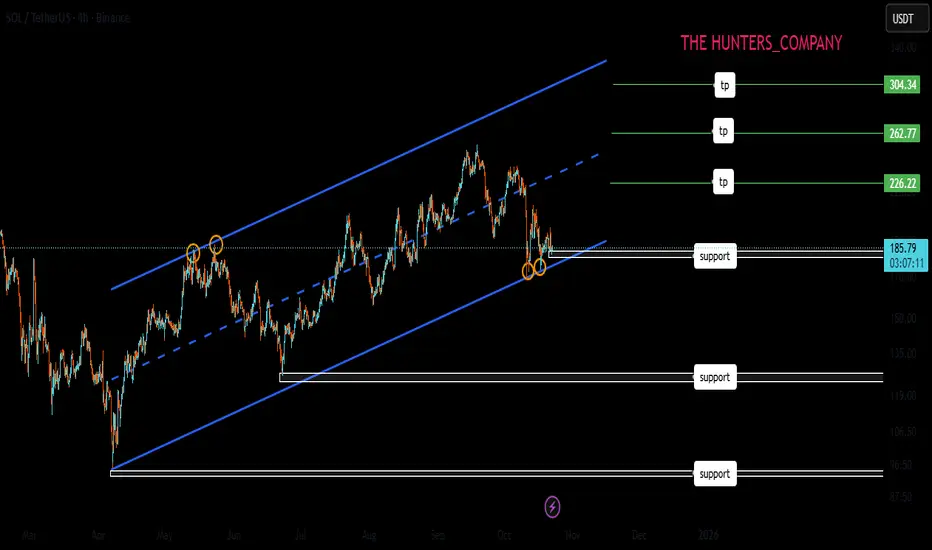
SOL ; What can be done?Hello friends
Given the decline we had, the price has been moving in an ascending channel for some time now, and now that the price is at the bottom of the channel and is on an important move, we can buy one step with risk and capital management, and in case of further correction, we can buy another two steps down and move with it to the specified targets.
*Trade safely with us*
$BTC about to collapse?Hey traders,
I Hope you are doing good!
As a continuation of my last CRYPTOCAP:BTC analysis ( ) I bring you a new fresh Bitcoin scenario.
In this case, my thoughts have changed. In my opinion what we saw last Friday was just the beginning of an early bearish movement.
The price tried to rebound and show some strenght but it failed and is falling to new lows.
Of course, momentum changes so fast and my setup could be invalid if we head to 116.000 USD and close above this week. However, in my opinion thats not likely to happen.
Im not talking about a short bearish movement but an actual 3 -6 months bear market.
My targets? Hard to say. But I see some interesting zones at 60 - 80K where I will start to buy some Bitcoin.
This scenario obviously applies to SP500 and Nasdaq.

$BTC.D Death Cross Has Occurred! The Signal on ₿itcoin Dominance We've Been Waiting All Cycle For 🔥
20 / 50 WMA Death Cross has officially occurred on CRYPTOCAP:BTC.D
So close to Alt Season I can taste it 😋

ETH 6K to 8K !? My analysis atm for ETH
Possible to bounce right back to ATH and price discovery mode to 6K hopefully 8K+
What ya all think, drop it bellow ?
