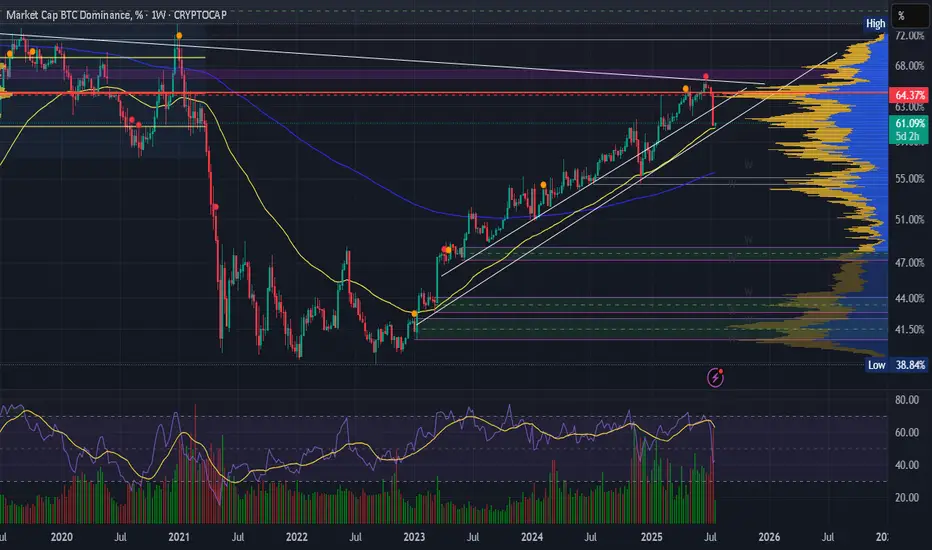
BTC.D Bitcoin Dominance on a bigger timeframe support?
This is my first time posting an idea, therefore not an expert, I hope the graphs show right.
Seeing a weekly chart, I see another support across the levels of March 6th, Dec 2nd and the current level. Could this have been only a warm up for the altseason? Do we have to wait for the week of August 25th?
CRYPTOCAP:BTC.D
If you check the Weekly chart for TOTAL3ESBTC, the week of August 25th could provide another support at 0.255.
The exact point we are hitting now is the POC for the beginning of 2019 up to today.
Altseason2025
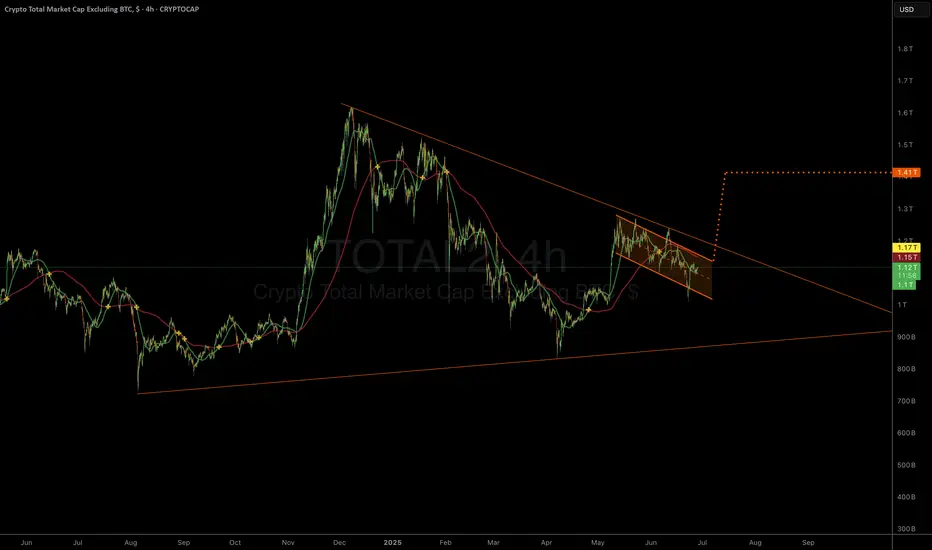
When Altseason? Clues in other chart Ex) #1Hi guys.
So Its no secret bitcoin has been ripping.
We are at new all time highs, and in full on price discovery mode.
I recently posted an ongoing macro analysis on ADA (Cardano) supporting my theory that it is one of the better alts to be investing in for alt explosion.
I want to look elsewhere to see if i can find supporting evidence that its time to invest or trade altcoins.
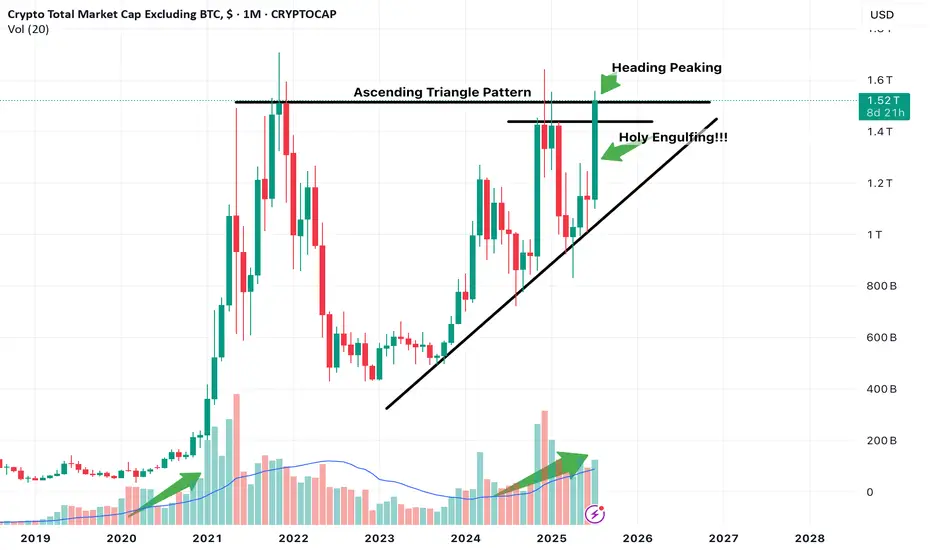
One chart that can be used is the Total Market Cap of Crypto excluding Bitcoin.
This chart showcases total altcoin market capitalization and its movements.
I believe certain Technical developments can really help us gauge at whats to come.
NOte this is on the 1 Month timeframe aka looking into Macro developments.
Just focusing on Candlestick action.
Notice we have been in this ascending channel trend, along with a potential Ascending triangle pattern development which if breakout occurs with confirmation can push Altcoin market cap higher indicating that liquidity is entering altcoins which indicates potential Uptrend.
The month of July so far is in position to print a massive engulfing Bullish candle, which is a great sign.
The upper part is also peaking its head above the Horizontal resistance line. Need to observe confirmation of this breakout. Look for it in smaller timeframes, ill look for it in the 3 day or 5 day.
We are also in position to print a higher high first time in a while.
Notice also Volume. We are seeing currently similar increasing volume as previous alt coin market cap expansion.
Keep an eye out on more posts to add to evidence that supports we are in the verge of potential altcoin season.
NEAR Swing Long Idea - Altseason 2025📌 Fundamental Sentiment:
The entire crypto market is rallying, alongside other risk assets. This is mainly driven by U.S. policy expectations — Trump is pressuring Powell to resign and aggressively pushing for rate cuts from the Federal Reserve.
📌 Technical Analysis:
NEAR has recently broken and closed above a significant HTF support/resistance level.
Additionally, we’re now trading inside the 0.75 Fibonacci retracement level of the HTF bullish trend — which I define as the maximum discounted zone.
For this setup, I’ll apply my Deep Range Theory (DRT):
If price dips below the 0.75 zone and accumulates there,
Then breaks above 0.75 after a period of consolidation,
→ It signals that price aims for the 0.5 level of the range and will likely run HTF liquidity for either reversal or re-accumulation before continuation.
📌 Gameplan:
✅ Break and close above HTF S/R
⏳ Waiting for break and daily close above 0.75
🔄 Retest to LTF demand (4H–1H)
📈 A bounce on LTF demand will trigger the long setup
📌 Trade Management:
This is a mid-term swing trade, as I’m following the HTF bullish trend.
🎯 Target: $5 — which is approximately a +70% move from current price.
❗Risk Management:
If price makes a daily close back below 0.75 after breaking and closing above, I will exit the trade to preserve capital.
I’ll also monitor macro sentiment closely. If there's a sharp bearish shift, I may consider an early exit before reaching the HTF target.
—
🔔 Follow the channel for daily trade ideas & weekly macro recaps.
💬 Drop a comment below if you have any questions or insights!

HYPE Swing Long Opportunity - Altcoin Season📌 Fundamental Sentiment:
The crypto market — alongside broader risk assets — continues to gain traction. This momentum is largely fueled by rising expectations of policy shifts in the U.S., with Trump intensifying pressure on Jerome Powell and advocating for aggressive rate cuts from the Fed.
📌 Technical Analysis:
HYPE is approaching a key HTF bullish trendline, and confluences are stacking up in the same region:
✅ HTF Demand Zone
✅ Equilibrium (EQ) of the HTF bullish trend
✅ Bullish Trendline Support
These three HTF confluences overlapping at the same price zone indicate a high-probability setup for a significant bounce and a possible swing long opportunity.
📌 Gameplan:
Price hits HTF bullish trendline
HTF demand zone gets tested
EQ level tapped → discount offered to buyers
📌 LTF Confirmation Criteria:
I’ll wait for:
A 1H swing break
A strong 4H rejection candle
These will confirm momentum shift. If confirmed, I’ll enter a swing long.
🎯 Target: $60
💰 Potential gain: ~+50%
❗ Stop-loss: Below the swing low that triggers the LTF confirmation
—
🔔 Follow for daily setups and weekly macro recaps
💬 Drop your chart or questions below!

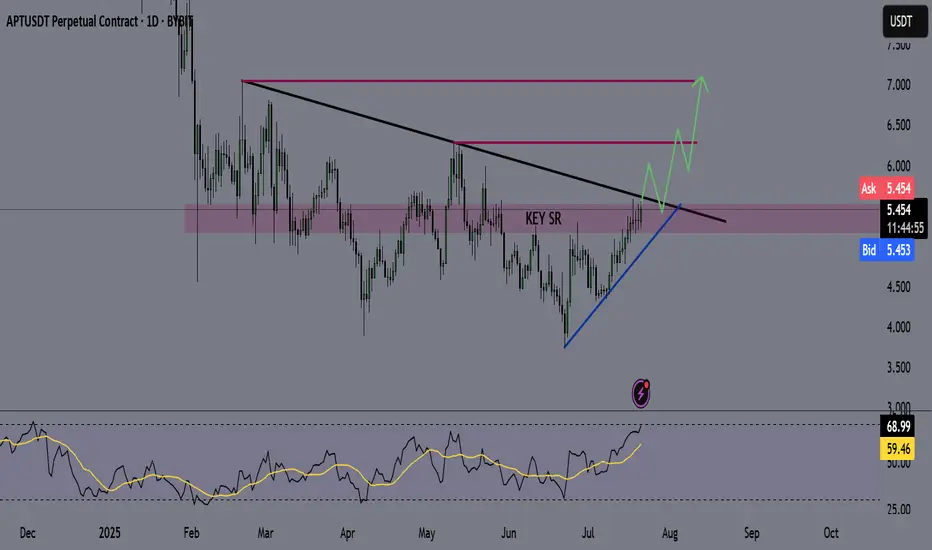
APT - APTOS Coin - Swing Long Idea📌 Fundamental Sentiment:
The entire crypto market is rallying, alongside other risk assets. This momentum is largely driven by U.S. policy expectations — specifically, Trump’s increasing pressure on Powell to resign and aggressively push for rate cuts from the Federal Reserve.
📌 Technical Analysis:
Price is currently testing the HTF supply zone with strong momentum. Additionally, it’s approaching a long-term bearish trendline that has dictated the downtrend since February 2025.
📌 Gameplan:
I want to see:
A clean breakout above the HTF supply zone with daily candle closure.
A confirmed break and close above the HTF bearish trendline on the daily timeframe.
If both confirmations align, I’ll start preparing for swing long setups, potentially riding into the early stages of a 2025 altseason.
—
🔔 Like & Follow for more daily updates. Feel free to drop your thoughts in the comments!
Altseason Loading?BTC Dominance chart has once again respected the long-term descending trendline resistance, showing a sharp monthly rejection. Historically, similar rejections have marked the beginning of ALT seasons, where capital flows out of Bitcoin into altcoins, boosting their performance significantly.
Chart Highlights:
-Major triangle pattern since 2017
-Clear rejections from the upper trendline coincide with previous ALT seasons (2018, 2021)
-Current rejection resembles those past cycles
-A move down in dominance could fuel strong altcoin rallies
If BTC dominance continues to decline, we could be entering another powerful altcoin season in the coming months.
Cheers
Hexa🧘♀️
CRYPTOCAP:BTC.D BINANCE:BTCUSDT

ETH Weekly Recap & Game Plan 20/07/2025📈 ETH Weekly Recap & Game Plan
🧠 Fundamentals & Sentiment
Market Context:
ETH continues its bullish momentum, driven by institutional demand and a supportive U.S. policy environment.
We captured strong profits by sticking to the plan (see chart below).
🔍 Technical Analysis
✅ Price has run into HTF liquidity at $3,750
📊 Daily RSI has entered the overbought zone, signaling potential short-term exhaustion.
We may see a brief retracement or LTF liquidity grabs, which could be enough to fuel a further push higher — potentially to $4,087.
🧭 Game Plan
I’m watching two key downside liquidity levels:
$3,534 (black line)
$3,464
A sweep of either could provide the liquidity needed for continuation toward $4,087.
⚠️ I’ll wait for LTF confirmation before entering a position.
📌 Follow for Weekly Recaps & Game Plans
If you find this analysis helpful, follow me for weekly ETH updates, smart money insights, and trade setups based on structure + liquidity.

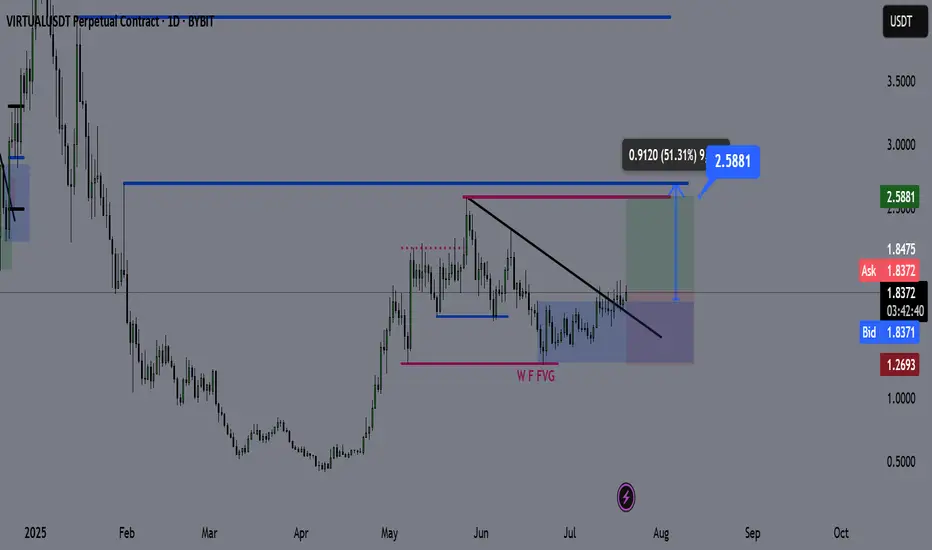
Virtual Coin – Technical Outlook & Trade Plan🔍 Technical Analysis
✅ Price has broken and closed above the bearish trendline, indicating a shift in market structure.
✅ It’s currently consolidating above the trendline, and each retest is showing strong bullish reactions.
✅ The bullish daily demand zone is holding aggressively, reinforcing upward momentum.
I do not expect a significant retracement from here until we reach the purple line (2.59). The current structure suggests price wants to seek higher liquidity.
📌 Trade Plan
Entry: Current market (above trendline + demand zone reaction)
Take Profit (TP): 2.59 (Purple Line)
Stop Loss (SL): 1.26 (Daily Close Below)
📊 Bias: Bullish
🕰️ Timeframe: Daily
📍 Invalidation: Daily close below the demand zone and trendline support
💬 Feel free to share your thoughts or ask questions below!
is AltSeason Started ????"The altcoin season has likely begun! We're currently witnessing Bitcoin's dominance chart breaking down at a critical juncture, and this cycle may surpass even our most optimistic expectations. The technical signals are remarkably clear and verifiable for most seasoned traders. In these market conditions, the wisest strategy is to hold strong with conviction – maintain your positions and trust in the assets you've carefully accumulated. This could very well be the start of an extended altcoin rally that rewards patience and strategic positioning. #AltSeason #CryptoMarket #BTCDominance #HODLStrategy"

OFFICIAL TRUMP Main trend. 16 05 2025Logarithm. Time frame 3 days. After a super pump and a drive of "stupid money", a descending channel was formed on a natural dump. The price came out of it. Now a triangle is forming. The price is clamped. The reversal zones and percentages to the key support/resistance levels are shown extremely accurately according to TA.
If there is no aggressive exit in the medium term, then there will be consolidation and, as a consequence, the formation of a horizontal channel "sholtai / chattai", its key zones are shown.
Now, this "cryptocurrency" is now on 16 05 2025 in 41st place by capitalization.
Reductions from the price highs are about -90%.
From the liquid zone about -84%.
These are not the minimum values of the decline of such hype cryptocurrencies. Just take this into account in your money management. For clarity, the level zones and the % of potential decline if the trend breaks again are shown on the chart (pull the chart down).
Even with such a decline, the price is now at a huge profit. I am not speaking for the creators of the cryptocurrency, but for the first speculators and "investors" who may not have sold everything on the hype.
For the creators of the cryptocurrency, perhaps these are manipulators close to the Trump family, for them, any sale is super profit. But in order to sell, you need to maintain liquidity, and from time to time make interest in speculation and asset retention by investors, that is, do pumps and hype. Use this, and do not be greedy...
Levels and zones, pump/dump, which the price will "feel" are shown in advance. Click "play" on the chart and move the chart up. With a high degree of probability, the hype and pumping of the price of this cryptocurrency will be repeated, given the hype and the long term of the political figure whose name this cryptocurrency bears. Now it is a Trump dump, in the future it will become a Trump pump for some time.
Do not forget to sell on the next hype. If you understand that you are very greedy, and the news background affects you, then sell in parts, or use stop losses to protect profits.
There is no need to guess the minimums and maximums. It is important to know these zones, and have an acceptable average price, from the position of the trend, and its potential. It is regulated by the distributed entry volume (in advance) at potential reversal zones.

Solana - The Cup is Almost FullSolana is printing a textbook cup & handle formation on the daily, and price is now pressing against the neckline resistance near $185, just below the psychological $200 zone.
This structure reflects months of accumulation and rising momentum. A confirmed breakout above the $185–$199 resistance would likely trigger the next upward leg.
This setup signals trend reversal continuation, and if SOL closes above $199 on high volume, momentum traders may pile in quickly.
📌 Invalidation below $150 = pattern risk-off.

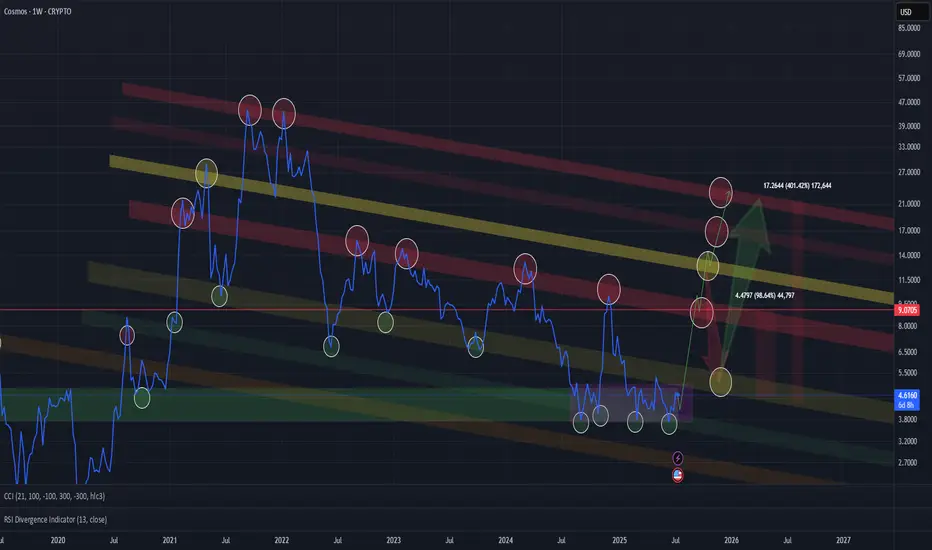
ATOM (COSMOS)🔹 Accumulation Phase in Play
We’re currently sitting in a clear accumulation zone — price is holding steady, showing signs of position-building by stronger hands.
📈 The next key areas are distribution zones, all of which are already marked on the chart. If you're entering a position now, odds are high you'll be able to secure profits as we move up. Just make sure to set a stop-loss — and don’t get greedy if you're aiming for the top.
⚠️ Even though it’s less likely, there’s a small chance of a shakeout near the yellow zone, but I personally doubt it — the market is already heavily shaken, sentiment is fearful, and many have been waiting for a move for too long.
🕰️ We’re also running out of time — the 4-year cycle is coming to a close by the end of this year. Historically, this aligns with significant market moves
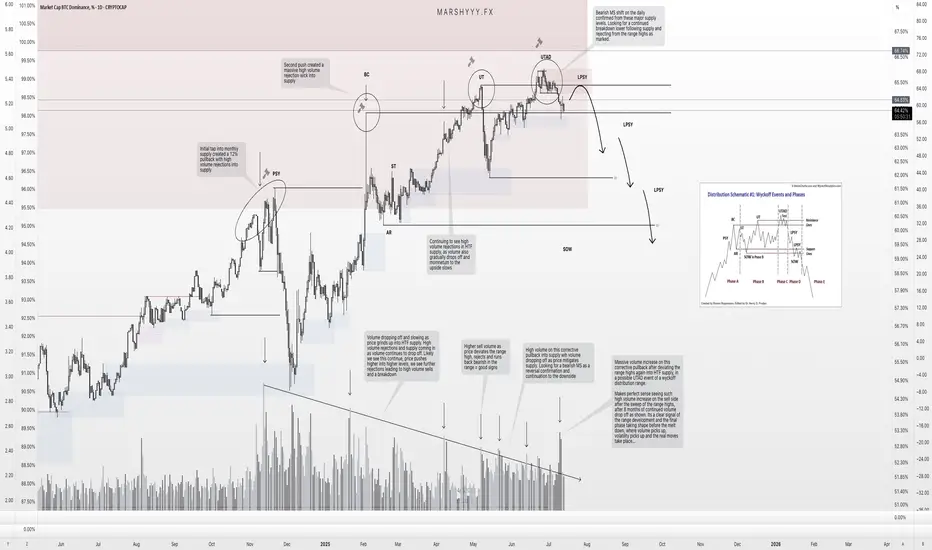
BTC.D – Distribution Confirmed. Is the Final Altseason Next?Over the past couple of months, I’ve been tracking the development of a potential high time frame (HTF) Wyckoff distribution range forming on BTC Dominance (BTC.D), and it’s now looking like that structure is starting to break down.
Back on June 14th, I noted that while we hadn’t confirmed a trend shift yet, BTC.D was showing strength and likely to push into the 65% region, with altcoin weakness to follow. The very next day, I shared my idea of a potential Wyckoff distribution forming — and since then, it’s followed that path almost perfectly.
🧠 What’s Happened Since?
✅ Sweep of the HTF range high at ~65%
✅ Second deviation of the highs
✅ Volume divergence into supply — declining volume + strong rejection candles
✅ Formation of a UTAD (Upthrust After Distribution)
✅ 1D bearish market structure break after the sweep
✅ Price now back inside the range
This is textbook distribution behaviour — even if it doesn’t follow the Wyckoff schematic to the letter, the key elements are present: deviation, volume drop-off, and structural breakdown.
🔮 What Comes Next?
BTC.D is currently holding inside a prior unmitigated daily demand, but given the structural shift, I’m expecting:
A pullback to 65–65.5% (daily supply + range high retest)
Then a continuation bearish, targeting:
🔸 49% (prior accumulation range high)
🔻 46% (FVG fill + range breakout retest)
These lower targets align with where I expect altcoins to top out — so as BTC.D breaks down, I expect capital to rotate hard into ETH and alts, triggering the final phase of altseason before the macro cycle top.
⚠️ Why This Matters
This distribution range has been developing since late 2024, and with BTC.D now showing bearish market structure, combined with:
- ETH.D flipping bullish
- OTHERS.D pushing higher
- Stablecoin dominance pairs breaking down
…we’re seeing confluence across the board for a risk-on altcoin environment.
I believe this is the setup that leads to the final euphoric altcoin rotation before the 4-year cycle top prints later this year.
📌 Watch for the retest. Watch for the rejection. The breakdown will be fast.
This is the window — time to stay sharp.
Let me know in the comments if you’ve been tracking this too, or drop your altcoin rotation picks.
— Marshy 🔥
1D:
3D:
1W:
1M:
SAND – Rotation in PlaySAND is showing early signs of strength off the long-term demand zone near $0.23–0.24, where it's been accumulating for several months. Price just printed a strong weekly bounce, up +16%, reclaiming the bottom of the range.
This area has acted as a key base since mid-2023 — with each touch producing a notable reaction. Now trading at $0.286, SAND is attempting to rotate toward the top of the established range.
Key Levels
Support (Range Low): $0.23–0.24 (strong demand zone)
Resistance (Mid-Range): $0.43
Range High: $0.85
A clean flip of the mid-range ($0.43) could open the door to test $0.70+.
📌 Risk management: A break and weekly close below $0.23 invalidates this setup. As long as it holds, the upside potential is attractive from a risk/reward standpoint.
This is a classic accumulation > reclaim > expansion structure. Let the chart speak if the range holds, the rotation is in play.

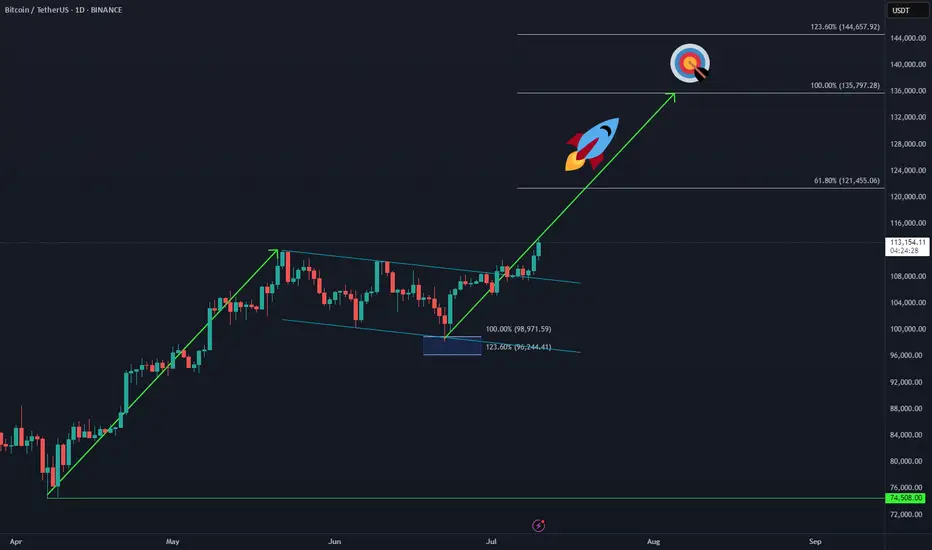
Bitcoin Makes New ATH – Next Sequence in Play 🚀 CRYPTO:BTCUSD has officially broken into new all-time highs, confirming the next bullish sequence is underway.
The upside projection now opens toward the $135K–$144K zone, aligning with long-term Fibonacci extensions and cycle projections.
📌 As always, it won’t be a straight line—expect step-by-step progress, with consolidations and pullbacks along the way. But the structure remains bullish, and the path is unfolding.
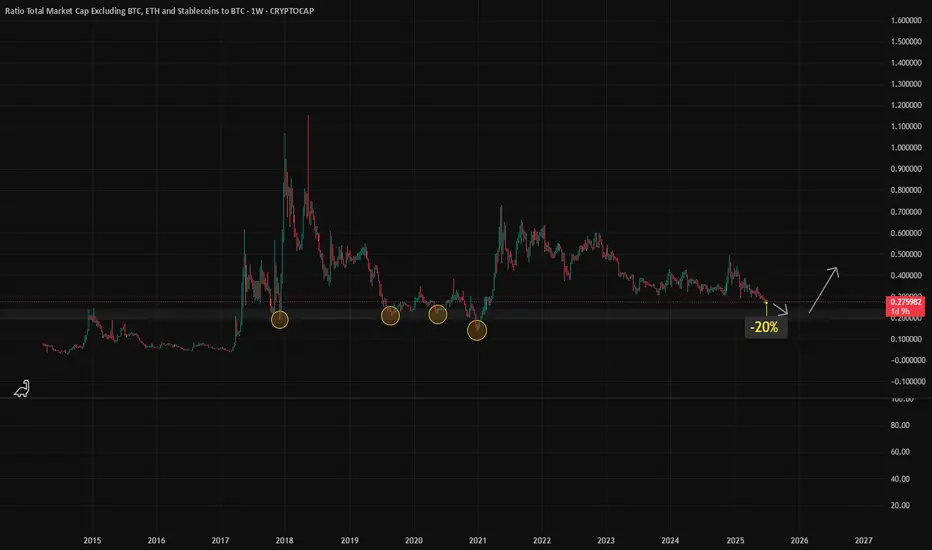
Altcoins Near Key Support, Possible -20% Drop before reversal ?Sharing my analysis on the altcoin market cap (excluding BTC, ETH, and stablecoins) compared to BTC over the past 10 years
I have marked important zones (yellow circles) where altcoins have historically bounced after strong corrections.
Current Outlook:
- I expect a possible -20% more downside, bringing it near 0.22, which aligns with a key historical support zone.
- This level has acted as a strong base multiple times, in 2018, 2020 and 2021
What I’m Watching:
- If price reaches that zone and holds, it could signal the start of the next altseason.
- Past patterns show similar moves before big reversals.
- However confirmation through volume and market sentiment is important before making any move
Final Note:
Not financial advice, just sharing what I see on the chart. If the ratio hits 0.22 and shows strength, it could be a key level to watch. Thanks
PENGU. Main trend. Trend reversal zone. 04 07 2025Logarithm. Main trend. Fresh cryptocurrency, which is being driven into hype.
Locally now. Price at the median of the bowl.
Buyer volume dominates. Most likely, there will be a large pump in case of a breakout.
The chart is somewhat reminiscent of the Bitcoin chart, the reversal zones of this secondary trend, after the first local wave of growth. The first local, significant target is shown.
There is a possibility of a helicopter, that is, to collect stops in both directions, and thereby dump passengers before a potential pump.
Such cryptocurrencies (low liquidity, monopoly over the price due to the concentration of cryptocurrency in “one hand”) at a good time "the hamster is not scared", will be pumped up conditionally, like Shiba Inu (SHIB), driving the hype (raising the price over and over again, and coming up with positive news) and 0.5 million Twitter subscribers (X). Medium-term — long-term level zones are shown on the chart.

ALT PUMP INCOMINGdon't sell your alts lol they're about to pump! embrace em as dead as they are, and let them resurrect!
Altseason isn’t cancelled, it’s just delayed. Here's WHY!CRYPTOCAP:BTC Dominance Update:
Altseason isn’t cancelled, it’s just delayed.
The key zone to watch is 69.5%–73% dominance. That’s where we’re likely to see a strong rejection if it doesn't start soon, which seems unlikely given the current circumstances.
The longer it takes to reach that level, the stronger the altcoin rally will be once it hits.
This isn’t hope, it’s exactly what the charts are showing.
Historically, 70% dominance has acted as a major reversal zone.
If there are signs of reversal before this level, I'll let you know beforehand.
So follow me if you don't and share this chart with your crypto friends.
Do not forget to keep cash/stables!
Let me know what you think in the comments.
Thank you
#PEACE

Altcoin Season - Just around the corner!!!In this analysis I share my hypothesis on #OTHERS CRYPTOCAP:OTHERS as to why the big awaited alt season is right around the corner !
After analysing how the Trump mania season unfolded, I could see plenty of similarities:
1. Price filled the supply before the last retrace - gray rectangle
2. Then it broke the downtrend line and made a decent move up - red dot
3. Price correction to the 618 retrace on fib AND in the supply -> became demand from #1
4. RSI formed a hidden bullish divergence, marking a potential start of the rally
5. Time passed from #2 trendline breakout to the big impulse -> around 50 days
-> now we are around 60 days, which means more time to accumulate, bigger impulse
In an ideal scenario, the total OTHERS cap (all crypto excluding top 10) should at least reach the last high of 450 billions, and to pour some hopium, to around 600-700 billions...
So if you filled your bags around recent prices on your alts, you should expect at least 10-20x imo!

OP / USDT 4hr PUMP INCOMING? OP/USDT – 4H Chart Summary
Market Structure:
4H Timeframe:
- Price consolidating within a descending triangle/wedge pattern, indicating potential buildup before a breakout.
- Lower Timeframes (1H and below): Bearish trend structure with lower highs and lows.
- OBV (On-Balance Volume): Forming a wedge—suggesting accumulation or distribution phase nearing a breakout.
Key Zones:
Demand Zone (Support):
- 0.5483 – 0.6351
This area has provided strong support historically. A clean break below could signal continuation of the larger downtrend.
Supply Zone (Resistance):
- 0.9068 – 1.0414
-Historically rejected price; high probability of reversal or consolidation if revisited.
Fair Value Gaps (FVG):
- FVG 1: 0.6659 – 0.6838
- FVG 2: 0.7024 – 0.7308
These inefficiency zones are likely to attract price if bullish momentum builds. Watch for potential short-term rejection or continuation setups here.
Volume Profile:
Strongest volume node (high liquidity zone) sits between 0.7470 – 0.8000
Suggests this area has been heavily traded and may act as magnet/resistance if approached again.
Fibonacci Confluence:
Previous swing high at 0.8232 aligns with the 0.618–0.65 golden pocket
A critical zone for potential take-profit or trend reversal on a breakout.
Scenarios:
Bullish Case:
If price holds above 0.6351 and bounces, look for:
- Retest of FVG 1, followed by FVG 2.
- Breakthrough of 0.7308 could target the golden pocket and swing high at 0.8232.
- Sustained bullish move may reach the supply zone above 0.9068.
Bearish Case:
- Breakdown below 0.6351 and especially below 0.5483 would:
- Invalidate the wedge support.
- Confirm continuation of the macro downtrend.
-Open room for new lows and bearish expansion.
Conclusion:
Price is at a key decision point inside a wedge.
Reaction at 0.6351 is critical—support bounce targets higher inefficiencies; breakdown signals deeper bearish continuation.
OBV and volume structure suggest an imminent volatility spike—prepare for a breakout.

Alt Season: When’s the Big Boom?TOTALE100 refers to small caps or the total market capitalization of the top 100 cryptocurrencies , excluding stablecoins. It is part of the CRYPTOCAP series.
It measures the total combined market cap (price × circulating supply) of the top 100 crypto assets by market cap.
Useful for:
* Gauging overall market strength or weakness.
* Spotting macro-level trends or capital inflows/outflows into the crypto sector.
Technical Outlook:
On the weekly chart, the price is facing rejection at 16B, forming a triple-top distribution pattern.
For positioning in small caps, we should wait for a price pullback to the key support zone between 5B and 3B.

$GRT IS ABOUT TO GO Graph ( JSE:GRT ) is about to go. Zoom in and out and see it for yourself. History will always repeat itself. You can see the short term targets
