$Amzn Are You Finished or Are you Done? S/O to Birdmard just because I love that wild ass statement; Lol.
So I've been on NASDAQ:AMZN for a week now and I Learned a Lesson from it last week wicking 1.272 action. So I'm back to perhaps call it from the bottom of where its at currently. But check this is out, I generally only have my fibs to show on the level I chart on, (I dont want to see it on another time frame.) Well, this morning; I guess I hadn't turned my motor all the way on and I read my 1 HR fibs on the 15 mins and got into some 225 Amazon calls only to realize that this is my 1 Hr TF fibs not the 15 mins (Which is what I trade every day). So, this NASDAQ:AMZN Chart Image is Charted on the 1 HR TIME FRAME, but the Image I posted is on the 15 min TF. #Calls
Happy Trading, Alerts Set!
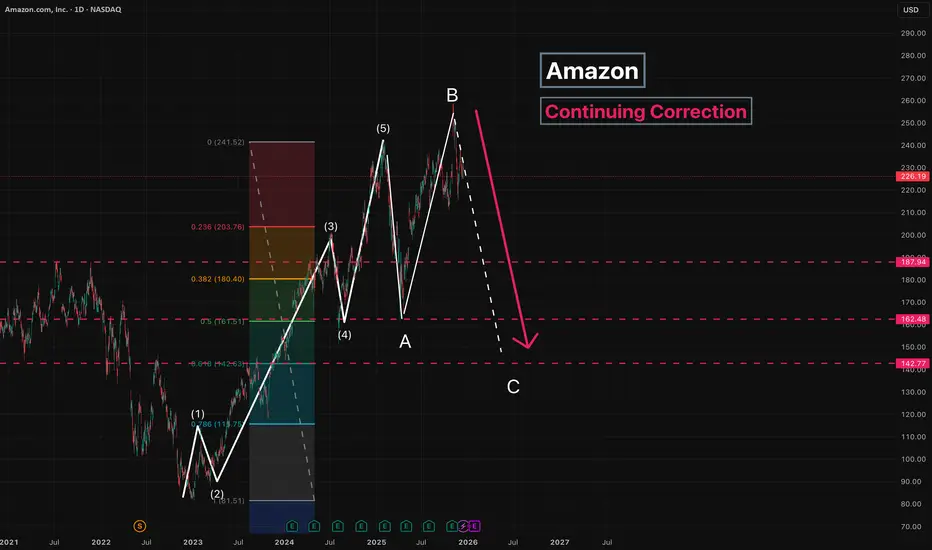
Amazon

Amazon - Continuing CorrectionThe correction is ongoing, and wave C has started to form.
Since wave B is longer than wave A , wave C is expected to move below the low of wave A .
Main target: 142
Intermediate target: 187
---
Please subscribe and leave a comment.
You’ll get new information faster than anyone else.
---
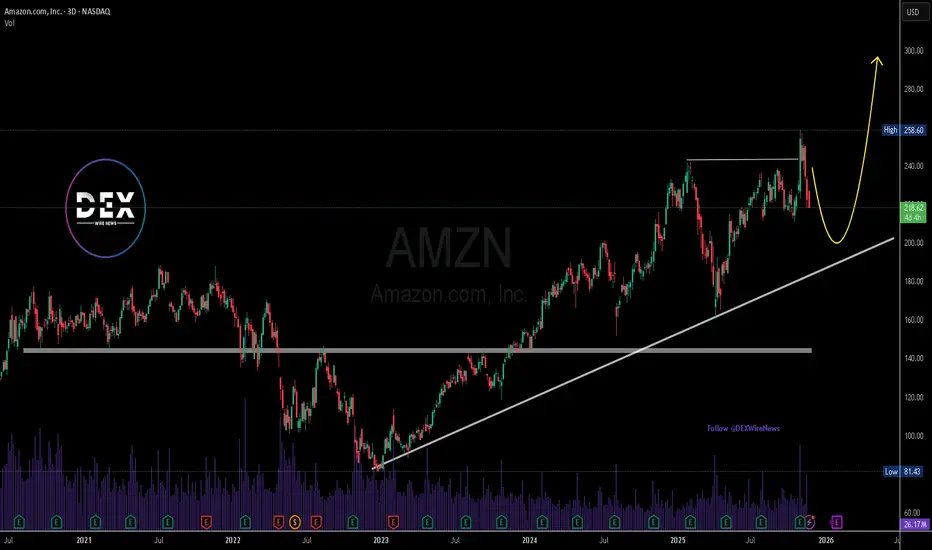
AMAZON 's new Bear Cycle targets $125. And it can make you rich.Amazon Inc. (AMZN) has been trading within a massive 24-year Channel Up ever since its October 2001 bottom of the Dotcom crash. This pattern, as you can see, has been following a very distinct structure with its 1M MA100 (green trend-line) being the major Support level (and providing the most efficient buy opportunities) since November 2006.
What stands out here is the period from late 2020 until today and how it resembles the one from late 2003 to late 2007. Both traded under multi-year Higher Highs trend-lines and in October 2007 that formed a Top, causing a 2nd correction within that time-frame that bottomed once it hit the 1M MA100 within the Support Zone of the previous consolidation phase.
Today's fractal has already made the 1st correction in 2022, which not surprisingly also bottomed on the 1M MA100 and kick-started the rally towards the Higher Highs trend-line again. We are now at the point where there are high probabilities that the 2nd correction will take place.
If the market continues to follow the past pattern, we expect Amazon to bottom below the 1M MA100 this time and at the bottom of the Support Zone within the $130.00 - $125.00 range. This will make an ideal Higher Low right at the bottom of the 24-year Channel Up.
So what can make you rich on this? Making a long-term buy of course and keeping it until 2030 - 2032 as the new Bullish Leg that will start, will effectively be the new Bull Cycle. And as this chart shows, these Cycles have had similar rises, with the 'weakest' one being +1037%.
---
** Please LIKE 👍, FOLLOW ✅, SHARE 🙌 and COMMENT ✍ if you enjoy this idea! Also share your ideas and charts in the comments section below! This is best way to keep it relevant, support us, keep the content here free and allow the idea to reach as many people as possible. **
---
💸💸💸💸💸💸
👇 👇 👇 👇 👇 👇

AMZN Bullish Flag & Breakout Setup?Amazon (AMZN) is trending higher on the daily chart after a strong rally off the mid-October low, confirmed by a bullish Break of Structure and price holding above the rising 60-day and 120-day moving averages. Price is now consolidating in a classic bull flag beneath resistance, with key demand anchored near the $215.00 base of the prior reversal and a major support zone building around $218–224.
The primary path is continuation. A decisive daily close above $236 would confirm a breakout from the flag and clear the $235.50 resistance ceiling, opening room toward the $240 area and then the $248–250 zone as trend-followers step back in. A more conservative trend approach looks for a dip toward the 60-day moving average near $228 and a subsequent reclaim of $229, signaling buyers defending dynamic support and aiming for a retest of the recent highs.
If price instead closes below $226, that would warn of pattern failure and invite a deeper correction toward the $218 major support and potentially lower. Below that, the bullish thesis weakens materially and any long bias should be reassessed until structure improves. This is a study, not financial advice. Manage risk and invalidations.
Thought of the Day 💡
Strong trends rarely move in straight lines—most of the edge is found in how you trade the pauses.
------------------------
Thanks for your support!
If you found this idea helpful or learned something new, drop a like 👍 and leave a comment, I’d love to hear your thoughts!

AMZN : What’s Taking Shape?Amazon’s recent recovery has developed into an interesting emerging structure. After the sharp drop and strong rebound, price is now building a potential continuation pattern. Momentum suggests the market may still be preparing for another upward leg once this consolidation phase completes. With the flow tightening, the next decisive move could unfold sooner than expected, making this setup worth monitoring closely.
**Disclosure:** We are part of Trade Nation's Influencer program and receive a monthly fee for using their TradingView charts in our analysis.

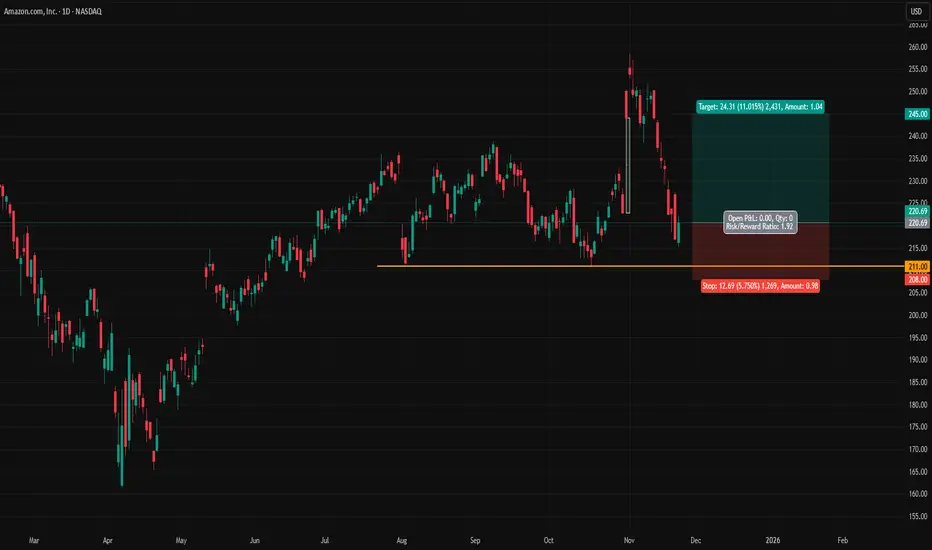
AMZN (Amazon) LONG SET UPLONG TRADE
Entry 1 $228.00
Stop loss $224.00
Take profit 1- $232.00
(Close 33%)
Take profit 2- $236.00
(Close 66%)
Take profit 3-$240.00

Amazon (AMZN) Falters, Bears Eye 200 EMAI’m wondering whether Amazon has seen a major top on 3 November, given it saw a large gap into the high before momentum turned lower. This has the hallmarks of a ‘blow-off top’, which can occur at major turning points when bulls push a stock higher with such force – often via a gap – as a kind of ‘last hurrah’, only for momentum to then falter.
A 16.8% decline to its 200-day EMA then ensued and, while it has tried to rebound, it has also struggled to rise alongside the broader market.
Trading volumes were declining while prices rose, and Tuesday’s shooting-star candle formed near the September high and below the January high. Prices also gapped lower on Wednesday before finding support around the 50-day EMA.
Bears could look to fade moves towards the shooting-star high, with a retest of the 200-day EMA in focus.
Matt Simpson, Market Analyst at City Index.

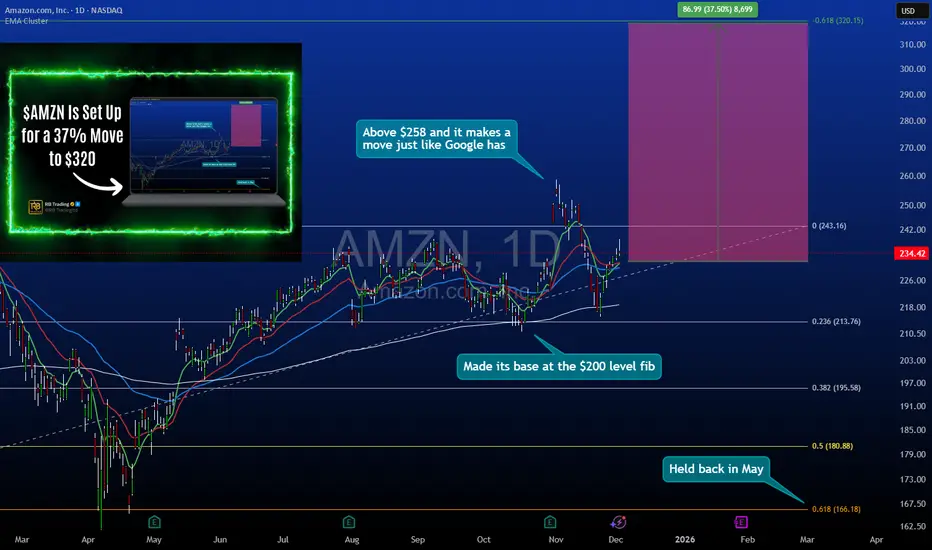
Amazon - Big Tech Pullback Strategy Into $232 SupportAmazon Multi-Month Position Build: $232-234 Entry Zone Targeting $320
Amazon has pulled back into a critical support zone at $232-234, presenting the same geometric retracement setup that recently validated on GOOGL. This analysis breaks down why this level offers favorable risk/reward asymmetry for a multi-month position targeting $320.
🎯 Setup Overview:
Entry Zone: $232-234 (current pullback area)
Primary Target: $320 (37% upside potential)
Timeframe: Multi-month position (Q1-Q2 2025)
Pattern: Structured retracement in established uptrend
📊 Technical Structure:
Support Confluence at $232-234:
0.618 Fibonacci retracement from recent swing low to high
Previous consolidation zone that acted as resistance, now support
Volume profile shows significant accumulation at this level historically
Aligns with rising trendline from 2023 lows
Price Action Context:
Amazon rallied from $140 lows to $260+ highs before this pullback. The current retracement brings price back into a zone where buyers have historically stepped in with conviction.
Why $320 Target:
Represents the next major resistance zone from prior price structure
Aligns with measured move extensions from current base
37% upside provides asymmetric reward relative to defined risk
🔍 The GOOGL Parallel (Why This Pattern Works):
What Just Happened with GOOGL:
Google recently pulled back into a similar geometric retracement zone (0.618 level) and reversed sharply, validating the strategy of buying quality big tech names during structured pullbacks rather than chasing momentum.
Why The Pattern Repeats:
Institutional Behavior: Large funds rebalance and take profits at resistance, creating predictable pullback zones
Liquidity Zones: Support levels represent areas where prior buyers have conviction and add to positions
Mean Reversion: Extended moves in trending assets typically retrace to specific mathematical levels before continuation
Key Lesson from GOOGL:
The most uncomfortable entry (during the pullback) provided the best risk/reward. Waiting for "confirmation" meant entering 15-20% higher with expanded risk.
📈 Why This Setup Makes Sense:
Risk Is Defined:
Stop loss placement below $225 (structure breakdown) limits downside to ~$7-9 per share from mid-range entry at $233. If price breaks $225, the bullish thesis is invalidated.
Reward Is Probable:
The $320 target isn't arbitrary it's based on:
Previous resistance turned future resistance
Fibonacci extension levels from the pullback
Historical price behavior at major psychological levels
From $233 entry:
Risk: ~$8 to stop at $225
Reward: $87 to target at $320
Ratio: ~10.8:1
Even a conservative partial target at $280 (first resistance) still offers 6:1 reward/risk.
🛡️ Risk Management Framework:
Entry Strategy (Scaling In):
First position: $234 (initial test of support zone)
Second position: $232 (if support retests cleanly)
Final position: $228-230 (if maximum pain occurs but structure holds)
This averaging approach improves entry price while maintaining discipline.
Stop Loss Placement:
Below $225 - a decisive break of this level invalidates the support thesis and requires exit regardless of unrealized loss.
Target Management:
First reduction (1/3): $270 (previous resistance, books profit)
Second reduction (1/3): $295 (psychological level, locks gains)
Final exit (1/3): $320 (primary target, complete position close)
Progressive profit-taking removes emotion from exits.
🧠 Trader Psychology: Why Most Will Miss This:
The Discomfort Factor:
At $234, Amazon "feels" weak because it's down from $260. At $270, it will "feel" strong because it's rising. But the best risk/reward exists now, not later.
Recency Bias:
Recent selling pressure makes traders assume more downside. Historical structure suggests this is where buyers return.
Waiting for Confirmation:
Many will wait for price to break above $250 to "confirm" strength. By then, risk to $225 expands dramatically and reward compresses.
The GOOGL Proof:
Those who waited for Google to "prove itself" entered 18% higher with worse risk parameters. The same pattern is setting up here.
📊 Tools Supporting This Analysis:
Fibonacci Retracement:
0.618 level at $232 marks the zone where pullbacks in strong trends typically find buyers.
Volume Profile:
High volume node around $230-235 indicates this area has been contested heavily—now it must hold as support.
Trendline Analysis:
Rising support from 2023 lows intersects with current price, adding confluence to the $232 zone.
Market Structure:
Higher lows and higher highs remain intact. This pullback is a correction within an uptrend, not a reversal.
🎯 Why Big Tech Pullbacks Work:
Quality + Liquidity:
FAANG stocks have deep liquidity and institutional ownership. When they pull back to structure, buyers appear because the underlying businesses remain strong.
Rotation, Not Rejection:
Selloffs in mega-cap tech are often profit-taking and sector rotation, not fundamental deterioration. This creates buy-the-dip opportunities.
Historical Precedent:
Amazon has repeatedly rewarded buyers who entered during 15-20% pullbacks to support in multi-year uptrends.
📅 Timeframe Expectations:
Not a Day Trade:
This is a multi-month position (potentially 3-6 months to target). Intraday volatility should be ignored.
Quarterly Catalysts:
Amazon's next earnings report and holiday season results could act as catalysts for the move toward $320.
Patience Required:
The $232 level may retest multiple times before resolving higher. Position sizing should accommodate short-term volatility.
⚠️ What Could Go Wrong:
Macro Headwinds:
Broader market selloff could pressure all equities regardless of individual structure. The $225 stop exists for this reason.
Sector Rotation:
If money flows out of tech entirely, support may not hold. This invalidates the thesis and requires disciplined exit.
Earnings Risk:
If holding through earnings, position sizing should account for potential volatility. Consider reducing exposure before the event.
Breaking Support:
If price closes below $225, the setup is broken. No hoping, no averaging down further—just exit and reassess.
🏆 The Professional Approach:
They Buy Structure, Not Stories:
The $232 level isn't interesting because of news or narratives. It's interesting because risk is small and reward is large based on geometry.
They Scale Positions:
Rather than going all-in at $234, they build the position across $234, $232, and potentially $228. This reduces timing pressure.
They Accept Being Wrong:
If $225 breaks, they exit with a small, controlled loss. Pride doesn't enter the equation.
They Journal the Setup:
Entry rationale, risk parameters, and targets documented before the trade. Emotions don't dictate exits.
📌 Key Takeaways:
✅ GOOGL validated the pattern: The same pullback-to-support strategy that worked on Google is setting up on Amazon at $232-234.
✅ 10:1 risk/reward exists now: Entry at $233 with $225 stop and $320 target offers exceptional asymmetry this compresses as price rises.
✅ Multi-month timeframe: This isn't a quick flip. Targets may take 3-6 months. Position sizing and patience are critical.
✅ Structure over emotion: When $234 feels scary, that's the signal. When $280 feels safe, that's the warning.
✅ Scale in, scale out: Build the position across the zone, exit progressively at targets. This removes timing pressure and locks gains.
⚠️ Important Disclaimers:
This analysis is for educational purposes and reflects a technical view based on price structure, historical patterns, and risk/reward calculations. It is not financial advice or a recommendation to buy or sell AMZN or any security.
The $232-234 support zone could fail. The $225 stop loss exists because no support level is guaranteed. Proper risk management requires accepting potential loss if structure breaks.
Targets are based on historical resistance levels and do not guarantee future performance. Market conditions, company-specific events, and macroeconomic factors can prevent targets from being reached.
The GOOGL comparison is for educational pattern recognition, not a guarantee that Amazon will follow the same path. Each setup has unique risks.
Always conduct independent analysis, size positions according to your risk tolerance, and consider consulting a financial professional. All investing involves risk of loss.
✨ Join the Discussion:
Are you watching Amazon at these levels? Have you used similar pullback strategies on big tech names? Share your thoughts or questions in the comments below.
📜 Buy structure. Define risk. Trade with discipline.
AMZN long-term TAAmazon is consolidating, the indicators do not support recent short-term runs which resulted in pullbacks but the trend is neither bearish, more neutral-bullish and also it supports SMA50 along the way, yes there were news about new AI chip from Amazon to rival Nvidia and so on and it has a chance to rally yet following the AI hype trend ride, but the volumes didn't react that much either, we just have to give it a little bit more time to finish the consolidation and project the approximate outcome.

AMZN : Mid-Term Bullish Continuation OutlookAmazon is shaping a constructive bullish sequence on the 4-hour timeframe, with recent price action reinforcing renewed upside momentum. The unfolding structure suggests buyers may remain in control as the market progresses into December, keeping the continuation scenario active while the current rhythm holds.
Disclosure: We are part of Trade Nation's Influencer program and receive a monthly fee for using their TradingView charts in our analysis.

Amazon.com Inc.( $AMZN) and OpenAI Deal Reignites AI Momentum Amazon.com Inc. (NASDAQ: NASDAQ:AMZN ) gained 1.77% to close at $233.22 as investors reacted to its landmark $38 billion cloud deal with OpenAI. The agreement gives AWS a pivotal role in powering OpenAI’s future models, marking one of Amazon’s most significant AI infrastructure wins to date. The deal spans seven years and includes access to large-scale Nvidia GPU clusters—an essential component for training and deploying advanced generative AI models.
The partnership comes as Amazon accelerates its push to re-establish AWS leadership in the competitive AI cloud segment. For years, OpenAI relied almost exclusively on Microsoft Azure. The shift signals a broadening of OpenAI’s compute strategy and reinforces Amazon’s long-term commitment to expanding its high-performance AI capabilities. AWS leadership noted that its infrastructure is specifically optimized to support demanding AI workloads at global scale, while OpenAI called the partnership a meaningful addition to the broader compute ecosystem.
Strong fundamentals support the bullish outlook. Amazon’s Q3 results highlighted renewed AWS momentum, with cloud growth once again becoming a focal point of investor confidence. AWS remains Amazon's most profitable segment, and securing OpenAI positions it more competitively against Microsoft, Google Cloud, and rising GPU-focused providers.
Long-term performance metrics also reinforce Amazon’s resilience. While the stock is up just 6.30% year-to-date, its three-year return of 148% significantly outpaces the S&P 500. Amazon continues to invest aggressively in logistics automation, advertising, robotics, and AI-driven cloud capabilities—areas expected to drive sustained revenue expansion.
Technical Analysis
AMZN remains bullish, currently trading at $233.22. The chart shows price respecting an ascending trendline, offering structural support near $190–200. A key resistance zone sits near $258, the previous swing high. A breakout above this level could open the path toward $260+. Support remains at $200, with deeper support around $185 if retracement occurs.

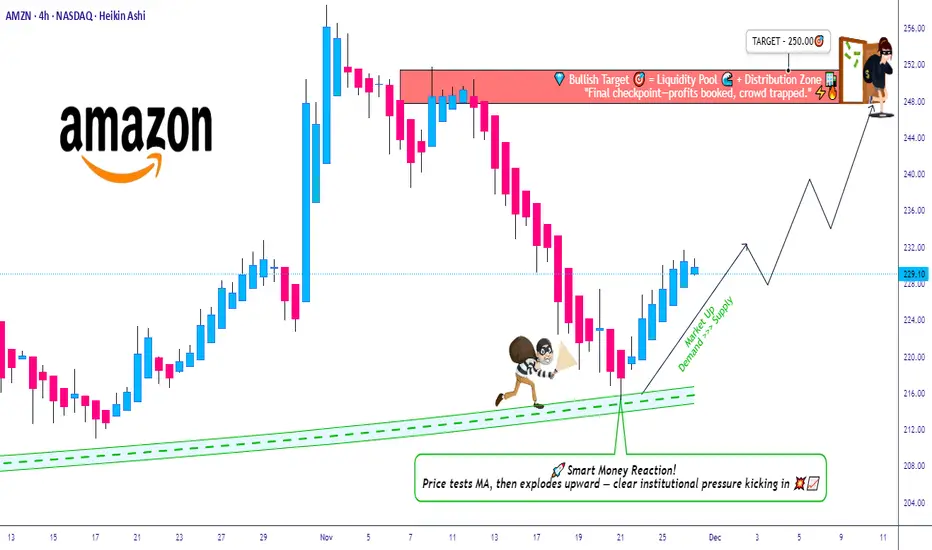
AMZN Breakout Reload? TMA Pullback Shows Buyer Strength🔥 AMZN Swing Trade Profit Playbook | Bullish Pullback + Thief Layering Strategy 🟢📦
Welcome back, Ladies & Gentlemen — the Thief OG’s 😎🕵️♂️
Here’s a polished, rule-friendly breakdown of the bullish setup developing on AMZN (Amazon.com Inc.) – NASDAQ.
📌 Market Context
AMZN is showing a clean bullish pullback into the Triangular Moving Average (TMA) zone, supported by a Heikin Ashi Doji Reversal, signaling that buyers are gaining strength and attempting to dominate momentum again. 📈🔥
🧠 Trade Plan (Swing Trade)
Plan:
A bullish pullback strategy confirmed by:
🔺 Triangular Moving Average pullback reaction
🟩 Heikin Ashi reversal-doji indicating potential trend continuation
📊 Buyers stepping in with momentum recovery
🎯 Entry Plan – Thief Style Layering (Multiple Limit Orders)
This is the famous Thief Strategy — using layered limit orders to scale into the move like a master of stealth 😎🕵️♂️💼
(TradingView-safe version: purely educational, optional, trade at your own risk.)
Layered Buy Limits:
🟢 215.00
🟢 220.00
🟢 225.00
🟢 230.00
(You may increase or adjust layers based on your own style and risk tolerance.)
🛑 Stop-Loss (Thief Style Educational Version)
SL Zone (Optional):
❌ 210.00
⚠️ Note: Dear Ladies & Gentlemen (Thief OG’s), this level is NOT a recommendation — it’s just part of the thief-style educational breakdown.
Choose your own risk plan, trade your own analysis.
🎯 Target Zone
The “Police Force” 🚓 — aka strong resistance, potential overbought zone, and liquidity trap area — sits around:
🟡 Target @ 250.00
⚠️ Note: Dear Ladies & Gentlemen (Thief OG’s), this is NOT a fixed TP recommendation.
Manage your profits as per your own risk appetite and strategy.
📡 Related Pairs to Watch (Correlation & Market Behavior)
Watching correlated tickers helps understand broader tech-sector sentiment and liquidity rotation.
Here are the key names to keep an eye on:
📌 NASDAQ:AAPL (Apple Inc.)
Strong correlation with AMZN in tech-momentum cycles.
When AAPL shows bullish continuation, AMZN often follows with similar pressure.
📌 NASDAQ:META (Meta Platforms Inc.)
Tracks consumer-tech spending sentiment.
Strong META moves can hint at acceleration across NASDAQ growth stocks.
📌 NASDAQ:MSFT (Microsoft Corp.)
A heavyweight pillar in NASDAQ.
MSFT strength boosts overall tech-index bullish bias.
📌 NASDAQ:QQQ (Invesco NASDAQ-100 ETF)
The main sentiment gauge.
If QQQ remains above its trend structure, AMZN's bullish continuation gets stronger confirmation.
📌 NASDAQ:TSLA (Tesla Inc.)
Not directly correlated, but impacts NASDAQ volatility dynamics.
High volatility in TSLA often ripples into liquidity behavior across the index.
💬 Final Thoughts
This AMZN setup blends structure, momentum, and multi-layer entries, crafted in a fun Thief-style teaching format while keeping everything compliant and research-focused 📚✨
Trade smart, manage risk, escape with profits when the “police” show up 🚓😆📈
✨ “If you find value in my analysis, a 👍 and 🚀 boost is much appreciated — it helps me share more setups with the community!”
⚠️ Disclaimer
This is a Thief-style trading strategy presented just for fun & educational purposes only.
Not financial advice. Do your own analysis and manage risk responsibly.
#AMZN #Amazon #SwingTrade #NASDAQ #BullishSetup #PullbackStrategy #HeikinAshi #TriangularMovingAverage #ThiefStrategy #LayeringEntries #TradingEducation #StockMarket #MarketAnalysis #TradingViewCommunity #EditorPickReady 🚀
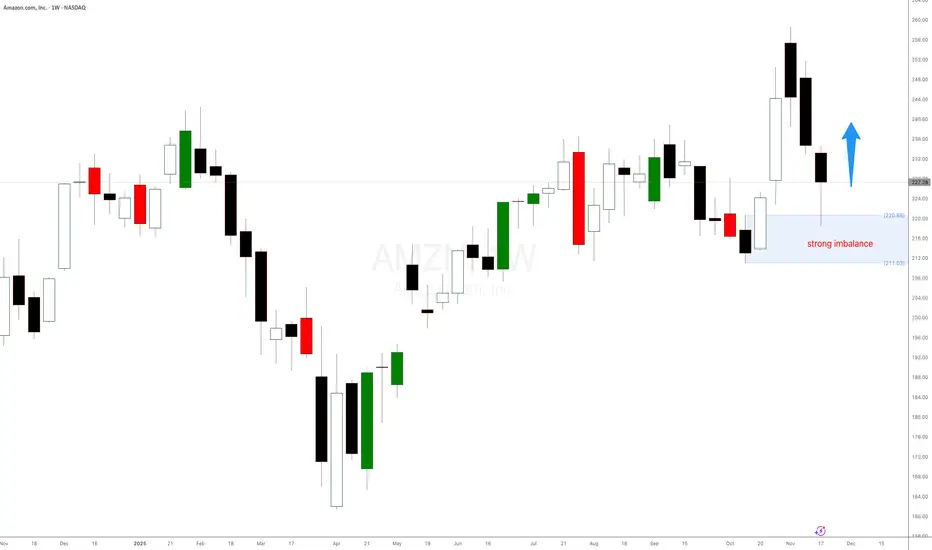
Why os Amazon $AMZN rallying?Why os Amazon NASDAQ:AMZN rallying? Amazon st. The strong weekly demand level at $231 per share is still in control. Rallying as expected. Long positions should be managed.
Hopefully, Amazon stock will continue to rally. These imbalances are great for stock swing trading, bullish stock option strategies and intraday stock trading once the imbalance gains control.

Amazon (NASDAQ: $AMZN) Expands AI Power With $50B GovCloud PushAmazon (NASDAQ: NASDAQ:AMZN ) is strengthening its position in the AI and cloud infrastructure race with a massive pledge of up to $50 billion to expand supercomputing capacity for U.S. government agencies. The investment focuses on building advanced AWS data centers across Top Secret, Secret, and GovCloud regions starting in 2026, adding nearly 1.3 gigawatts of AI and high-performance computing power. With more than 11,000 government customers, AWS aims to widen its lead as AI competition intensifies across cloud providers.
Industry analysts note that Amazon has lost some ground in AI-specific cloud growth to rivals like Google and Oracle. As companies such as Microsoft, OpenAI, and Alphabet pour billions into AI infrastructure, Amazon’s scale-driven investment is a strategic move to ensure AWS remains the backbone of government AI systems.
The new capacity will support federal agencies with a full stack of AI tools—including Amazon SageMaker, Amazon Bedrock, and foundation models like Amazon Nova and Anthropic Claude—allowing them to build customized AI solutions at scale. Analysts expect the U.S. government to accelerate AI adoption as part of its race to maintain technological leadership over China.
Technical Outlook
AMZN is currently pulling back from the $258 resistance, forming a healthy correction toward the $232 support zone, which aligns with a weekly demand level. Bulls will look for a strong reaction here to retest the $258 high and potentially break above it.
A failure at $232 exposes the ascending trendline support that has guided Amazon’s uptrend since early 2023. The RSI cooling off suggests this is a normal correction rather than a trend reversal. If support holds, upside targets between $280–$300 remain valid, matching long-term Fibonacci projections.
Possible Amazon BounceAmazon fill the earnings gap. I'm bullish on Amazon but not too strongly beacause of pressure on whole stock market. I don't know where the stock will open today but if it gave me a favarable enty, I plan to go long.
Amazon(NASDAQ: $AMZN) Invests $3B in New Mississippi AI Data HubAmazon.com (NASDAQ: NASDAQ:AMZN ) announced plans to invest at least $3 billion in a new data-center campus located in Warren County, Mississippi. The project will support Amazon Web Services’ expanding AI and cloud-infrastructure needs, reinforcing AWS’s position as the company’s fastest-growing and most profitable segment.
The data-center development is expected to create more than 200 direct jobs at the site and support over 300 additional roles in the surrounding region. Amazon highlighted that the expansion will power next-generation AI workloads, machine-learning services, and global cloud capacity. The investment also deepens Amazon’s long-term footprint in the southeastern U.S., aligning with rising demand for high-compute environments across industries.
This move follows a broader trend of hyperscale cloud providers accelerating infrastructure spending to compete for AI-focused enterprise customers. With AWS already serving as the global leader in cloud services, the investment signals Amazon’s intention to maintain a technological and commercial edge amid intensifying competition from Microsoft Azure and Google Cloud.
Technical analysis:
Price is pulling back from heavy resistance at $258 and correcting toward the ascending trendline support. This level acts as a significant weekly demand area and aligns with the broader structure guiding the uptrend.
A strong bullish reaction from the trendline would likely set up another retest of the $258 highs. A clean break above that zone opens the door toward $280–$300, supported by long-term Fibonacci projections and sustained strength in AWS earnings.
If the trendline level breaks, the next key support sits at the horizontal support that has carried Amazon’s stock since early 2021. Overall, the setup remains bullish as long as price holds above the trendline.
Is Amazon exploding again? New weekly demand in controlIs Amazon exploding again? New weekly demand in control at $224. Expecting a decent rally from here in the following days.
Amazon (AMZN) Shares PlungeAmazon (AMZN) Shares Plunge
As the chart shows, Amazon (AMZN) shares fell to around $222 yesterday, despite trading above $255 at the start of the month.
The price drop is the result of several factors, including:
→ A rating downgrade from Rothschild & Co. Redburn (to “Neutral”). Analysts doubt that Amazon’s massive investments in artificial intelligence will pay off as quickly as its earlier spending on cloud technologies once did.
→ Pressure from the Federal Trade Commission (FTC). A court hearing on accusations that Amazon engaged in anti-competitive practices and overcharged US households (by more than $1bn) has been officially scheduled for February 2027.
Technical Analysis of Amazon (AMZN)
Reviewing the chart from 3 November (when the price climbed above $250 following a strong earnings report), we:
→ used the fluctuations in AMZN’s share price to outline an ascending channel (shown in blue);
→ suggested that the initial reaction to the report might have been overly optimistic and pointed to a potential corrective move.
However, the subsequent decline of more than 13% from the November peak appears too deep to be considered a mere correction – the price is now below where it stood before the report was released. It is reasonable to assume that the surge in AMZN above the psychological $250 level on strong news was used to lock in profits from large long positions, and that market sentiment has since shifted dramatically.
Nevertheless, in the short term, AMZN traders may look for a rebound from the lower boundary of the channel. In the longer run, a bearish breakout from the current channel should not be ruled out – especially if news flow around AI takes a gloomier turn. Today, all eyes are on Nvidia’s (NVDA) earnings report.
This article represents the opinion of the Companies operating under the FXOpen brand only. It is not to be construed as an offer, solicitation, or recommendation with respect to products and services provided by the Companies operating under the FXOpen brand, nor is it to be considered financial advice.

Amazon Raises $15B for AI Expansion — Stock at Key Support ZoneAmazon has launched its first US dollar bond sale since 2022, securing $15 billion to accelerate investments in AI infrastructure. Demand was massive, reaching $80 billion, signaling strong investor confidence in Amazon’s long-term growth story. The funds will support capital expenditures, acquisitions, data-center expansion, and upcoming debt maturities.
This move aligns with a broader trend among tech giants aggressively raising capital to scale AI systems. Meta issued $30 billion earlier, Alphabet raised $25 billion, and Oracle sold $18 billion in September. The surge in funding reflects the rising cost of advanced chips, cloud infrastructure, and high-capacity data centers needed to stay competitive in the AI race.
Amazon, the world’s largest cloud provider through AWS, is increasingly focused on high-performance computing and generative AI models. The new capital gives Amazon more room to expand capacity, boost margins through automation, and strengthen its competitive edge in enterprise AI services.
Amazon’s stock (AMZN) is pulling back from the $258 resistance, forming a corrective move toward a key support area around $232. This level aligns with the structure seen on the weekly chart and acts as a short-term demand zone. A strong bullish reaction here would likely set the stage for a retest of the $258 high, followed by a potential breakout if momentum returns.
If $232 fails to hold, the next major support sits at the ascending trendline zone, which has guided Amazon’s uptrend since early 2023. A deeper correction remains possible, but the broader structure is still bullish as long as price holds above the trendline.
The RSI is cooling off, suggesting the correction is healthy rather than a trend reversal. If Amazon bounces from support, the next major upside target sits between $280 and $300, aligning with long-term Fibonacci extensions.

AMZN : Bulls Taking a Pause Before the Next Leg Up!Amazon’s recent surge has hit a temporary Pause, forming a healthy pullback phase. If structure remains intact, another bullish wave could follow soon. Key levels to watch: 238–240 for a potential continuation setup.
Disclosure: We are part of Trade Nation's Influencer program and receive a monthly fee for using their TradingView charts in our analysis.

Amazon.com, Inc. ($AMZN) Expands Low-Cost Bazaar ServiceAmazon.com, Inc. (Nasdaq: NASDAQ:AMZN ) is making a bold move into the global low-cost e-commerce space. The retail giant announced the expansion of its Amazon Bazaar service — known as “Haul” in the U.S. — to 14 new international markets, intensifying competition with Shein and PDD Holdings’ Temu.
The service targets value-driven shoppers by offering ultra-cheap goods like $10 dresses, $5 accessories, and $2 home items, with a focus on emerging markets such as Nigeria, the Philippines, Hong Kong, Saudi Arabia, and Taiwan. The expansion builds on Bazaar’s earlier success in Mexico and the UAE, signaling Amazon’s strategy to tap into the fast-growing global demand for low-cost online retail amid weaker consumer sentiment.
This move comes as U.S. import tariffs under the Trump administration pressure household budgets, particularly for low-income groups. By diversifying into affordable goods, Amazon aims to defend its e-commerce dominance against Chinese platforms that have captured younger, price-sensitive consumers through viral marketing and social commerce. Analysts note that this pivot could enhance Amazon’s total addressable market and bolster revenue from international operations in 2026.
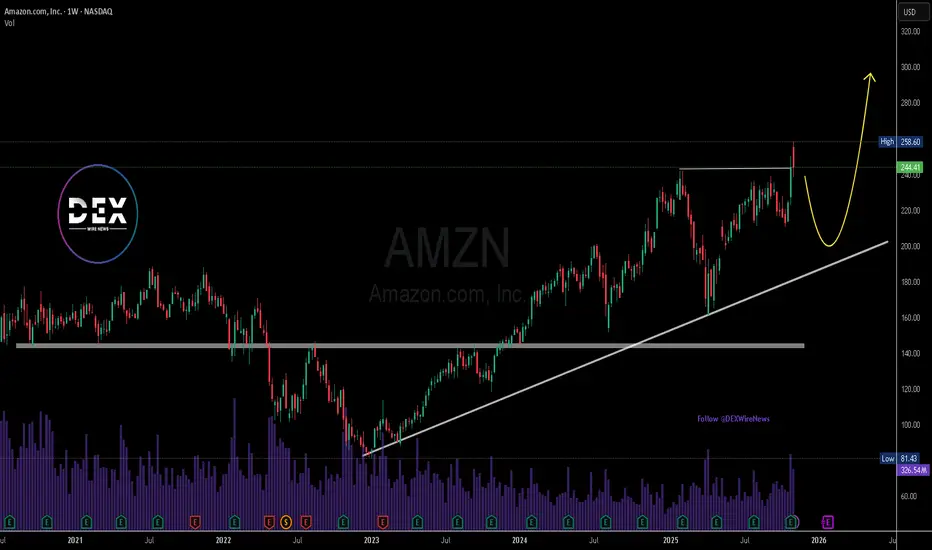
Technically, Amazon’s stock remains in a strong uptrend, trading near $244.41, slightly below its recent high of $258.60 market this week. The weekly chart shows consistent higher lows supported by a long-term ascending trendline from early 2023. The $220–$225 zone now serves as key support, with potential for a short-term pullback before resuming the rally toward the $300 level.
Momentum remains positive, with volume strength confirming investor interest following strong Q3 earnings. A sustained move above $260 could trigger a fresh bullish leg, extending Amazon’s dominant run as both a tech and retail powerhouse.
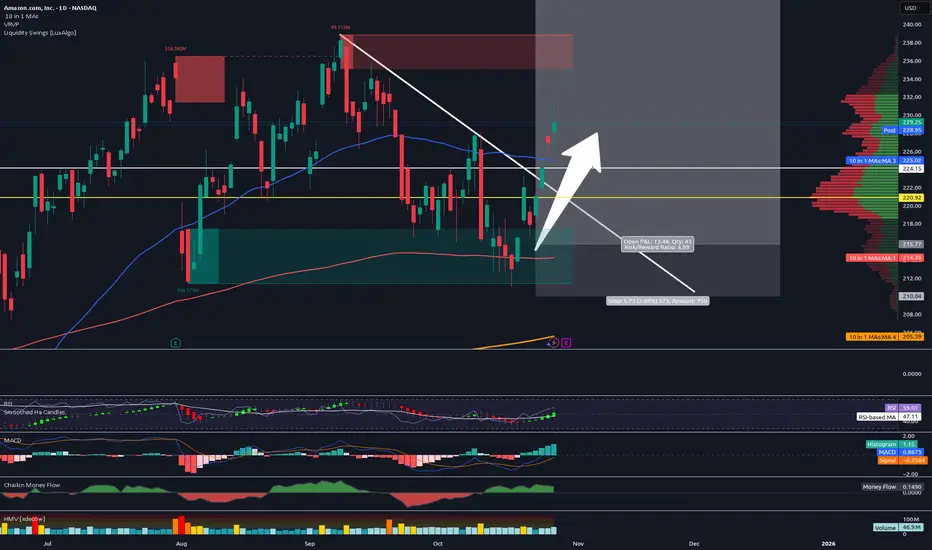
Sold Half Amazon - Raised Stops - Halfway to Final Target!Trading Fam,
We are halfway to my final target. I've been trading safe lately. So, I decided to sell half here, capture some profit, and raise my stops to $225, ensuring we're all in the money on this trade.
Congrats to those who followed me. We are 14 wins for the last 14 trades with an avg. of 33% profit per trade. Since implementing my new indicator just over a year ago, I continue to improve trade accuracy with each trade. Experience is growing and so are our wallets. Our portfolio is up 69% since we started with the indicator! Those are incredible stats for any trader, nevermind someone like me who just learned how to trade liquidity!
You guys know where to find me and all of my trades. 100% free to all of my followers.
✌️Stew
20+ Stocks for November: Your Ultimate Investing Radar📅 October is wrapped up, and a new month always means a new chapter on the charts.
Monthly closes reveal which breakouts are real, not temporary spikes, but clear signs that investors are willing to pay higher prices than before.
📊 I’m looking for those moments where the market proves it has changed its mind — when former resistance finally turns into support, and timing starts creating an edge.
That’s one of the biggest strengths of technical analysis: we don’t hope it moves, we see the action on the chart.
-----------------------------------
🔍 Over the past days, I’ve done another full round of research:
I scanned through both the Nasdaq 100 and S&P 500 , and also handpicked a few strong setups from Europe.
In total, you’ll find 20+ stocks today — each with its own description and plan.
I know that sounds like a lot, but there are quite a few of you here already 🙏, and every investor has a different strategy.
So don’t feel you have to study everything… just scan the names: if something catches your eye, stop and dig in.
If not, scroll on. You don’t need to cover them all.
📣 The purpose of my work is simple:
"to give you good, technically correct ideas — ones that avoid the classic mistakes that come from buying at the wrong time."
…and when you combine that with your own fundamental homework, your success rate might turn out surprisingly green.
-----------------------------------
🧭 November radar
In today’s post, you’ll find both breakout setups and corrections that have reached strong support zones.
I’ll also go through the major indices, explaining:
“why it might be smarter to take half positions instead of going all in.”
☕ So grab your coffee… and let’s kick off with 10 breakout ideas!
👇
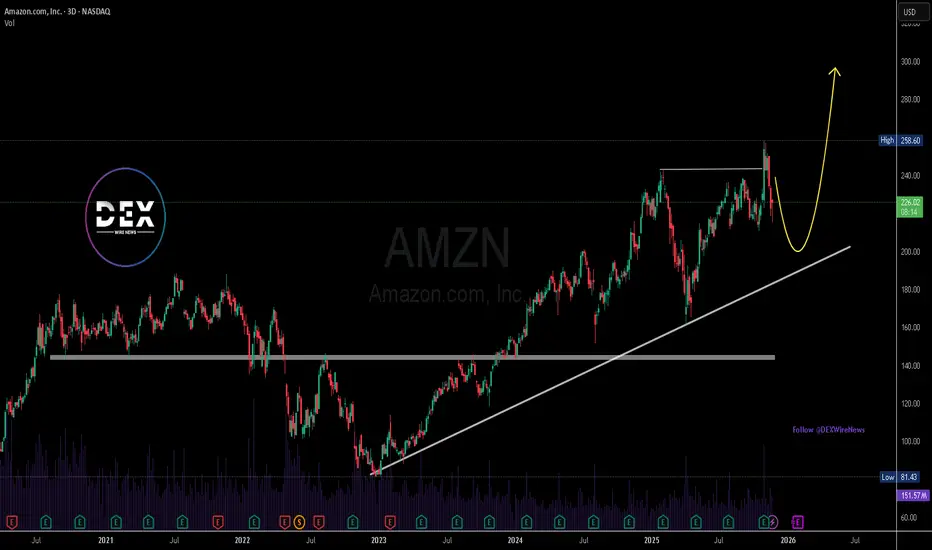
Amazon (AMZN)
No need for a long introduction here. When a member of the Magnificent Seven delivers a clean breakout, it’s a signal you don’t want to ignore.
📈 For those who regularly add to their Mag7 holdings or rotate between them monthly, Amazon would be my pick this time.
While META’s recent correction isn’t a bad zone either, technically speaking, AMZN shows the stronger setup right now.
-----------------------
Dell Technologies (DELL)
Dell Technologies is one of the largest IT companies in the U.S., providing computers, servers, and cloud infrastructure solutions.
Over recent quarters, Dell has gained solid momentum — especially from AI server demand, which helped lift margins thanks to its higher-value infrastructure products.
Revenue also came in above expectations in the latest report, boosting investor confidence and pushing the stock to new highs.
📈 From a technical perspective, the breakout is clear:
The $150 resistance, which had held for almost a year and a half, finally gave way in October.
The structure is now open to the upside, and the chart shows clear strength.
The decision is simple: enter now, wait for a deeper retest, or just keep it on your radar — your call.
-----------------------
Nokia (OMXHEX: NOKIA)
A few weeks ago, I mentioned that Nokia was setting up for a potential breakout, and look at that, it actually did.
The company announced a collaboration with NVIDIA, which triggered the long-awaited move higher, breaking through its previous resistance zone.
The €5.5 level mentioned earlier is now history, and the monthly close above it confirms the breakout’s validity.
Whether you enter immediately, wait for a retest, or skip it because it doesn’t fit your style — again, your call. Technically valid!
-----------------------
Steel Dynamics (STLD)
Steel Dynamics ranks among the largest steel producers in the U.S., known for using recycled steel and low-emission production methods.
With a P/E of 20 (forward ~12), the company benefits from U.S. infrastructure investments and the broader manufacturing uptrend.
Recent quarterly results have been steady, the balance sheet is strong, and cash flow remains solid, supporting potential future growth.
📈 Technical setup:
This chart checks every box of a classic breakout play:
..........
🧭 Full radar and extended notes are available on my main page — you’ll find it easily.
All the best,
Vaido
