AMC - Beautiful Bullish LookI love the wick and where this stopped, lot of pent up energy in this one, should explode higher if the pattern works out.
Amcentertainment

AMC Entertainment Holdings, INC (AMC) 1M Trading Analisys (TA)1M Chart, AMC Entertainment Holdings, INC (AMC) NYSE , on January 18, 2023, the signals on MACD have been below the histogram since January 2022, still far from pierce facing north; The RSI signal bounced on 40 and is now facing NE after the price has been steadly climbing the last 13 days, from $4 to $5,77, below both 100/200 MA signals, there is still plenty of room for the price to reach the 100 days MA signal by $8, to test it, which is which is the optimistic approach, but remember "In this business if you're good, you're right six times out of ten. You're never going to be right nine times out of ten. I've found that when the market's going down and you buy funds wisely, at some point in the future you will be happy. You won't get there by reading: "Now is the time to buy". At this time this ticker has a Volume of 43.939M, with Average Volume (10) of 29.468M and a Market Cap of 3.009B. AMC Entertainment Holdings, Inc. engages in the theatrical exhibition business through its subsidiaries. It operates through the U.S. Markets and International Markets segments. The U.S. Markets segment is involved in owning, leasing, or operating theaters and screens in the U.S. The International Markets segment focuses on owning, leasing, or operating theaters and screens in the United Kingdom, Germany, Spain, Italy, Ireland, Portugal, Sweden, Finland, Norway, Denmark, and Saudi Arabia. The company was founded by Barney Dubinsky, Maurice Durwood and Edward Durwood in 1920 and is headquartered in Leawood, KS.
This Company DOES NOT SHARE DIVIDENDS.
Good Luck!
Gráfico 1M, AMC Entertainment Holdings, INC (AMC) NYSE , al 18 de enero de 2023, las señales en MACD han estado por debajo del histograma desde enero de 2022, aún lejos de perforar hacia el norte; La señal RSI rebotó en 40 y ahora se enfrenta al NE después de que el precio haya estado subiendo constantemente los últimos 13 días, de $4 a $5,77, por debajo de ambas señales de 100/200 MA, todavía hay mucho espacio para que el precio alcance la Señal MA de 100 días para testearla cerca de $8, que es el enfoque optimista, pero recuerda: "En este negocio, si eres bueno, aciertas seis veces de cada diez. Nunca acertarás nueve veces de cada diez. Descubrí que cuando el mercado está bajando y usted compra fondos sabiamente, en algún momento en el futuro será feliz. No llegará allí leyendo: "Ahora es el momento de comprar". En este momento este ticker tiene un Volumen de 43.939 M, con un Volumen Promedio (10) de 29.468 M y una Capitalización de Mercado de 3.009 B. AMC Entertainment Holdings, Inc. se dedica al negocio de exhibición teatral a través de sus subsidiarias y opera a través de los EE. UU. Segmentos de Mercados y Mercados Internacionales El segmento de Mercados de EE. UU. participa en la propiedad, arrendamiento u operación de teatros y pantallas en los EE. UU. .S. El segmento de Mercados Internacionales se enfoca en poseer, arrendar u operar teatros y pantallas en el Reino Unido, Alemania, España, Italia, Irlanda, Portugal, Suecia, Finlandia, Noruega, Dinamarca y Arabia Saudita. La empresa fue fundada por Barney Dubinsky, Maurice Durwood y Edward Durwood en 1920 y tiene su sede en Leawood, KS.
Esta Compañía NO COMPARTE DIVIDENDOS.
¡Buena suerte!
“I believe in analysis and not forecasting.” / "Creo en el análisis y no en el pronóstico".
REMEMBER : I am not a financial adviser nor is any content in this article presented as financial advice. The information provided in this blog post and any other posts that I make and any accompanying material is for informational purposes only. It should not be considered financial or investment advice of any kind. One should consult with a financial or investment professional to determine what may be best for your individual needs. RECUERDE : No soy un asesor financiero y el contenido de este artículo no se presenta como asesoramiento financiero. La información provista en esta publicación de blog y cualquier otra publicación que haga y cualquier material que la acompañe es solo para fines informativos. No debe considerarse asesoramiento financiero o de inversión de ningún tipo. Se debe consultar con un profesional financiero o de inversiones para determinar qué es lo mejor para sus necesidades individuales.

AMC $ ALERT Wedwe accumulated for weeks above our support the 3.82$, now we have a breakout from the resistant , if we continued to hold above our current support 4.15$+ will confirm the bullish momentum towards the 2 profit taking .

AMC $ Breakout we had double bottom above the 3.82$, and now we broke from our ascending line. first sign of strength , now we need to break the resistant at 4.31$ to continue to go higher towards the 2 profit taking and squeeze area around the 5.37$.
if we got rejected at 4.31$, it's means we going towards the bottom price above the 3.33$.

AMCNot financial advice. The essence of investing & trading is the intelligent and patient preying on the greed, fear, impatience, addiction and ignorance of the majority. It's definitionally Darwinian.

AMC MOASS TODAY AT 2PM !!! As you can see TA is the only thing that has been working out for AMC. TODAY T+90 MEANING THAT..... we must moass today and otherwise thursday moass at 2

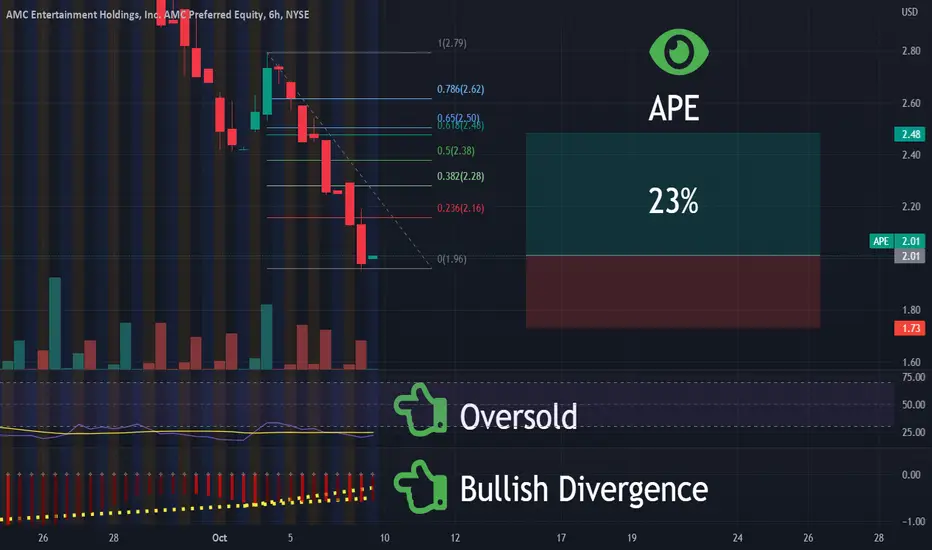
APE Squeeze $ Alert we got our breakout before the market closes last Friday as we spoke about it on our live streaming, now we holding above that major support box (1.85$/2$) if we did hold above that box, we going to have another pump to test our first profit taking around the 2.43$, then the second profit taking and squeeze area above the 2.80$.

Billions of shares sold short, market manipulation, and CitadelOver the past few months, the AMC/APE craze has been underway, with plenty of retail investors spamming various social networks and prompting others to buy the company’s shares. As per the information in tweets, memes, and messages, this retail investors’ uprising aimed to bring down hedge funds, with the central target being Citadel.
There were numerous instances during this time when people claimed the price of shares would burst into multiples if all investors stuck together and continued buying collectively, not allowing hedge funds to buy shares and close their short position (leading to their downfall). In fact, during this period, we encountered numerous statements about billions of shares being sold short. Meanwhile, only about 513 million shares were outstanding for AMC and 519 million for APE in the third quarter of 2022. At the same time, the short interest on AMC shares amounted to approximately 20%, with 101 million shares being sold short; and only 33.5 million shares of APE being sold short.
These figures obviously deviate too far from what the retail narrative promotes. Furthermore, many people promoting this narrative and encouraging others to buy shares do not seem to realize what they are doing might be potentially criminal and classified as market manipulation. Furthermore, a lot of information concerning the whole craze is entirely wrong. Many people seem confused about “wrapped-AMC token” with over 8 000 000 000 000 000 in supply being related to the AMC company. However, anyone can create a token and name it “AMC token,” regardless of whether it is associated with the company. As for Citadel, we have failed to find any disclosure of their short position on AMC/APE during the respected period.
In our series of tweets last month, we warned that the regulator has most likely learned a lesson from 2021 and would step in and halt trading if buying activity picked up significantly. Shortly after that, that is what occurred when the regulator poured cold water on the rally with a temporary halt to trading. Year to date, shares of AMC are down approximately 70%, which is far away from what was promised by those shouting “buy and hold.” Therefore, this whole situation should serve as a reminder of being cautious about what you see and listen to. Always do your due diligence.
Illustration 1.01
In the 2021 meme stock hysteria, shares of AMC jumped up as high as 44.61$.
Please feel free to express your ideas and thoughts in the comment section. Additionally, if you have more information on this topic, feel welcome to share it with us.
DISCLAIMER: This analysis is not intended to encourage any buying or selling of any particular securities. Furthermore, it should not be a basis for taking any trade action by an individual investor. Therefore, your own due diligence is highly advised before entering a trade.

AMC $ Bottom 2022we about to visit an important bottom above the 3.33$+, but first we going to see buying pressure above the 3.90$ to go totes the near the resistant 4.70$, if we got rejected it's means the short in control and price will keep going down to the 3.33$ bottom .

AMC ready to fade. Too Much Big Short Money to OvercomeI like the theory of beating the Hedge Funds and their over capitalized naked shorts
but the reality of the markets is that they exist to hurt us (the poor and middle class).
I'm expecting a fake breakout sometime between now and Christmas, this will pull in a final round of suckers.
then going into the new year, this will print a definitive new lower low on a ton of volume.
The AMC Movie Theatre business fundamentals don't matter at all, this is a meme asset that is narrative and emotion driven only

AMC Bottom $ we have one level to confirm the bearish or the bullish control which is the level 7.10$, if we never over come this resistant, we going to see test for the 2 support levels around the 4.50$ and 3.33$.
however if we broke the 7.10$and held above this time , we going to have a bullish momentum to take us till the 10$ and to squeeze price for amc which is above the 18$+.

AMC Setting up for pullback scalp on lower time frames.AMC seems a bit overextended here and I think this tweezer top pattern is a sign of a local top. I think we can go down back into the consolidation zone for now. I don't expect AMC to moon unless the general market holds stable. Not financial advice, DYOR

AMC Bullish setupOn 4H $AMC shows a bullish flag. If we do not face new short attack, the possibility of staying above 200MA on 4H is very likely.
On the daily timeframe, we are still below 200MA. At this point 200MA acts like a major resistance.
I say we will test 9$ very soon.

AMC: The MOST IMPORTANT support levels to work with!• Since our last analysis, AMC has been respecting the 38.2% retracement. It hit the retracement at least 5 times in the past two weeks;
• Originally, I thought the 50% was the most powerful support (after all, it is a dual-support level), but the 38.2% is a dual support level too, as the 21 ema finally got there;
• This is a classic time correction, when the price moves sideways, until the 21 ema catches up with it. This is different than a price correction, when the price drops to hit its previous support levels;
• All of this means that AMC is quite resilient, and as long as it stays above its retracements, the bullish bias will persist – only if it loses the 61.8% I see it below $5 again;
• Right now, the key resistance is the blue area. By breaking this ceiling, AMC would seek the next target, around $10 again. I’ll keep you updated on this.
Remember to follow me to keep in touch with my analyses!

Inverse BTC IndicationThe last time this happened, we ran to 70+$.
This has to be it. Still balls deep in AMC/APE and still convinced that this is the end game. Btc drops, we fly. It‘s really that simple, my friends.
Spy looks juicy, crypto looks dead and AMC is more alive than ever!
Stay zen my friends, good times are ahead!
Nfa.

APE | Swing Trade | LongAMC Entertainment Holdings, Inc., through its subsidiaries, engages in the theatrical exhibition business. The company owns, operates, or has interests in theatres in the United States and Europe. As of March 1, 2022, it operated approximately 950 theatres and 10,600 screens. The company was founded in 1920 and is headquartered in Leawood, Kansas.

APE | Its Going to Be Bananas | LongAMC Entertainment Holdings, Inc., through its subsidiaries, engages in the theatrical exhibition business. The company owns, operates, or has interests in theatres in the United States and Europe. As of March 1, 2022, it operated approximately 950 theatres and 10,600 screens. The company was founded in 1920 and is headquartered in Leawood, Kansas.
$AMC: Long Target 24.64$⚡Inverse Head & Shoulders Pattern forming?
⚡Neckline resistance 13.5$ Supported by Ichimoku Cloud resistance
⚡Bearish Divergence on the MFI, watch for a bounce at the 5.85$ area (huge liquidity zone)
⚡To confirm the Inverse Head & Shoulders Pattern a break of EMA 1 resistance is needed (8.6$ along with EMA 2 resistance, 10$)
⚡Strong VPVR resistance to the 12$ level
⚡Target of the Inverted Head & Shoulders i 24.64$ measured from the head to the top of the neckline
⚡Confirmation of this pattern is once the Ichimoku Cloud is broken forming a right shoulder (engulfing volume)
*WARNING* This thread is not financial advice. I am not a financial advisor.

AMC downtrend H&S?Odd place for a H&S, but as far as the structure of the pattern its pretty textbook with a retest. The position of it is a little unusual to me.
Let me know what you think, and if you've ran into a H&S positioned this way.

$AMC: Breakout?- VWAP Broken with engulfing volume.
- EMA resistance at 8,3$ (Daily close above = bull)
- EMA Resistance at 9.1$ (Daily close above = bull)
If 8.3$ gets rejected lower targets could occur.
*WARNING* This thread is not financial advice. I am not a financial advisor.

Will AMC's Short Squeeze Continue?Primary Chart 1 : AMC Price on the Daily Chart with Significant Fibonacci Levels Noted
Will AMC's Short Squeeze Continue?
Another short squeeze has successfully launched a few lucky traders into the stratosphere. Maybe more than a few if some take profits timely. AMC has risen about +183% above its low on May 12, 2022. In the past several days since July 27, 2022, it has risen about 99.06%. All signs point to another short squeeze similar to the prior ones. Even volume patterns look the same—albeit much smaller than prior volume patterns.
The short squeeze could continue as it did in June 2021. Short squeezes don't necessarily stop because everyone things price has gone too high. This article does not take a position on whether AMC is destined to revisit this year's lows or make new all-time lows. And predicting the behavior of numerous market participants—the retail buyers looking for a squeeze and the short sellers looking for a flush—and analyzing how such behavior is affected by other macro issues such as interest rates and liquidity in light of tightening Federal Reserve monetary policy would be a futile endeavor.
As a result, one may look to technical analysis to try to make a prediction about the probabilities.
Note on Primary Chart 1 how the price patterns at the prior short squeeze on March 29, 2022, and today's short squeeze, look nearly identical. Compare the two yellow ellipses on Primary Chart 1 above. Both peak candlesticks have an extremely tall bullish candle preceding them. And both sport a long upper shadow (or wick).
Some technicians call this a Pinocchio candle or bar. This type of price bar shows up when the bar breaks temporarily above a level of resistance and then falls back below it. It also can appear when the bar breaks temporarily below a key support level, and then reclaims that level by the close of the bar. Some basics of Pinocchio bars follow below for those unfamiliar with the term:
Martin Pring, a technical expert, writes that these bars "give a false sense of what is really going on." Pinocchio bars tend to create bull or bear traps depending on the direction the long upper shadow points.
Upside breakouts, such as here with AMC, lock in unwary longs with a loss by the close of the bar. Shorts similarly get stopped when intraday bars pierce well below support and then whipsaw back above that support by the close.
In Martin Pring's books, he further explains that the "false break" that develops is " indicative of exhaustion since the price cannot hold above the strong resistance reflected by the line ."
In short, like the character Pinocchio's nose that grows when he lies, the price move beyond the resistance / support ends up being a false move, and the bigger the false move, the bigger the lie.
In summary, the Pinocchio bar with a long upper shadow, especially when viewed along side other similar bars over the past year, imply that price has likely exhausted to the upside for the time being.
Further support for exhaustion is evident. Note how the Fibonacci projection levels have provided strong support and resistance repeatedly since the all-time high in June 2021. Primary Chart 1 labels those levels and points out their operation as strong resistance on multiple occasions.
The last two rally attempts occurred in December 2021 and March 2022. Both these rally attempts failed at the .50 Fibonacci projection (green line shown on Primary Chart 1). For the current rally, the price bars with the long upper shadow pierces the next Fibonacci level of importance in the sequence: the .618 level which lies just below the .50 level . This also supports at least a temporary pullback or consolidation.
Additional evidence supports exhaustion. Note below how AMC's price has now risen to +5 ATR on the daily and its candle has a long upper shadow. Moves to +3 ATR are rarely sustainable for long much less +5ATR. In the chart below, note the location of price relative to the +3 ATR Keltner Channel. The +3 ATR KC is the outermost band on the upper edge of the KC bands.
Supplementary Chart 2.1: AMC's price well above +3 ATR band on the Daily Chart using Keltner Channels
Supplementary Chart 2.2: AMC's price relative to the +5 ATR band on the daily chart using Keltner Channels
Finally, note the declining volume on each successive short squeeze. This suggests that the buying pressure has waned as short squeezes have continued following each major decline.
Supplementary Chart 3.1: AMC's price well above +3 ATR band on the Daily Chart using Keltner Channels
But the persistence of the buyers squeezing the shorts should be recognized as something that is a new force in markets since what occurred in 2021. Price could indeed push higher if enough collective buying force continues in stock and options markets sufficient to overwhelm all supply. Price can do a lot of things no one expects.
But based on technical analysis alone, however, price likely falls lower from here. This author makes no argument that new lows will be reached. It will be important to watch the pullback to answer that question. A reasonable price target would seem to be 16.50 near the .618 retracement of the rally from the May 12, 2022, low to the August 8, 2022 high.

$AMC: Breakout to 15$?⚡200 Weekly level mounted (huge resistance now became support)
⚡Support trendline held with a bullish engulfing + volume + bullish divergence on the MFI
⚡Golden pocket fib resistance
⚡Ichimoku Cloud broken
⚡VPVR support mounted at 9-9.7$
⚡10.86$ resistance confirmed by 0.5 fib + VPVR node
⚡12$ resistance confirmed by 0.382 fib + VPVR node + Ichimoku cloud resistance at 11.5$
⚡Moving towards the upper trendline which is located at the 15$ level
*WARNING* This thread is not financial advice. I am not a financial advisor.

$AMC: Price Target 15.5$🔥Bottoming signal on monthly (4-month bottoming pattern consolidation) + Bullish MFI
🔥Monthly Ichimoku low confirmed as bottom followed by TD-Sequential 9
🔥200 Weekly Moving Average Resistance at 9.45 (This should be reclaimed due to the open interest at this level)
🔥Monthly resistance at 11.6$ confirmed by Ichimoku Cloud
🔥7.86 Fib retracement at 8.3$ confirmed by volume
🔥Price target 15.5$ (surpass 2.36 fib to retest resistance at 15.5$)
🔥VWAP broken o daily chart (Bullish signal)
🔥Vix Fix indicator strong bottoming signals on daily chart
🔥Watch for an engulfing amount of buying-volume
🔥VPVR support at 8-8.80$
🔥VPVR resistance at 10$ confirmed by EMA - Ribbons
*WARNING* This thread is not financial advice. I am not a financial advisor.
Thank you for reading.
