Amd - New all time highs will follow!🪠Amd ( NASDAQ:AMD ) rallies even much further:
🔎Analysis summary:
After Amd perfectly retested a major confluence of support a couple of months ago, we saw a textbook reversal. This retest was followed by a rally of more than +100% in a short period of time. But considering all the bullish momentum, Amd is far from creating a top formation.
📝Levels to watch:
$200
SwingTraderPhil
SwingTrading.Simplified. | Investing.Simplified. | #LONGTERMVISION
Amdprediction

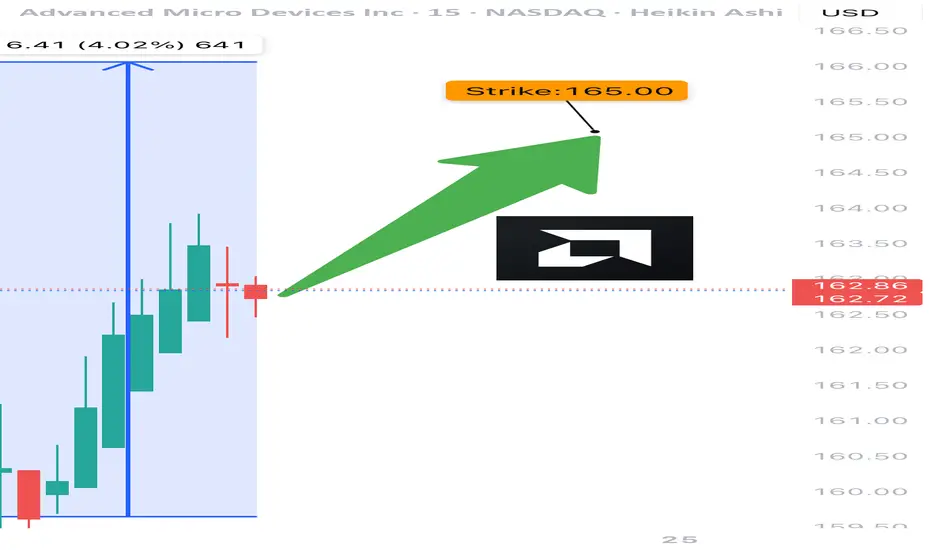
AMD TRADE ALERT (07/24)
🚨 AMD TRADE ALERT (07/24) 🚨
Options flow is screaming bullish 📈
🧠 Key Insights:
• Call/Put Ratio: 1.80 (🔥 heavy call bias)
• RSI: Daily 75.5 / Weekly 77.2 = strong momentum
• Volume = weak ⚠️ but sentiment remains bullish
• High gamma risk = explosive potential near expiry
💥 TRADE IDEA
🟢 Buy AMD $165 Call exp 7/25
💰 Entry: $0.80
🎯 Target: $1.60
🛑 Stop: $0.48
📊 Confidence: 75%
⚠️ Quick expiry = fast moves. Monitor closely.
#AMD #OptionsFlow #UnusualOptionsActivity #TradingView #OptionsTrading #BullishSetup #TechStocks #DayTrading #GammaSqueeze #OptionAlerts
The AMD Long Heist – Ready to Rob the Bulls?!🚨 AMD Stock Vault Heist: Bullish Breakout Plan with Thief Trading Style! 📈💰
🌟 Greetings, Wealth Raiders & Market Mavericks! 🌟
Hello, Ciao, Salaam, Bonjour, and Hola to all you savvy traders! Ready to crack the AMD Stock Vault (Advanced Micro Devices Inc.) with our 🔥 Thief Trading Style 🔥? This high-energy strategy blends technical precision with fundamental firepower to execute the ultimate market heist. Let’s dive into the plan, lock in profits, and escape the high-risk resistance zone like pros! 🏆💸
📝 The Heist Plan: AMD Bullish Breakout Strategy
Our chart lays out a long-entry blueprint designed to capitalize on AMD’s bullish momentum. The goal? Swipe the profits and exit before the bears take control at the resistance zone. This is a high-reward, high-risk setup, so stay sharp! ⚠️
📈 Entry: Crack the Vault!
Timing: Strike when the vault is open! Place buy limit orders on pullbacks within a 15 or 30-minute timeframe targeting the most recent swing low or high.
Tactic: Use a Dollar Cost Averaging (DCA) or layering strategy to stack multiple entries for optimal positioning.
Pro Tip: Look for bullish confirmation (e.g., candlestick patterns or volume spikes) to ensure you’re entering with momentum. 🚀
🛑 Stop Loss: Secure the Getaway!
Place your stop loss below the nearest swing low on the 3-hour timeframe (around $148.00 for day/swing trades).
Adjust based on your risk tolerance, lot size, and number of layered entries.
Why? This protects your capital from sudden reversals while giving the trade room to breathe. 🛡️
🎯 Target: Cash Out Big!
Aim for $179.00, a key resistance zone where bears may counterattack.
Watch for signs of overbought conditions or consolidation near this level—be ready to take profits and treat yourself! 💪🎉
💡 Why AMD? The Fundamental Fuel ⛽
AMD’s bullish surge is powered by:
Tech Sector Momentum: Strong demand for semiconductors and AI-driven chips.
COT Report Insights: Institutional buying pressure (check latest Friday COT data, UTC+1). 📅
Macro Tailwinds: Favorable economic conditions and positive sentiment in tech indices.
Geopolitical Stability: No major disruptions impacting tech supply chains.
Intermarket Edge: Monitor NASDAQ 100 and semiconductor ETFs for correlated moves. 📊
For a deeper dive, review:
Macroeconomic trends
Sentiment analysis
Index-specific correlations
Future price projections (overall outlook score: Bullish). 🌎
⚠️ Trading Alert: Navigate News & Volatility 📰
News releases can shake up the market like a rogue alarm system! To stay safe:
Avoid new trades during major news events (e.g., earnings or Fed announcements).
Use trailing stop-loss orders to lock in profits and protect open positions.
Stay agile—monitor real-time updates to adjust your strategy. 🚨
📌 Risk Disclaimer
This analysis is for educational purposes only and not personalized investment advice. Always conduct your own research, assess your risk tolerance, and align your trades with your financial goals. Markets move fast—stay informed and adaptable! 📚
💥 Boost the Heist! 💥
Love this Thief Trading Style? Smash the Boost Button to supercharge our robbery squad! 💪 Every like and share fuels our mission to conquer the markets with ease. Join the team, steal the profits, and let’s make money rain! 🌧️💰
Stay tuned for the next heist plan, you legendary traders! 🤑🐱👤🚀

AMD in cross section of 2 important levelsAMD is at the crosssection of 2 important
trend lines
1. from Jun22 lows to sep23 lows and Aug 24 lows,
breaking down in Dec24.
2. The channel from Mar24.
I hope the price comes down to 133 levels.

Advanced Micro Devices | AMD | Long at $126.00Advanced Micro Devices NASDAQ:AMD may be the sleeping giant in the semiconductor / AI space. While all eyes on NVidia NASDAQ:NVDA , earnings for NASDAQ:AMD grew by 800% over the past year... and are now forecast to grow 40% per year. Any other company would be soaring right now (like NVidia), but that company is getting all the attention. And, to me, this means opportunity for the future. The cashflow is likely to grow tremendously for
NASDAQ:AMD into 2027 and beyond, which may inevitably reward investors with dividends.
From a technical analysis perspective, NASDAQ:AMD just entered my historical simple moving average zone. This area (currently $108-$126) is where I will be gathering shares. Something tremendous would have to change regarding the fundamentals of this company (like a scandal) for the overall thesis to change. There may be some near-term price pains as NVidia gets all the focus, but to meet demand in the semiconductor and AI space, NASDAQ:AMD is poised to fulfill that roll in the future.
Target #1 = $158.00
Target #2 = $175.00
Target #3 = $188.00
Target #4 = $205.00

Big move for AMD monday inverted H&S greatly confirmed 150USD!!!The pattern have been greatly confirmed for me and i will sell my amd this week at 150 USD and i will wait at july when a drop will occurs to rebuy and i will cumulate more stock or more profits in cash.
The information and publications are not meant to be, and do not constitute, financial, investment, trading, or other types of advice or recommendations.
Thank you!
Subcribe TSXGanG! (For real chart)

Inverted H&S on AMD BULLISH FOR MONDAY !!!! 150$USD JUNE END!!!Analysis of the Inverted Head and Shoulders
- Left Shoulder: The price first dipped, formed a trough, and then rebounded.
- Head: The stock dropped further, creating a lower trough than the left shoulder, followed by a recovery.
- Right Shoulder: A higher low formed, aligning with the left shoulder before the price moved upward.
- Neckline Breakout: The confirmation of this pattern comes when the price decisively breaks above the neckline (resistance level), suggesting a continued uptrend.
Potential Outcomes
- Bullish Breakout: Once the neckline is breached, a surge in buying pressure could push prices higher.
- Volume Confirmation: Increased trading volume at the breakout strengthens the validity of the pattern.
- Price Target: Traders often project the price increase by measuring the distance between the head and the neckline, then adding this to the breakout point.
Given the current price action, this setup could indicate a strong bullish continuation. However, market conditions and external factors should always be considered before making trading decisions.
If you want to refine this analysis or explore other scenarios, I'm here to dive deeper into key points! 🚀 Subscribe! TSXGanG
I hold a CCVM and MNC (Certificate of Competence to become a securities broker anywhere in Canada) and have been working as a trader for five years.
It’s a pleasure for me to help people optimize their trading strategies and make informed financial market decisions.

AMD: Short-term Upward PotentialAMD has continued to face downward pressure, preventing further progress in green wave . While this wave still has room to rise, its top should form below resistance at $141.16. Once wave completes, wave should follow—finishing the larger green impulse to the downside and completing the corrective structure of blue wave (II). This move is expected to conclude in our blue Long Target Zone between $62.82 and $35.19. That said, we continue to monitor a 30% alternative scenario: it suggests that wave alt.(II) has already bottomed at $76.12. In that case, AMD wouldn’t visit the blue zone but instead break out directly above the resistances at $141.16 and $174.98—marking the beginning of wave alt.(III).
📈 Over 190 precise analyses, clear entry points, and defined Target Zones - that's what we do.

AMD analysis What I’m seeing here is that the price made a false breakout below the 200 EMA, just like it did in the previous move back in early 2023. It dipped below, tricked a lot of people, then snapped back up strong.
Now it’s kind of repeating that same behavior another fake break below the 200 EMA and a bounce If history repeats we might see a similar upside move from here.
Just my personal view — not financial advice. Markets are unpredictable, so always be cautious.

AMD: Wave (3) of [3]As anticipated, AMD has realized strong sell-offs, breaking below the support at $121.82. We primarily expect the magenta wave (3) to conclude further south, followed by a corrective rise in the subsequent wave (4). Below $121.82, however, the stock should resume the magenta downward impulse and, thus, start wave (5).

AMD's Epic Surge or Plunge: Unveiling Key Levels for 2025!Good morning, trading family! Let's talk about AMD today. If the stock price goes above $130, it could go up to $142, then $157, and maybe even $169. But if it goes below $114.12, it might drop down to between $93 and $97.
If you want to learn more about sustainable trading, feel free to join my webinar this Sunday. Send me details to learn more.
Kris/Mindbloome Exchange
Trade What You See

Earning report Today! Can $AMD breakout the downtrend line?
Technically, AMD is closing to the downtrend line again. There was a FAKEOUT three weeks before.So will NASDAQ:AMD truly breakout the downtrend line this time?
It will depends on the earnings report today!
Here are 3 Things I'm Watching in NASDAQ:AMD 's Earnings on Tuesday
1. MI300 Series: Flagship AI GPU
• Their new Instinct MI300 series GPUs are built to compete directly with NASDAQ:NVDA H100 chips, supporting both training and inference for large-scale AI models. The MI300 offers high memory capacity and multi-chip module (MCM) architecture, making it suitable for AI workloads that require massive data processing. Early deployments include partnerships with key cloud providers like NASDAQ:MSFT Azure -- which is leveraging AMD’s GPUs for its AI infrastructure.
2. AI-Powered Accelerated Processing Units (APUs)
• Their APUs, which combine CPU and GPU capabilities on a single chip, are designed to handle AI tasks efficiently in edge computing and consumer applications. For instance, AMD’s latest Ryzen AI-powered APUs provide AI acceleration directly in laptops -- aiming to improve tasks like image processing and natural language interactions.
3. Capturing AI Market Share
• Their approach is centered around capturing a larger share of the rapidly growing AI semiconductor market, which is projected to surpass $400B by 2030. As AI models become more sophisticated, they require increased computational resources. AMD’s focus on energy efficiency and competitive pricing allows it to offer alternatives to Nvidia, making it more appealing to enterprises managing rising energy costs and budget constraints. Unlike Nvidia, which has historically focused on high-end GPUs, AMD’s diverse product mix, including CPUs, APUs, and data center GPUs, enables it to serve a broader range of AI use cases. This could lead to more consistent revenue growth as AI applications proliferate beyond just data centers -- spreading into edge devices and personal computing.

$AMD will just start a rally!!!
AMD is moving in a bullish channel, and just has retested the previous downtrend line.
The green candle of yesterday signals that the price is supported, and will start to go bullish!
as far as i'm concerned, I will place my buy order at this area.

$AMD will just start a rally!!!
AMD is moving in a bullish channel, and just has retested the previous downtrend line.
The green candle of yesterday signals that the price is supported, and will start to go bullish!
as far as i'm concerned, I will place my buy order at this area.

AMD CALL Bought AMD Call
Strike $180
Expiry 14 Jun
Entry $2.50
Expecting AMD to reach
1st Target $184
2nd Target $193
Analysis as below:
Weekly TF:
1. Uptrend -- Above SMA200
Day TF:
1. Structure -- Inverse Head and shoulder (broke out of neckline, now retesting)
2. RSI -- bullish divergence
4hr TF:
1. MA -- Price closed above EMA 25 (blue)
2. Fib R -- Price closed above 0.618 Fib R aka $158 (uptrend in tact)
3. Confirmation candle -- printed green body candle after bouncing off EMA 25 and 0.618.
4. RSI -- not overbought yet/no bearish divergence (More room for upside)
Remarks:
Price is currently testing the resistance of SMA100(purple) for the 5th time.
The frequency of price testing to break SMA100 becoming shorter (Weaker selling pressure)
If price is able to close above SMA50(green) and SMA100(purple), expect AMD to rally in no time.

AMD PRICE ACTION 23 JULY 2024This is the price action for AMD. If you have any doubts, make sure to DM here. I have discussed all the levels and my trade action as well.
NOTE:SELLING PRESSURE IS WAY TOO MUCH

AMD GO HIGHERHello fellow stocks traders, currently working and watching this stock before it fall, my assumptions to the highest level is 220-243$ before it retrace.
Were on the 2nd moves for distribution type.
Betting the highs is not optional on shorting. best case is that we dont know whats happen next.
This is only my assumptions before it dump.
This is not a financial advice.
Follow for more Stocks to trade.
Trading is risky, dont trade it own it.

AMD Short Trade Opportunity - Very Overbought in a Greedy MarketNASDAQ:AMD is currently above a resistance level, and I think the price is very overbought here. There is still some bullishness short-term, but shorts have been getting wrecked and I wouldn't FOMO here. Maybe there could be a short trade setup once AMD stops trending up. I like the current price levels for shorting.
I believe semiconductor chip stocks have been extremely bullish, and I haven't wanted to be against them. However, they seem very overvalued at current prices, and I think the market could get a pullback soon. I think the AMD stock price and RSI will need a correction within the next few weeks. The correction could put AMD around $140 price levels.

ANALYSIS ON AMDDear Traders and Investors,
I'm sharing with you this analysis on AMD to tell you to close your position if you're holding a long trade, as you can see in the chart, the price pulled back on the 0.5 level of the fib and gave us a confirmation, now it's heading towards the 0.6.
For further question, don't hesitate to ask!

$AMD Due for a Correction This WeekAMD has been showing a lot of bullishness since September 26. However, AMD has reached the upper range of the white channel and is due for a correction this week. I have the yellow trend line as a key support level and my first price target. I think there will be a solid bounce off this yellow support line in the short term.

AMD Daily timeframeafter valid breakout from wedge patern in daily timeframe with candle we can enter to long position with 4 risk to reward that its good
maybe price want to meet trend line again.. pay attention to this
good luck

$AMD Quarter 3 (Q3) AnalysisAMD is playing out as planned since the initial Q2 prediction with a dip into the buy zone. I’ve been saying that AMD is an excellent buy opportunity under $100, and the bearish August and September price action has helped to send AMD down to this price level. I have $158.53 as a key price target for Q4, and I believe that AMD will form a new all-time high afterwards. Long-term I think AMD will be a $400-500 stock. The yellow trendline has been acting as a support level and AMD just formed a bullish bounce off this support. The red trendline will act as short-term resistance on the way up.

AMD BUYHi, According to my analysis of AMD stock, there is a good opportunity to buy. Or a long-term investment. All reasons for purchasing are explained as shown in the analysis. Good luck everyone
