AMD over-extended, potential swing short for ~18%Expect correction over next few weeks down to ~$68-70. Watch closely at these highs, get out if it pops this ~$87 for another all time high.
Amdshort


AMD going to drop down? HUGE RAISING WEDGE I'm thinking this is going to burst down because of the huge raising wedge forming, the stock seems to bounce up and down a lot meaning that it's losing a lot of momentum. instead of breaking resistance levels lately it seems just retest them many times.
I'm thinking it will go down a dollar or 2 on open then quickly be bought back up, what are you guys thinking.

I'm Looking For a Short On AMD Around $90I have kept my eye on lookout for a spot to short AMD.
Price has been playing this rising wedge perfectly.
We were looking to short it not too long ago if it would of broke through the support.
Instead it surged to return to the top of the wedges resistance.
We are now approaching the $90 level. I am interested in taking a short position their based off the pattern recognition. This will be an aggressive play. If were to break the top of resistance I will look to exit. First we need to see if we will get to $90. I stand firm on that price target.
Best of luck!

AMD Short BetAMD short possibility
Just above the channel
This is quite a large channel a return back to the channel is more likely than a breakout.
This is an intraday chart. For leverage traders.

Explosive Performance As support Never Broke. Rising Wedge(AMD)We were analyzing this one about a month ago with signs of it Squeezing under the most recent horizontal high as it ranged sideways towards long term support.
Major explosive bull movement breached the high and now is proceeding to play the top range of the massive rising wedge on a 3day chart.
I'm mainly interested in playing the breakouts of the major s&r levels on this one.
Stay tuned.

$AMD Sell of towards earnings AMD some solid action today. Leaning more towards the sell side, but had a lot of accumulation today. AMD Inc. (AMD) is expected to report its Q2 earnings later this month on July 29. They missed earnings last time, but some call buying came in today.


NZDUSD Liquidity RaidExpecting a BMS Possibly For a Bearish Run. Liquidity Pool at the EQL, Smart Money might seek out that liquidity first, raid it and go back for a Judas Swing before the bearish Run

Short AMDMayby we have tripple top on AMD. I'm prognose short possition, which stop around 40-43 USD (medium time trend line) in the nearest future

🚨🚨🚨 This One Is a MUST LOOK NOW!!! (AMD)💰 LET'S GET INTO SOME ADVANCED MICRO DEVICES ANALYSIS!💰
1️⃣ First off SMASH that LIKE BUTTON & Give us a FOLLOW for DAILY ANALYSIS! ❤❤❤
(Overall Market Sentiment) 🐻 Bearish
AMD looks to be a massive rising wedge from back in 2015 lows. Notice how every major structural support and resistance now now funneled into this tight range at the very top of price consolidation. It even seems to represent 5 major waves of structure which could validate an Elliott wave pattern. I'm not the biggest fan of Elliott wave theory as I think it can be misleading, but this is a good representation of wave structure that made the pattern overall. This looks insane! I would not be surprised if once broke down it collapses. Based off o just the S&R and structure I see a major play coming. Be ready for this one! If I'm wrong I will be in shock lol.
Best of luck to you and all of your trades this week! 🤜
Drop your charts and comments down below, share with us what you think is going on in the markets! ❤❤❤
Thanks for checking out our analysis! ✌😁✌
🥇MLT | MAJOR LEAGUE TRADER

does it break resistance at 56.71?AMD looks bullish with this price action but it can sustain ?
it is running on 200ma and also have bullish price action
see what is next further info will be updated..
for more info go to the blog..

$AMD Neutral IdeaNASDAQ:AMD More bearish on this name but too much money came in to ignore. Keeping eyes on this one over $57 for a possible breakout to $60+.
Bearish PT: $53 lower


ORDER: SELL After a strong breakthrough, the support zone 1 and high probability to the trend go done to test the support line 3

ANALYSE: AMDafter rupture point on the strong support line, High probability to the trend go down to the support line

ORDER: BUYaverage price+volume in the rang trade Above the line vwap
high probability to the trend breakthrough resistance line 1 and go up to the resistance line 2

5.15.2020 AMD Bearish divergence, strong resistance at top. Short with a tight stop, looking possible to trend change.
-NFA

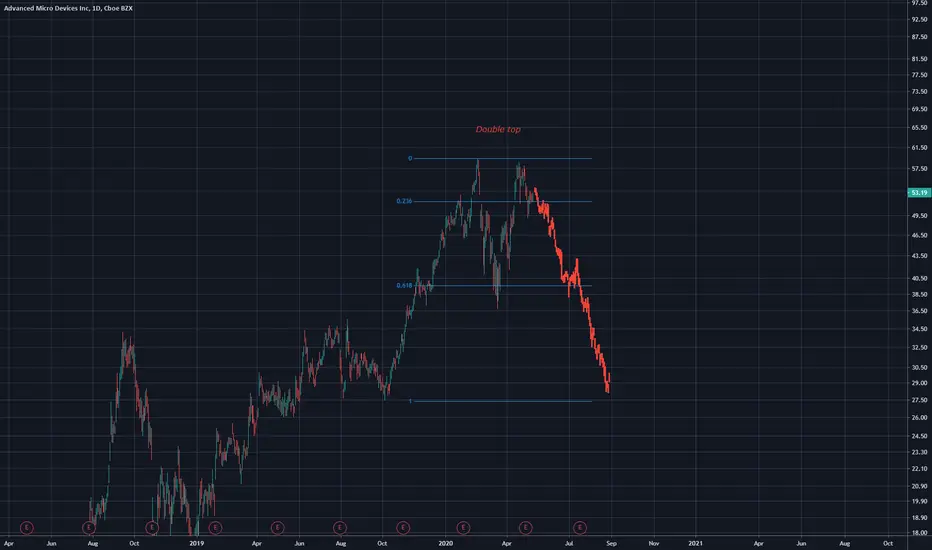
Some cool possible price symmetry AMDBearish price symmetry
Looking for a double top correction
Longer term charts for AMD, anyone interested
Long Opportunity Coming in AMD?Like in gold prices, we didn't get the expected dump we use to see at the B extremity of a flat correction . A triangle is possible in AMD . Prices might be pushed by the pushed by the daily Vegas waves.

Like Several Stocks, AMD Could Be in a 1212 StructureLike Several Stocks, AMD Could Be in a 1212 Structure

ADVANCED MICRO DEVICES INC (AMD) Monthly, Weekly, DailyDates in the future with the greatest probability for a price high or price low.
The Djinn Predictive Indicators are simple mathematical equations. Once an equation is given to Siri the algorithm provides the future price swing date. Djinn Indicators work on all charts, for any asset category and in all time frames. Occasionally a Djinn Predictive Indicator will miss its prediction date by one candlestick. If multiple Djinn prediction dates are missed and are plowed through by same color Henikin Ashi candles the asset is being "reset". The "reset" is complete when Henikin Ashi candles are back in sync with Djinn price high or low prediction dates.
One way the Djinn Indicator is used to enter and exit trades:
For best results trade in the direction of the trend.
The Linear Regression channel is used to determine trend direction. The Linear Regression is set at 2 -2 30.
When a green Henikin Ashi candle intersects with the linear regression upper deviation line (green line) and both indicators intersect with a Djinn prediction date a sell is triggered.
When a red Henikin Ashi candle intersects with the linear regression lower deviation line (red line) and both indicators intersect with a Djinn prediction date a buy is triggered.
This trading strategy works on daily, weekly and Monthly Djinn Predictive charts.
Trades made when the monthly, weekly and daily arrows are pointing in the same direction are the most profitable.
This is not trading advice. Trade at your own risk.
