AMZN

AMZN, 1 HrsNASDAQ:AMZN
Disclaimer : I am not a financial advisor nor a registered investment professional. This content is for entertainment purposes only and is not investment, tax, or financial advice. Always do your own diligence and research. You are solely responsible for all investment, tax, and financial decisions that you make.


BTC Pattern for the next 2 years. This chart resembles a correlation between BTC and AMZN (early days).
Anywhere near $10,000 or below will see a heavy buy resistance and will likely accumulate for a year before initiating a new bull cycle.
Of course, BTC might take a different stance and decouple from this pattern due to regulations and restriction, but very interesting to see how it ends.
If you're excited to see where would this end if BTC to follow AMZN foot steps for another 10 years comment below.
Thank you and Do your own research.

Amazon at key area? Amazon
Short Term
We look to Buy at 125.43 (stop at 118.42)
Preferred trade is to buy on dips. Short term bias is bullish. 50 1day MA is at 125.00. Further upside is expected although we prefer to set longs at our bespoke support levels at 125.00, resulting in improved risk/reward.
Our profit targets will be 144.72 and 157.53
Resistance: 146.00 / 170.00 / 188.00
Support: 125.00 / 116.00 / 102.50
Disclaimer – Saxo Bank Group. Please be reminded – you alone are responsible for your trading – both gains and losses. There is a very high degree of risk involved in trading. The technical analysis, like any and all indicators, strategies, columns, articles and other features accessible on/though this site (including those from Signal Centre) are for informational purposes only and should not be construed as investment advice by you. Such technical analysis are believed to be obtained from sources believed to be reliable, but not warrant their respective completeness or accuracy, or warrant any results from the use of the information. Your use of the technical analysis, as would also your use of any and all mentioned indicators, strategies, columns, articles and all other features, is entirely at your own risk and it is your sole responsibility to evaluate the accuracy, completeness and usefulness (including suitability) of the information. You should assess the risk of any trade with your financial adviser and make your own independent decision(s) regarding any tradable products which may be the subject matter of the technical analysis or any of the said indicators, strategies, columns, articles and all other features.
Please also be reminded that if despite the above, any of the said technical analysis (or any of the said indicators, strategies, columns, articles and other features accessible on/through this site) is found to be advisory or a recommendation; and not merely informational in nature, the same is in any event provided with the intention of being for general circulation and availability only. As such it is not intended to and does not form part of any offer or recommendation directed at you specifically, or have any regard to the investment objectives, financial situation or needs of yourself or any other specific person. Before committing to a trade or investment therefore, please seek advice from a financial or other professional adviser regarding the suitability of the product for you and (where available) read the relevant product offer/description documents, including the risk disclosures. If you do not wish to seek such financial advice, please still exercise your mind and consider carefully whether the product is suitable for you because you alone remain responsible for your trading – both gains and losses.

AMAZON formed a 1D MA50/100 Bullish Cross. Accumulation ahead.It's been only 1.5 month since our long-term buy call on Amazon (AMZN):
The price rose aggressively after weeks of accumulation within the 1W MA200/300 and as we projected broke out hitting almost the first important long-term Resistance (1W MA50). On August 16 the price was rejected exactly on the 1D MA200 (orange trend-line), which was the point of rejection on the previous Lower High (March 29) of this 2022 correction phase.
The stock rose almost +45% from its June 14 Low, so profit taking was expected. The 0.382 Fibonacci retracement level broke and the price is just above both the 1D MA50 (blue trend-line) and the 1D MA100 (green trend-line). The former crossed today above the latter forming a technical Bullish Cross, the first such formation since December 03 2021. That was a far from ideal pattern as it broke the uptrend's Higher Lows trend-line and basically was at the start of the 2022 correction phase.
This time the Higher Lows trend-line is much lower (currently around $114.40) so on the medium-term we remain on a downtrend, until the 1W MA50 and Lower Highs Zone break. However, it is the first time we have such a strong and long uptrend on the 1W RSI, with its Higher Lows trend-line still intact.
Practically, as long as the 1D MA50/100 hold, we can expect a re-test of the 1D MA200. If they break, there is still a chance of finding Support on the 0.618 Fib. Further selling can be done below the Higher Lows trend-line.
--------------------------------------------------------------------------------------------------------
** Please support this idea with your likes and comments, it is the best way to keep it relevant and support me. **
--------------------------------------------------------------------------------------------------------

$AMZN earnings gap fill$AMZN is filling the gap from earnings. Let's see if it fills the whole gap down to 100/50MA that were just about to cross back to normalcy. Doni candle on close might create a new pivot.

XLY Testing Breakout LevelXLY is testing the recent breakout level (former resistance). A hold here would be viewed in a bullish context as former resistance will have become support. This is a key ETF to watch considering the heavy weights of AMZN and TSLA. - Jamie

multi-timeframe analysis for AMZNHello guys
As you see in chart, it formed a QM structure on a flip of monthly time frame, after confirming that structure started bullish movement and in way make a island pattern because of two sides gap. The last gap doesn’t fill so if we get short position, we can put target below that gap(target=$125.41).
Price formed a three-drive pattern and with RSI divergence confirmed this pattern, three drive is a great approach.
always do your own research.
If you have any questions, you can write it in comments below, and I will answer them.
And please don't forget to support this idea with your like and comment.
BE PROFITABLE

How to make an easy 7% profit just with newsI had forgotten to post this yesterday, but it seems interesting to me how some news always works in your favor if you know how to use it

Shopify SHOP - Patience is a VirtueShopify was more or less Canada's version of TSLA or AAPL last year, except it cratered like a memestock. If you look at the monthly, it's an absolute bloodbath, losing 83% in less than a year.
Although prices are currently "cheap" and SHOP seems to be an actually useful company that may have a future, you've got a long way to go before the buying opportunity.
A lot of people see that Shopify spiked to $42 and is down to $32 and think to themselves that it's really quite a discount.
This isn't so bad if you can buy spot and diamond hands it for a few months, but if you're on calls or leverage, you're going to have a bad week.
One of the key tells is that Shopify has been trading in this specific range for three months now. And while it hasn't broken the lows, it did fill its gap during the peak of bear rally hysteria.
And we're now in the feature film "Eight Straight Days of Doom." It's a woke snoozefest, featuring Alec Baldwin. But you paid $27 for a ticket and $318 for a bucket of popcorn and 2 kilograms of Sour Patch Kids, so you're stuck eating 6 weeks worth of calories in 3 hours while watching something unpleasant on an ugly sheet of silver with too many speakers with the volume cranked to the "way too f'in loud" setting.
This is modern human life, and it's nothing to be desired. Traditional human life was much more interesting. The women wore nice dresses, the food was good, and there were harp players and poets in the streets to listen to, instead of Alec Baldwin.
Everything in the market is about to get really scary so that you can sell low in panic and then buy back higher with FOMO starting in October. This is how the game is played.
The caveat to this call is $23 may be too light to enter. Numbers like $18.xx may manifest, although I wouldn't expect those to last for very long.
Either way, that "support" right below $30 is about as useful as trying to hold a bowling ball with a piece of inkjet paper.
Don't get greedy, and don't capitulate. But the upside on Shopify when the Bump and Run Reversal/Return to Normal begins should be quite delicious, if you can wait to buy at the right price and hold on long enough to make it that far.


AMZN shortShort position !
with candle sign for downtrend short position is applicable .3 tops pattern has shaped, it's going to touch the neckline I guess and continue down trend .

AAPL AMD AMZN BAC NVDA TSLA trade ideas - jtgladiator 8/24NASDAQ:AAPL chart www.tradingview.com
Enter calls > 168.71 watch for reversal off gap or this level for puts PT1 = 169.86 PT2 = 171.52
Puts < 166.65 for gap fill down. Watch for reversal here. PT d165 PT w163
NASDAQ:AMD chart www.tradingview.com
Calls 95c - 99c > 94.44 PT1 95.02 PT2 99.25
Puts 90p < 92.11 PT1 90.56 88.59
I am still swinging the 85p until 9/16
NASDAQ:AMZN chart www.tradingview.com
Virtually no volume until 128.99 then 125.50
From there 122 can come quick but there is some volume there
Looking at swinging 122p
129 and 126p are options also
Calls 138c - 141c > 136.32 or puts off the rejection PT 138 141
Puts < 132.85 129p and 126p or monthly 122p
NYSE:BAC chart www.tradingview.com
BAC traded up while SPY was trading down. Outside candle on the daily.
This thing is ready to make some moves. I like it for the downside. But play the chart and levels.
Calls >35c PT 35.30 36.00 - Be careful of reversals. The outside candle can be nasty
Puts < 34.41 PT 34.29 33.92 33.41 Swing 8/26 or later
NASDAQ:NVDA chart www.tradingview.com
Enter 168p < 169.70
Be aware of reversal
Possible Gap fill to 165.31
PT for weekly is 167.24 then 164.28. Grab 9/2 or 9/16 :p
Or grab for earnings lotto
Enter 178c > 174.60 make sure BOH
Watch for reversal
PT 175.58 178.49
NASDAQ:TSLA chart www.tradingview.com
TSLA went green on 8/23.
Call Swing 950c > 896.48. Watch for reversal PT 901 944
Put Swing 825p < 863.77 PT 855 838 818 785
-jtgladiator

AAPL AMD NVDA AMZN TSLA 8/23 jtgladiator #thestratWe are looking for continuation on the swings we entered on 8/22. If there are any reversals to the upside, be sure to secure put profits and take calls
NASDAQ:AAPL chart www.tradingview.com
AAPL Enter calls > 169.86 watch for reversal off gap or this level for puts
AAPL Enter puts < 167.14 for gap fill down. Watch for reversal here. PT 165 PT 163
NASDAQ:AMD chart www.tradingview.com
AMD Call swing > 95.02 with PT1 99.25 - not likely imo
AMD finally broke the double inside weekly to the downside. Swinging them 85p all the way out to 9/16 or longer
NASDAQ:NVDA chart www.tradingview.com
NVDA Enter 178c > 175.58 make sure BOH. Watch for reversal
NVDA puts enter 168p < 170.30. Be aware of reversal. Possible Gap fill to 164.24. PT for weekly is 164.78. Grab 9/2 or 9/16 :p
Or grab for earnings lotto
NASDAQ:AMZN chart www.tradingview.com
AMZN Grab calls > 136.32 or puts off the rejection pt 138 141
AMZN Grab puts < 132.85 for huge swing with PT of 120 and a gap fill all the way down
NASDAQ:TSLA chart www.tradingview.com
TSLA Call Swing 920c > 877.20 - watch for reversal pt 901 944
TSLA Put Swing 800p < 858.90 855 838 785
NYSE:BAC chart www.tradingview.com
BAC Daily Swing Calls BOH 34.75 PT 35.30 36.00
BAC D/W put /swing < 34.45 PT 34.15 33.40 Swing 8/26
-jtgladiator

AMZN Technical Update 8/23/22🔸️Ticker Symbol: AMZN 🔸️Timeframe: 4 Hour 🔸️Investment Strategy: Long
TECHNICAL ANALYSIS: AMZN is primed for an increase in value as long as we can continue in this bull trend. The price of AMZN is currently testing the bottom deviation level on our regression trend indicator which has acted as a strong level of support in the past. We also have our white line on the bottom dashboard representing money momentum in the green buying stage or accumulation stage which does indicate we could see an increase in value as long as we are heading in an upward direction. The take profit area on AMZN if we do continue in this bull trend would be approx. $140 which is the strongest level of support. Thank you for watching. Have a great day!
🔔 Follow for daily stock, crypto and forex technical analysis.
⚠️ Trading is risky, and I understand nothing is guaranteed. Proper risk management should be in place at all times to minimize losses. Please consult a financial advisor before trading. All Inclusive Trading LLC is not a financial advisor and may not be held liable for any losses which may occur.

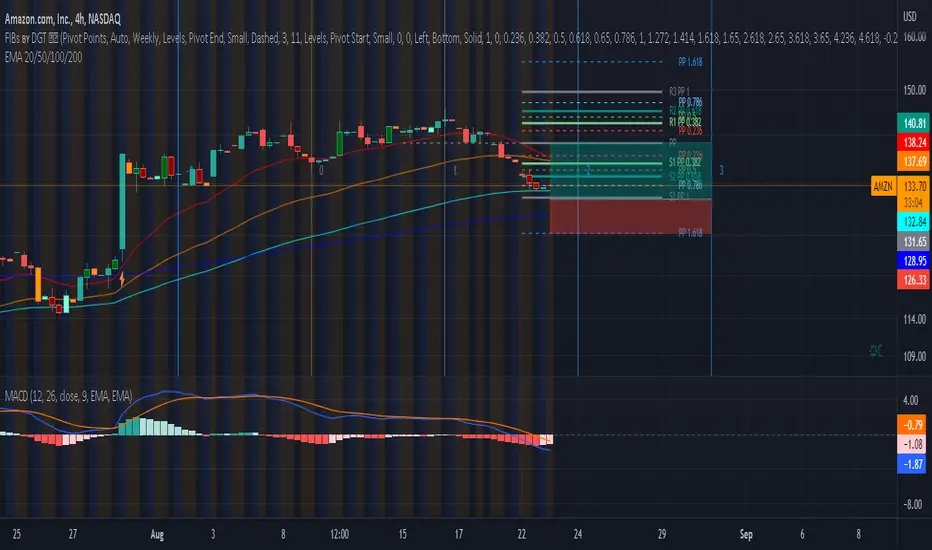
AMZN- Bullish PositionCurrently trading below 20 and 50-day EMA moving average investors can see that the underlying share price of amazon is undervalued. Valued at $133.35 AMZN is trading in line with its 100-day EMA average, it’s important to mention that there is still a strong possibility that the stock will fall even further in line with it’s 200-day EMA before bullish corrections occur. Regardless these technical signals indicate to investors that we should anticipate bullish momentum for this stock.
When looking more closely at the stock and its performance, Fibonacci retracement pivot points shows investors that it’s currently trading at a strong support level of 0.786; further supporting this undervalued and bullish notion. Investors should anticipate corrections towards its resistance level. Investors should also take due care to the strong possibility that the bearish sell trend might reach a stronger support level before bullish corrections occur.
Based on the above technical indication, we have set a buy price in line with the Fibonacci’s lower 1.00 support pivot. We have also set a sell price just above the 20-day EMA level. Based on Fibonacci, we have set a sell price in line with the central PP level, in between it’s resistance and support.
AMZN | Bearish still potentially continueAmazon is one of growth stocks with more than 20% growing sales per year. This growth sales likely will continue in future potentially with larger reached customers by Amazon. I do not have any significant complaint about the fundamental of Amazon, except for the high valuation of stock. According to the lowest P/E in the last 7 years, US$ 109 seems reflected the P/E. Probably that is the reason, AMZN rebounded around 101.87 lately.
But, technically, I still see bears pressure strong on the AMZN. And AMZN still has a high chance to breakdown 101.87 and going lower. Right now, AMZN moving sideways and has a high chance to test again near resistance around 125-129. Only if bulls can break the resistance, and maintain price above it, then we can expect AMZN will stop the dropping. Otherwise, AMZN is continuing going lower and making P/E lower and more attractive to investors.

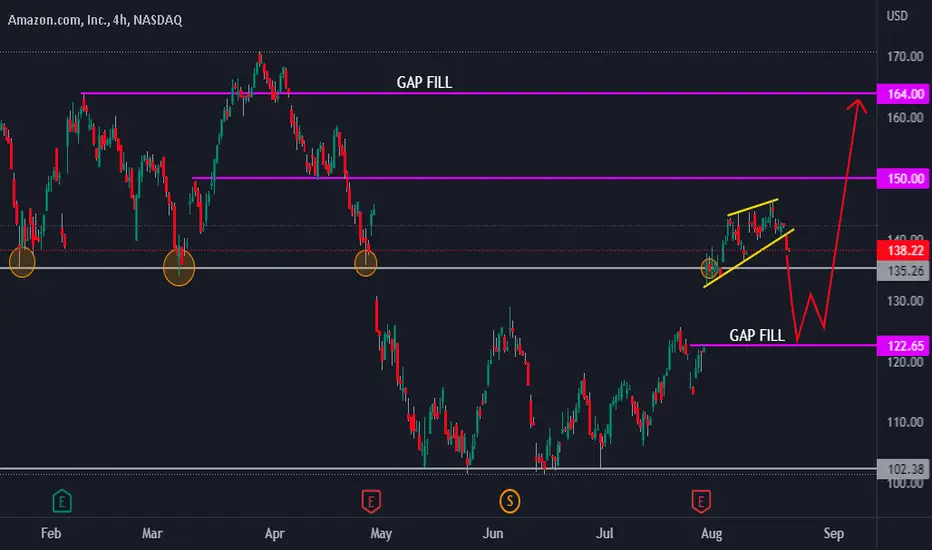
2X $AMZN 1D Tech. Analysis!AMAZON is coming out of a small rising wedge; we can see a retracement of the 20% push up, go fill the gap around the $123 area. Then there will probably be a bullish confirmation to continue the push up to fill the gap area around $164
AMZN on Critical support Entering buy area around 138.. Entry can be lowered since we are now sitting on major support, providing a better R:R ratio.This horizontal levels must hold the following days.. One could even think of selling a part at 144.5 and holding the rest to 150 area. Althought the market is looking quite weak, breakdown volumes havent been so high. please comment your thoughts.NFA

AMZN H4: 30% CORRECTION PT BEARS 90 USD SHORT IT(SL/TP)(STOCKS)Why get subbed to me on Tradingview?
-TOP author on TradingView
-15+ years experience in markets
-Professional chart break downs
-Supply/Demand Zones
-TD9 counts / combo review
-Key S/R levels
-No junk on my charts
-Frequent updates
-Covering FX/crypto/US stocks
-24/7 uptime so constant updates
AMZN H4: 30% CORRECTION PT BEARS 90 USD SHORT IT(SL/TP)(STOCKS)
IMPORTANT NOTE: speculative setup. do your own
due dill. use STOP LOSS. don't overleverage.
🔸 Summary and potential trade setup
::: AMZN H4 chart review and outlook
::: maxed out already
::: Currently DISTRIBUTION already completed
::: we broke down on heavy volume
::: this is NASTY looking chart
::: BAD for the BULLS / stay out
::: FED rate hikes incoming / FED PUT is GONE
::: short sell rips/rallies in the throwback move
::: expecting backtest of the recent Distribution Range
::: recommended strategy: SHORT IT / STAY OUT
::: up to 40% correction still possible from here
::: fair value for AMZN is 85/95 USD
::: DO NOT BUY/HOLD here this is NOT A DIP
::: This is stock market meltdown in progress
::: be careful / don't get ran over by the FED
🔸 Supply/Demand Zones
. N/A
RISK DISCLAIMER:
Trading Crypto, Futures , Forex, CFDs and Stocks involves a risk of loss.
Please consider carefully if such trading is appropriate for you.
Past performance is not indicative of future results.
Always limit your leverage and use tight stop loss.

Amazon Bear RetracementSign of Bearish trend continuation
-Candlesticks are moving below MA200
-Magnitude of Downtrend Line B is much stronger than of downtrend Line A, confirming strong bearish trend
-Candlestick fail to stay above MA200 after retracement R1
Strength of Retracement line R2 is stronger than of R1, signifying more uptrend momentum. However, candlesticks might have issues challenging hurdles of 0.618 fib retracement of Line B and MA 200.
Heavy selling might occur around the range of 151 to 164, where there is much higher trading volume. Holders that bought at this range or higher might choose to sell in order to breakeven or recoup losses.(Boxed)
If the expected long-term downtrend continues, Strong support might only be found at 88 to 95 range, where the highest volume have been traded for past 900 days since March 2020. (Boxed)

AMZN LONGLooking for support from EMA 200 1D and previous horizontal support @ 140. Stop Loss 1 ATR on the Daily. Target next horizontal support @ 150, R:R 2.2
