Gold will continue to grow inside upward channelHello traders, I want share with you my opinion about Gold. The market context for Gold has been firmly bullish since the price broke out of its prior consolidation range, a move that originated from the deep buyer zone. This breakout shifted the market structure, initiating a new impulsive phase that has since been neatly contained within a well-defined upward channel. The price action for XAU has been respecting the boundaries of this channel, creating a clear sequence of higher highs and higher lows. Currently, after being rejected from the channel's upper resistance line, the asset is undergoing a healthy correction movement. This pull-back is guiding the price back towards a significant confluence of support, where the ascending support line of the channel converges with the horizontal support zone near the 3485 current support level. The primary working hypothesis is a long scenario, based on the expectation that buyers will defend this area and maintain the integrity of the uptrend. A confirmed bounce from this dynamic support would signal the end of the correction and the resumption of the primary bullish trend. Therefore, the TP is logically placed at 3610 points, representing a new structural high and a measured objective for the next impulsive wave. Please share this idea with your friends and click Boost 🚀
Analysis

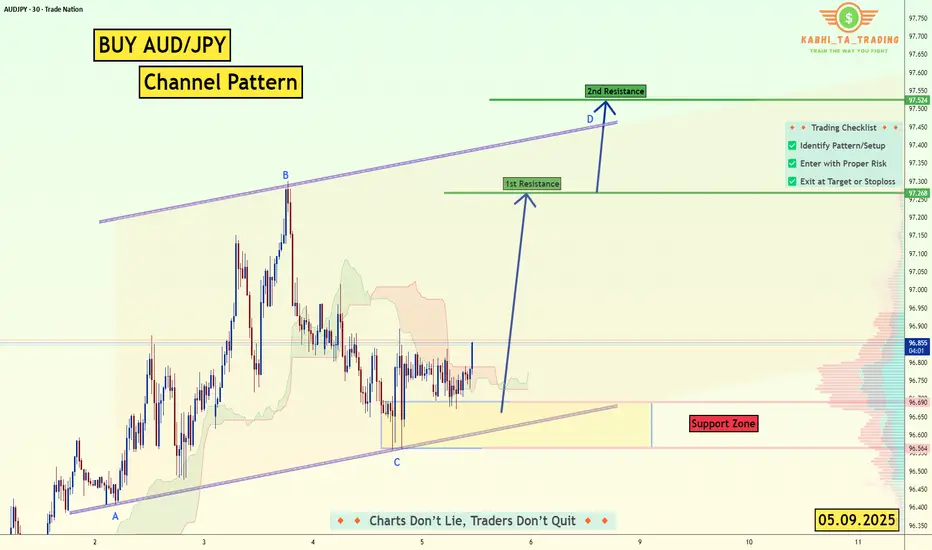
AUD/JPY - Channel Pattern (05.09.2025) The AUD/JPY pair on the M30 timeframe presents a Potential Buying Opportunity due to a recent Formation of a Channel Pattern. This suggests a shift in momentum towards the upside and a higher likelihood of further advances in the coming hours.
Possible Long Trade:
Entry: Consider Entering A Long Position around Trendline Of The Pattern.
Target Levels:
1st Resistance – 97.26
2nd Resistance – 97.52
🎁 Please hit the like button and
🎁 Leave a comment to support for My Post !
Your likes and comments are incredibly motivating and will encourage me to share more analysis with you.
Best Regards, KABHI_TA_TRADING
Thank you.
Disclosure: I am part of Trade Nation's Influencer program and receive a monthly fee for using their TradingView charts in my analysis.
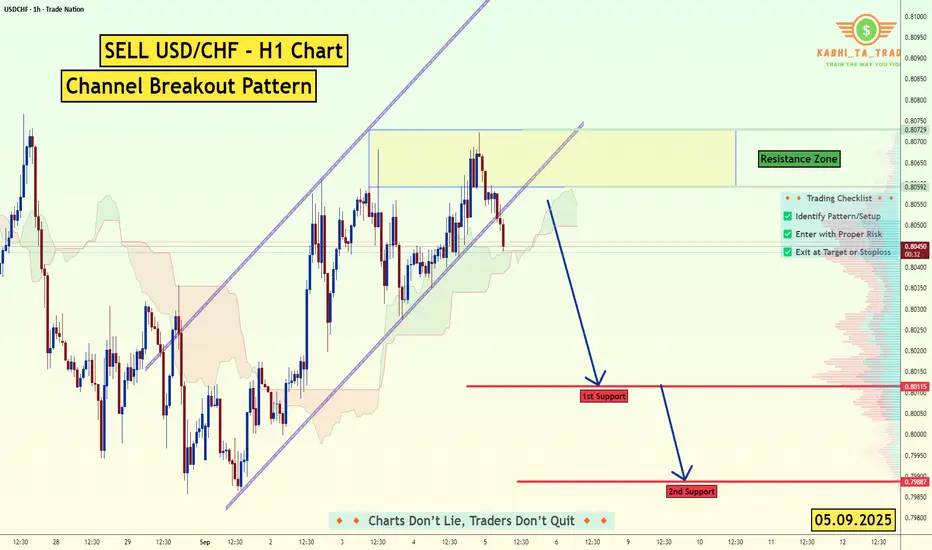
USD/CHF - H1 - Channel Breakout (NFP) (05.09.2025)The USD/CHF Pair on the H1 timeframe presents a Potential Selling Opportunity due to a recent Formation of a Channel Breakout Pattern. This suggests a shift in momentum towards the downside in the coming hours.
Possible Short Trade:
Entry: Consider Entering A Short Position around Trendline Of The Pattern.
Target Levels:
1st Support – 0.8011
2nd Support – 0.7988
🎁 Please hit the like button and
🎁 Leave a comment to support for My Post !
Your likes and comments are incredibly motivating and will encourage me to share more analysis with you.
Best Regards, KABHI_TA_TRADING
Thank you.
Disclosure: I am part of Trade Nation's Influencer program and receive a monthly fee for using their TradingView charts in my analysis.
Euro will rebound from seller zone and then start to fallHello traders, I want share with you my opinion about Euro. The price action for the Euro has been methodically developing within the confines of a large upward channel for several weeks, creating a clear structure of higher highs and higher lows. This pattern has been anchored by the major buyer zone near the 1.1580 support level and capped by a dynamic resistance line. The market has just completed a full upward rotation within this structure and is now at a critical inflection point. Currently, the price of EUR is directly testing the upper boundary of the channel, which forms a powerful confluence of resistance with the horizontal seller zone located at the 1.1720 - 1.1740 area. The primary working hypothesis is a short, rotational scenario, based on the expectation that sellers will successfully defend this significant resistance confluence. A confirmed rejection from this seller zone would validate the integrity of the upward channel and likely initiate a new corrective swing to the downside. This move would first need to break the current support Level at 1.1720. Therefore, the TP for this scenario is logically placed at 1.16150, a target that aligns perfectly with the ascending support line of the channel and represents the most probable objective for this bearish rotation. Please share this idea with your friends and click Boost 🚀

BTCUSD Short: Dump Of Supply ZoneHello, traders! The price auction for BTC has been operating within a large ascending channel, a structure defined by key pivot points that have established the 109500 demand area as support and the 113200 supply area as resistance. This bullish framework has guided the price through a series of higher highs and higher lows, confirming the buyer's initiative and the strength of the current uptrend.
Currently, the auction is at a critical inflection point at the top of this channel. The price has rallied to directly test the channel's ascending supply line, which forms a confluence of resistance with the horizontal 113200 - 113600 supply zone. This is a key area where sellers are expected to become active and challenge the prevailing bullish momentum.
The primary scenario anticipates a corrective move from these highs. The expectation is that sellers will defend the supply zone and reject the price, initiating a downward rotation back towards the channel's support line. A failure to break out higher would confirm a short-term correction is underway. The take-profit for this rotational play is therefore set at 110100 points, targeting a key liquidity area above the primary demand zone. Manage your risk!

USD/CAD - Bullish Pennant (04.09.2025)The USD/CAD pair on the M30 timeframe presents a Potential Buying Opportunity due to a recent Formation of a Bullish Pennant Breakout Pattern. This suggests a shift in momentum towards the upside and a higher likelihood of further advances in the coming hours.
Possible Long Trade:
Entry: Consider Entering A Long Position around Trendline Of The Pattern.
Target Levels:
1st Resistance – 1.3835
2nd Resistance – 1.3853
🎁 Please hit the like button and
🎁 Leave a comment to support for My Post !
Your likes and comments are incredibly motivating and will encourage me to share more analysis with you.
Best Regards, KABHI_TA_TRADING
Thank you.
Disclosure: I am part of Trade Nation's Influencer program and receive a monthly fee for using their TradingView charts in my analysis.

XAUUSD Long: Upward Trend ContinuesHello, traders! The prior market structure for XAUUSD was dominated by a large consolidation wedge pattern. This period of balance was resolved with a decisive bullish breakout, which was subsequently confirmed by a retest of the 3440 demand zone. This successful test of former resistance as new support confirmed a structural shift in control to the buyers and initiated the current bullish phase.
Currently, the price has entered an acceleration phase. Following the breakout, a strong, impulsive rally has developed, which is now being guided by a steep ascending trend line. This indicates that the bullish initiative is in full control and the market is in a clear expansion phase, having left the prior consolidation area behind.
The primary scenario anticipates a continuation of this bullish momentum. Any minor corrective pullback towards the ascending trend line is expected to be met with renewed buying pressure, providing an opportunity to join the trend. A successful hold of this dynamic support would be the trigger for the next leg higher. The take-profit for this trend continuation is therefore set at 3600 points. Manage your risk!

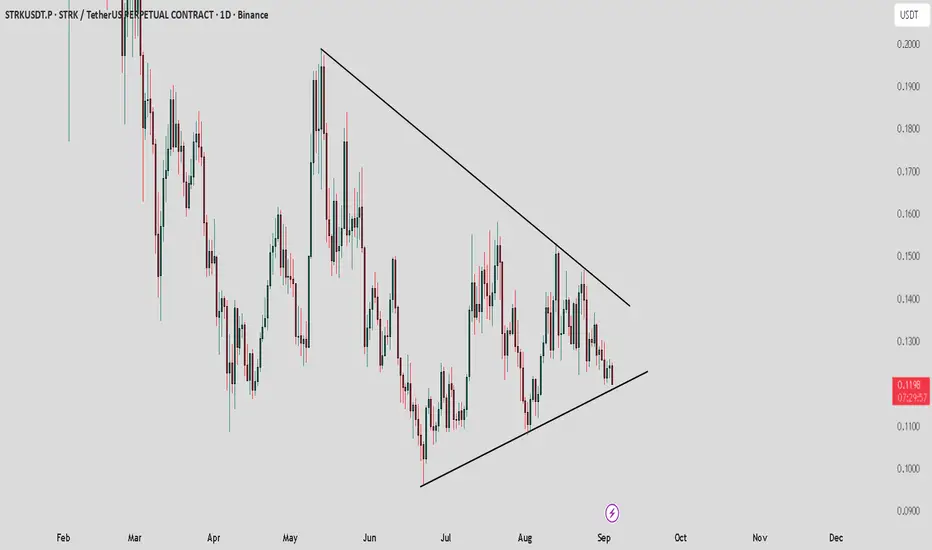
STRK / USDT : Near to support of symmetrical triangleSTRK/USDT is trading near the support of the symmetrical triangle.
Bullish scenario: If support holds, price could bounce toward the resistance at $0.13.
Bearish scenario: A breakdown from this support may drag price toward $0.096.
Always wait for confirmation before entering. Manage risk properly and trade according to market conditions.
Fundamental Market Analysis for September 04, 2025 GBPUSDOn Thursday, during the Asian trading session, the GBP/USD pair fell to around 1.3430. The pound sterling (GBP) is weakening against the US dollar (USD) amid concerns about the UK's financial situation.
UK Finance Minister Rachel Reeves said on Wednesday that she would present the annual budget on November 26, insisting that the economy is not “broken” and that she would control spending to help reduce inflation and borrowing costs. However, concerns about the UK's ability to control its finances are weighing on sentiment and dragging the pound down against the US dollar.
According to the US Bureau of Labor Statistics (BLS), the number of job openings on the last working day of July was 7.181 million. This figure followed 7.357 million (revised from 7.437 million) job openings recorded in June and was below the market consensus of 7.4 million.
The weakening of the UK labor market, announced on Wednesday, reinforced expectations that the Federal Reserve (Fed) will cut rates this month. This, in turn, could undermine the dollar and help limit losses for the major currency pair.
Trading recommendation: SELL 1.3400, SL 1.3450, TP 1.3300

BTCUSDi am looking for 1 sharpe retest and quick short on btcusd, as on major higher and high 3 major attempt on weekly time frame. simple draw line you may understand the reason as trend line has a huge gap beetween market that gap considerd to be filed up... if btc continued go high by end of this year. let me know your opinion in the comment. trade with confirmation only.

The world gold price increase shows signs of slowing downThe global gold price rally has shown signs of slowing as short-term futures traders booked profits after gold hit an all-time high and silver hit a 14-year high on Wednesday.
“We are seeing some profit-taking, but gold remains in an uptrend. Expectations of interest rate cuts and concerns about the independence of the US Federal Reserve (FED) will continue to boost safe-haven demand,” said Brian Lan, director of GoldSilver Central.
While gold has yet to hit that target, analysts said they are taking profits on concerns about upcoming news risks. The bank also noted that market volatility related to global trade issues has cooled, and long positions are showing signs of “condensing” again, which could limit the upside in the short term.

This week’s main event: Non-Farm Payrolls – Friday at 15:30!This Friday, September 5, 2025 at 15:30 EET , the U.S. Department of Labor will release one of the most anticipated macroeconomic reports — the Non-Farm Payrolls (NFP) . This release could confirm whether hopes for a near-term Fed policy shift are justified — the very hopes that helped U.S. equities climb to historic highs in late August. Markets see this report as a checkpoint for both the ongoing rally and rate expectations.
NFP and the markets: 3 possible scenarios
Strong report: If job creation exceeds expectations, unemployment falls, and wages accelerate — markets may believe the Fed will stay cautious on cutting rates. Typically, this boosts the dollar and bond yields, while growth stocks and tech underperform. More traditional sectors like banking, industry, and energy tend to hold up better. Gold and crypto often dip under pressure from a stronger USD and rising yields.
Weak report: If job gains disappoint, unemployment rises, and wage growth slows — this strengthens the case for a faster Fed pivot. In this case, the dollar usually softens, yields fall, and growth stocks, gold, and major crypto (BTC/ETH) gain on expectations of lower rates.
Neutral report: If numbers align closely with forecasts and there’s no big surprise, markets may remain range-bound. Initial reactions fade quickly, and focus shifts to the details — such as wage data and revisions to past reports. Price action often becomes choppy and short-lived until the next key catalyst.
The September 5 NFP release is a crossroads moment before the Fed’s September 16–17 meeting. Volatility is almost guaranteed, and the market’s reaction will depend on the combination of headline jobs number, unemployment rate, wage growth, and revisions. According to FreshForex , this setup offers tactical trade setups across forex, metals, and crypto pairs.

EURJPY: FakeoutEURJPY is currently undergoing an interesting transition. While the EMAs indicate that this pair is in an uptrend (where EMA20 is above EMA60), there's early indication that we might be seeing a downtrend soon.
Daily Timeframe:
Price attempted to cross above the daily level, but it failed to close above it. It's also a lower high after a strong run-up, which indicates to me that the upside momentum might be exhausting.
H1 Timeframe:
We see an intraday double top formation, which indicates that price is having a hard time pushing higher. Price also crossed below the intraday neckline.
While it tried to pull back above the intraday neckline, it quickly reverted below, indicating quite a bit of selling pressure.

#ARBITRUM #ARBUSDT #LONG #Eddy#ARBITRUM #ARBUSDT #LONG #Eddy
ARBUSDT.P SWING Long Setup
Important areas of the upper time frame for swing are identified and named.
This setup is based on a combination of different styles, including the volume style with the ict style.
Based on your strategy and style, get the necessary confirmations for this Swing Setup to enter the trade.
Don't forget risk and capital management.
The entry point, take profit point, and stop loss point are indicated on the chart along with their amounts.
The responsibility for the transaction is yours and I have no responsibility for not observing your risk and capital management.
By scratching the price and time bar, you can see the big picture of targets.
Buy Position "LONG" Spot & Future Details :
Entry : 0.4900
Stop : 0.4665 (( 4.80% )) "You can enter with a small stop by getting approval."
Target 1 : 0.5145 "5%"
Target 2 : 0.5390 "10%"
Target 3 : 0.5635 "15%"
Target 4 : 0.5880 "20%"
Target 5 : 0.6125 "25%"
Target 6 : 0.6370 "30%"
Be successful and profitable.

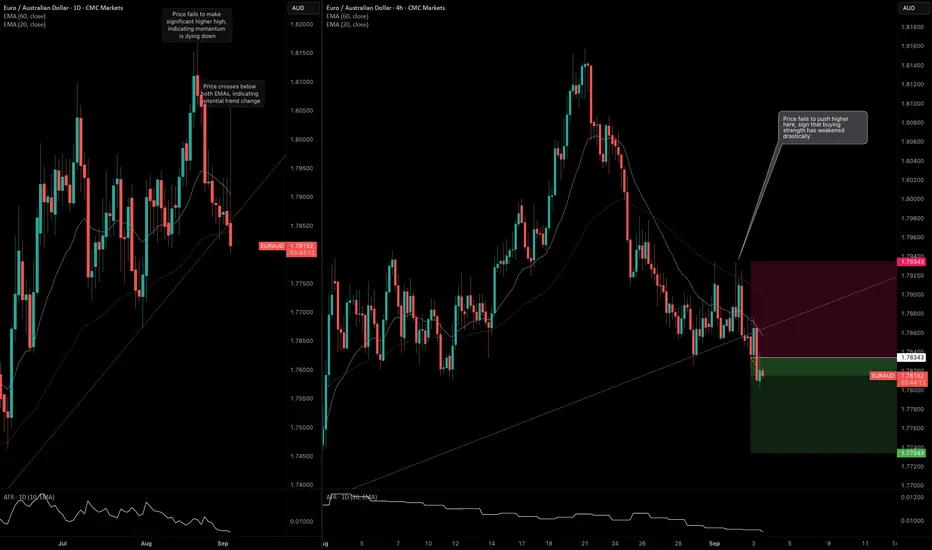
EURAUD: Ascending Trendline BreakThis is a counter-trend trade as I see exhaustion on the daily timeframe.
Daily Timeframe:
I plotted an ascending trendline on the daily timeframe. Price attempted to push to a new high on August 20th, but failed to hold. That was the first indication that the uptrend might be over.
The signal occurred when price crossed below the ascending trendline. Currently, the daily bar is active. If the current bar manages to close below the ascending trendline and tomorrow's daily bar does the same, it's safe to say that we can expect further downside.
H4 Timeframe
The bearish signal is also supported on the 4-hour timeframe. In the intraday timeframe, price made a "double top" indicating that it's not able to push higher to the upside. I'm anticipating that momentum will build up throughout the rest of the day and into tomorrow as well.
Fundamental Market Analysis for September 03, 2025 EURUSDThe euro remains under pressure as demand for the US dollar as a “safe haven” rises amid higher long-end Treasury yields and a broader risk-off tone. Today during Asian trading, the pair fluctuates around 1.16300–1.16500. Dollar inflows are supported by concerns over fiscal sustainability in advanced economies and a steeper US yield curve, which dampen risk appetite and reduce demand for the euro.
From a fundamental standpoint the setup is mixed: markets still price a chance of a Fed rate cut in September, yet the actual backdrop—firmer long-dated yields and cautious commentary on the US cycle—keeps the dollar supported. In the euro area, attention stays on inflation and signs of cooling domestic demand: soft PMI components and CPI expectations limit upside for the euro, while the differential in real rates continues to favor the USD.
Near-term drivers include the incoming US macro flow on employment (including advance gauges and Friday’s labor data) as well as fresh inflation pointers from the eurozone. Against this backdrop, the fundamental balance still tilts in favor of the dollar, keeping downside break risks elevated for EURUSD in case US releases surprise to the upside.
Trading recommendation: SELL 1.16300, SL 1.16800, TP 1.15800

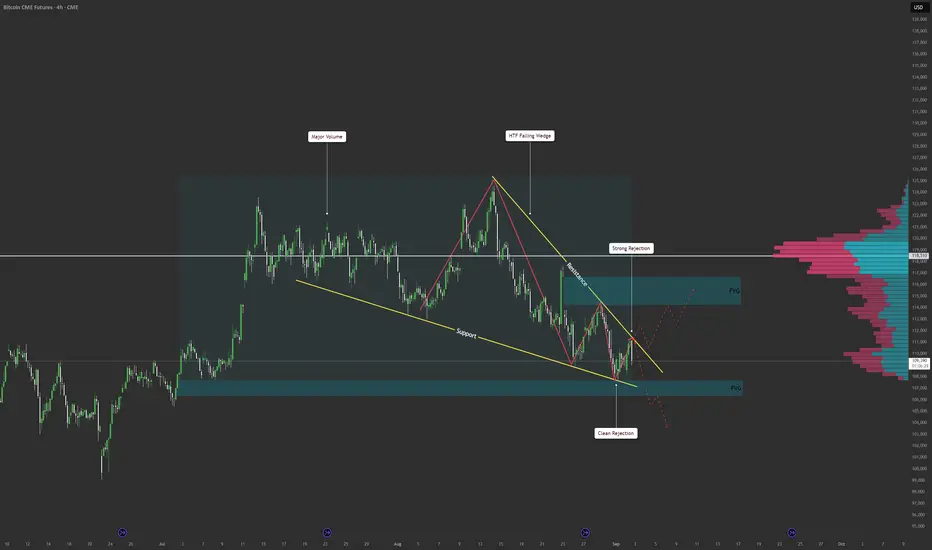
BTC Futures – Falling Wedge Break Incoming? | 4H AnalysisBitcoin CME Futures is currently trading inside a falling wedge on the 4H timeframe.
We’re sitting at a key decision point, with liquidity both above and below.
Volume profile shows strong resistance, with a large high-volume node.
Support has held, with a clean rejection and demand showing up.
Fair Value Gaps (FVGs) are left above and below acting as magnet zones.
This setup leaves us with two clear scenarios:
Bullish Scenario 🟢
Breakout above wedge resistance
Reclaim 110K as support
Target 112K–118K FVG for liquidity fill
If momentum holds, possible test of 120K resistance zone
Bearish Scenario 🔴
Failure to break wedge resistance
Breakdown under 107K support
Target 97K–100K FVG as downside liquidity
Deeper rejection could extend to mid-90K levels
⚠️ No trade bias until price confirms direction. Waiting for a break + retest is key here.
Bitcoin will continue to decline inside downward channelHello traders, I want share with you my opinion about Bitcoin. The dominant market structure for Bitcoin remains bearish, with the price action being clearly contained within a well-defined downward channel since the major rejection from the 116800 Resistance Level. This structure has been guiding the asset lower through a series of impulsive declines and corrective rebounds, confirming that sellers are in control of the trend. The most significant recent development was the breakdown below the key horizontal support around the 109000 level. Currently, after this breakdown, the price of BTC is in a corrective phase, rallying back to retest this broken structure from below, which now acts as the current resistance level. This 109000 - 109800 resistance zone is a critical inflection point. The primary working hypothesis is a short scenario, predicated on the failure of this retest. A confirmed rejection from this former support area would validate the continuation of the bearish momentum and signal that the next impulsive downward fall is imminent. Therefore, the TP for this trend continuation play is logically placed at 104000 points. This target represents a new lower low within the channel and is the next major area of structural interest for the price. Please share this idea with your friends and click Boost 🚀

ENA / USDT : Keep a close watch on breakoutENA/USDT is currently testing trendline resistance and attempting a breakout.
Bullish scenario: A successful breakout with confirmation could push price toward $0.80 – $0.85.
Bearish scenario: Failure to breakout will invalidate this setup.
Always manage risk and avoid entering without clear confirmation.

USD/CHF - Wedge Breakout (02.09.2025)The USD/CHF pair on the M30 timeframe presents a Potential Buying Opportunity due to a recent Formation of a Wedge Breakout Pattern. This suggests a shift in momentum towards the upside and a higher likelihood of further advances in the coming hours.
Possible Long Trade:
Entry: Consider Entering A Long Position around Trendline Of The Pattern.
Target Levels:
1st Resistance – 0.8048
2nd Resistance – 0.8067
🎁 Please hit the like button and
🎁 Leave a comment to support for My Post !
Your likes and comments are incredibly motivating and will encourage me to share more analysis with you.
Best Regards, KABHI_TA_TRADING
Thank you.
Disclosure: I am part of Trade Nation's Influencer program and receive a monthly fee for using their TradingView charts in my analysis.

SXT / USDT : Breaking out from Trendline resistanceSXT/USDT is breaking out of its trendline resistance with strong potential. If this breakout sustains with clear confirmation, price could rally toward the $0.09 – $0.10 zone soon.
Best approach: Wait for clear bullish confirmation before entering. Manage risk wisely and trade according to market conditions.

Fundamental Market Analysis for September 02, 2025 USDJPYA fundamental weakening of the dollar is observed in the USD/JPY pair against the backdrop of expectations of a Fed rate cut this autumn. Investors in the US remain cautious, awaiting the release of fresh labor market data, while risky assets in the Asian region are pushing the dollar down.
The Japanese economy is showing positive dynamics - capital expenditures are growing, and expectations of a rate hike by the Bank of Japan are supporting the strengthening of the yen. At the same time, a slowdown in manufacturing activity is only partially holding back the growth of the national currency. The prevailing opinion is that the Bank of Japan may begin a cycle of monetary policy tightening before the end of the year, which increases the potential for the yen's growth against the dollar.
External markets are also under pressure from unclear inflation prospects and a further decline in optimism about the US dollar. The conditions are in favor of a continued downward correction for the USD/JPY pair with the aim of updating support at the 146.150 level.
Trading recommendation: SELL 147.500, SL 147.700, TP 146.500

DXY – Big Week Ahead, Watch These Zones-Dollar still stuck in a range. No need to guess, just watch the heavy levels:
-96.66 = bullish liquidity zone
-99.80 = bearish liquidity zone
-This week is packed with heavy news:
-NFP Friday – jobs report could shake markets hard
-Fed credibility under fire – politics trying to pressure the central bank
-Be careful with dollar pairs — market makers love stop hunts around news.
Best to stay patient → let price show which zone breaks first.
