Euro may exit from wedge and then drop to support levelHello traders, I want share with you my opinion about Euro. After a strong impulse to the upside and a retest of the 1.1265 resistance area, the Euro started to consolidate inside a downward wedge. Despite repeated attempts to hold above the 1.1265 - 1.1300 zone, price action gradually shifted lower, creating lower highs within the wedge formation. This pattern often signals continuation or deeper correction, especially when formed after a large bullish move. The recent breakout below both the support area and the lower wedge boundary confirms that bearish pressure is taking control. The rejection from the seller zone and the sharp decline reinforce this shift in sentiment. Now the price is trading near the support line of the wedge and showing weak attempts to recover, forming a potential retest of the broken structure. Given the break of support, I expect the Euro may continue its decline toward the 1.0925 level, which coincides with both the buyer zone and a well-defined support level, thereby exiting from wedge pattern. This zone serves as my current TP 1. Please share this idea with your friends and click Boost 🚀
Analysis

GOLD Weekly Open Analysis:Gap Down Sparks Fresh Bearish Momentum🟠 GOLD (XAU/USD) – Weekly Open Analysis: Gap Down Sparks Fresh Bearish Momentum
Gold opens the week with a sharp gap-down, reflecting a cooling of global tensions and softer tones in tariff negotiations over the weekend. With both geopolitical risks and trade conflicts showing signs of de-escalation, investors quickly shifted away from safe-haven demand, leading to immediate downside pressure in early Asia hours.
🔍 Market Context:
The price action remains within a bearish parallel channel on the M30 timeframe.
A visible GAP ZONE has formed between $3326 – $3328, which now acts as a key resistance area to watch for a potential retest.
This week brings critical US economic data including CPI, PPI, and a Fed speech, all of which could drive large volatility.
The market is likely to remain extremely sensitive to any shifts in:
US inflation expectations
FED forward guidance
Further headlines on tariffs or geopolitical escalations (Russia–Ukraine, India–Pakistan)
🔧 Trading Strategy for Today (13/05/2025):
Bias: Short-term bearish unless clear reversal signs appear.
Primary focus: Sell the rally, especially near key resistance zones.
🔺 Key Resistance Levels:
$3288
$3308
$3326–$3328 (Gap Fill Zone)
🔻 Key Support Levels:
$3262
$3246
$3236
$3200
🎯 Trade Ideas:
🔵 BUY ZONE:
Entry: $3246 – $3244
SL: $3240
TPs: $3250 → $3254 → $3258 → $3262 → $3266 → $3270 → $3280
Valid only if buyers show strong defense at key support zones.
🔴 SELL ZONE (Main):
Entry: $3326 – $3328
SL: $3332
TPs: $3322 → $3318 → $3314 → $3310 → $3305 → $3300
🔴 SELL SCALP (Early Intraday):
Entry: $3306 – $3308
SL: $3312
TPs: $3300 → $3296 → $3290 → $3286 → $3282 → $3278 → $3270
⚠️ Key Reminders:
Volatility is expected to remain high throughout the week due to macro events and shifting risk sentiment.
Trade with discipline — stick to your TP/SL and avoid emotional entries.
Wait for confirmation at your planned levels. Let the market come to you.
📣 Final Note:
This week is packed with catalysts. Patience and precision will define successful trades. Follow this account for real-time updates as the market reacts to US CPI and Fed commentary.

Fundamental Market Analysis for May 12, 2025 EURUSDEUR/USD is retreating from the gains made in the previous session, trading near 1.12400 in Monday's Asian session. The Euro (EUR) has been under pressure since European Central Bank (ECB) official Olli Rehn said last week that the ECB may consider cutting interest rates at its next meeting, provided that upcoming forecasts confirm a continued trend of disinflation and slowing economic growth.
Despite this, EUR/USD found some support thanks to optimism surrounding the trade talks between the US and China that took place in Geneva. Both sides reported “substantial progress” after two days of talks aimed at de-escalating the ongoing trade dispute. Chinese Vice Premier He Lifeng called the talks an “important first step” in stabilizing bilateral relations, while U.S. Treasury Secretary Scott Bessent echoed his sentiment, noting significant progress.
Markets are now awaiting Washington's response to the European Commission's proposed countermeasures against U.S. tariffs. On Thursday, the Commission launched a public consultation that outlined potential tariffs on up to 95 billion euros worth of imports from the U.S. if trade talks break down.
Meanwhile, the U.S. economic outlook remains uncertain. Federal Reserve (Fed) officials have noted the risk of stagflation, and Fed Chairman Michael Barr has warned that higher tariffs could disrupt supply chains, leading to higher inflation, lower growth and higher unemployment. Investors remain cautious as further escalation of trade tensions could pose serious problems for the US economy.
Trading recommendation: BUY 1.12300, SL 1.11900, TP 1.13000

Gold will continue to grow and exit from pennantHello traders, I want share with you my opinion about Gold. After looking at this chart, we can see how the price of Gold has been developing inside an upward pennant, formed after a powerful impulse from the buyer zone. This earlier move created a strong bullish foundation, supported by consistent reactions from the support area, which has since become a key defensive level. After the breakout from the upper boundary of the previous ascending channel, the price entered a phase of consolidation. However, rather than fading, the price action has remained tightly squeezed between the support line and the resistance trendline, creating the structure of a classic pennant. This pattern usually signals continuation, especially when supported by strong preceding momentum, which is exactly what we’re seeing here. Currently, the price is hovering around the support line of the pennant and has already shown signs of bouncing back up. If this rebound continues, the next logical move is a breakout through the resistance line of the pennant, with the 3450 level as a target. It aligns perfectly with the upper boundary and represents a strong technical TP1. Please share this idea with your friends and click Boost 🚀

EGX30 Downward Trend AnalysisEGX30 stock started to fell reaching the 31,661.82 support line, showing the sellers' dominance over the buyers. This is a result of investors' waiting for the outcome of U.S.-China trade talks on the weekend. In addition, blue-chip developer Emaar Properties reported Q1 net profit of 3.71 billion dirhams that missed the analysts' estimate of 4 billion dirhams.

Gold Friday Volatility – Liquidity SweepsGold Friday Volatility – Liquidity Sweeps & Potential Channel Break Ahead
Gold kicked off Friday with intense volatility, triggering sweeping liquidity grabs during the Asian session. Price dropped aggressively into the 327x region, clearing stop zones and vacuuming liquidity — only to quickly rebound and fill the imbalance above.
This classic FVG (Fair Value Gap) behavior was especially visible on the M30 timeframe, as price repeatedly left behind inefficient zones and promptly returned to fill them. Volatility remains elevated — and traders should proceed with caution.
📉 Technical Context – End of the Downtrend?
Since Thursday, gold has been trading in a clean descending parallel channel, respecting lower highs and pushing downward. However, late in the Asian session today, a bullish momentum surge appears to be testing the upper boundary of this channel.
We are now watching the 3324 level very closely.
A confirmed breakout above this zone — with candle closure outside the trendline — would suggest a structure shift and open the door for BUY setups on the retest.
Until then, we observe. Let price confirm. We trade the reaction, not the assumption.
🌍 Macro Risk – Trade Tensions & Weekend Volatility
The market remains extremely reactive to:
Geopolitical risks: Military tensions are still simmering.
US–China tariff discussions: President Trump is expected to make remarks on tariff policy.
Any surprise here could heavily impact USD and gold.
⚠️ Liquidity sweeps are common on Fridays — especially into London and NY sessions — so risk management is critical today.
📌 Key Technical Levels to Watch
🔺 Resistance:
3345 → 3364 → 3395
🔻 Support:
3280 → 3270 → 3256 → 3244 → 3225
The 3324 and 3366 zones are particularly critical.
If price closes firmly above these zones, bullish continuation becomes more likely.
If price gets rejected, we stay within range and look for sell opportunities.
🎯 Trade Plan – Friday, May 10
🟢 BUY ZONE
Entry: 3280 – 3278
SL: 3274
TPs: 3285 → 3290 → 3295 → 3300 → 3305 → 3310 → 3320
🔴 SELL ZONE
Entry: 3364 – 3366
SL: 3370
TPs: 3360 → 3356 → 3352 → 3348 → 3344 → 3340 → 3330
🧠 Final Thoughts:
Friday often delivers unexpected liquidity traps.
With news expected from the White House and technical structure on the verge of a break, this session could offer both risk and reward — if approached with discipline.
✅ Use clear levels.
✅ Respect TP/SL.
✅ Stay sharp as NY volume enters.
📣 Let’s end the week strong. Drop your charts and ideas below!

#ETH Breakout is incoming!$ETH/USDT – Breakout Watch
Ethereum is currently retesting a key descending resistance line after an extended period of consolidation. The structure suggests growing bullish momentum.
🟢 A successful breakout and daily close above the $1,900–$2,000 zone could trigger a move toward $2,200–$2,400 in the coming sessions.
Watch for confirmation with volume expansion and retest behavior. Rejection at this level could delay the move, but the pressure is clearly building.
Key Levels:
Resistance: $1,900–$2,000
Target: $2,200–$2,400
Support: $1,800
Chart looks clean breakout potential is real.
DYOR NAF
BINANCE:ETHUSDT BITSTAMP:ETHUSD

Fundamental Market Analysis for May 9, 2025 USDJPYUSDJPY:
The Japanese yen (JPY) rises against its US counterpart during the Asian session on Thursday and reverses part of the previous day's correction from a one-week high. Minutes from the Bank of Japan's (BoJ) March meeting showed that the central bank remains open to further tightening if the economic and price outlook persists. This, along with a rebound in safe-haven demand, is lending support to the Japanese Yen, which, along with the emergence of fresh US Dollar (USD) selling, is keeping the USD/JPY pair below the 144.00 round figure.
Optimism over the start of trade talks between the US and China, which will take place this week in Switzerland, is fading rather quickly amid uncertainty over how a new deal between the world's two largest economies might be structured. In addition, US President Donald Trump has denied that he will reduce tariffs against China, dampening hopes of a speedy resolution to the trade war between the world's two largest economies. In addition, persistent geopolitical risks kept investors on edge and proved to be the key factor that influenced the yen's growth amid the general weakening of the dollar.
Trading recommendation: SELL 145.80, SL 146.00, TP 144.90

Euro may correct to support area and then start to move upHello traders, I want share with you my opinion about Euro. Looking at this chart, we can see how price has been confidently trending within an upward channel, supported by strong impulses and consistent demand from the lower boundary. The price initially rebounded from the buyer zone, which later became the launchpad for a major upward move. After breaking the resistance line of the channel, the Euro made a clean breakout and confirmed its strength with a retest from above, a clear sign of bullish continuation. This upward momentum carried price directly into the support area, which has since served as a key zone for consolidations. The market then shifted into a horizontal range, trading within well-defined boundaries, with repeated rejections near the top and steady rebounds from the bottom support. What’s crucial now is that the Euro is again testing the lower border of this range while holding above the current support level at 1.1270. Given this structure, a strong preceding trend, clean reaction at the bottom of the range, and ongoing consolidation without deeper breakdowns, I expect the price to rebound from this zone and continue higher. My TP1 is set at 1.1575, the upper boundary of the current range, which remains a logical magnet for price in the short term. Please share this idea with your friends and click Boost 🚀

btc . tue . recapApproaching the cmLow during 2/4pm (utc+2) on tuesday, brought the tiny SFP liquidity and and a NO LOOK BACK push upwards. The SHORT wasn't taken as the the bounce showed no weakness
The intraday LONG turned out to be a runner.
entry . 93454
tp1 . 94854 . +1.5%
- this seems a 'too early tp', correct but: thought as an intraday . securing the daily minimum: PROFIT TAKEN
tp2 . 100477 . +7.5%
tp3 . 103626 . +10.8%
The long entry is now at average 94863 . ish prv tp1
- I was waiting for lower, to add LONG position size
But upon not seeing follow through and strong bounces on lower TFs, I went with a 30% of original trade size addition during wednesday 8/10pm.
Now it's 10:30am, we've just pushed another 1h leg higher. I'll ride this to my next TPs, bigger reactions at this point I see only at higher prices.
This thing is BULLISH
(always hungry for good SHORT trades, but paytient for reactions)

XAU/USD 08 May 2025 Intraday AnalysisH4 Analysis:
-> Swing: Bullish.
-> Internal: Bullish.
Analysis and bias remains the same as analysis dated 23 April 2025
Price has now printed a bearish CHoCH according to my analysis yesterday.
Price is now trading within an established internal range.
Intraday Expectation:
Price to trade down to either discount of internal 50% EQ, or H4 demand zone before targeting weak internal high priced at 3,500.200.
Note:
With the Federal Reserve's dovish stance and persisting geopolitical uncertainties, heightened volatility in Gold is expected to continue. Traders should proceed with caution and adjust risk management strategies in this high-volatility environment.
Price could also be driven by President Trump's policies, geopolitical moves and economic decisions which are sparking uncertainty.
H4 Chart:
M15 Analysis:
-> Swing: Bullish.
-> Internal: Bullish.
analysis and bias remains remains the same as yesterday's analysis dated 07 May 2025.
As mentioned in yesterday's analysis that I would continue to monitor price and depth of bearish pullback following previous bullish iBOS.
Price did not pull back with any significance, therefore, I will apply discretion and not mark the previous iBOS. I have however marked this in red.
Price continued bullish and subsequently printed a bearish iBOS to indicate, but not confirm bearish pullback phase initiation.
Price is now trading within an established internal range, however, I will continue to monitor depth of pullback.
Intraday Expectation:
Price to trade down to either discount of internal 50% EQ, or M15 supply zones before targeting weak internal high priced at 3,435.055
Note:
With the Federal Reserve maintaining a dovish stance and ongoing geopolitical tensions, volatility in Gold prices is expected to remain elevated. Traders should exercise caution, adjust risk management strategies, and stay prepared for potential price whipsaws in this high-volatility environment.
Trump's tariff announcement will most likely cause considerably increased volatility and whipsaws.
M15 Chart:

Nifty preparing itself for Big Momentum Today 8may 2025 Nifty traded in just tiny range even on expiry Day. so, what will be next Move?
it is ready for bearish momentum ?
First reason: I have noticed multiple weakness through Wick which is representing by arow on chart.
Second reason: whenever market traded in narrow range (around 8-10 hourly candle) in past few days it gave breakdown represented drawing 4 yellow area see on chart.

XAU/USD - Fed warns of Economic UncertaintyThe XAU/USD pair on the M30 timeframe presents a Potential Buying Opportunity due to a recent Formation of a Bullish Flag Pattern. This suggests a shift in momentum towards the upside and a higher likelihood of further advances in the coming hours.
Possible Long Trade:
Entry: Consider Entering A Long Position around Trendline Of The Pattern.
Target Levels:
1st Resistance – 3473
2nd Resistance – 3519
🎁 Please hit the like button and
🎁 Leave a comment to support for My Post !
Your likes and comments are incredibly motivating and will encourage me to share more analysis with you.
Best Regards, KABHI_TA_TRADING
Thank you.

Fundamental Market Analysis for May 8, 2025 GBPUSDEvents to pay attention today:
15:30 EET. USD - Number of Initial Jobless Claims
14:00 EET. USD - Bank of England Key Interest Rate Decision
GBPUSD:
GBP/USD was down six-tenths of a per cent on Wednesday as markets continued to hold on to the safe-haven US dollar. The Federal Reserve (Fed) left rates unchanged as markets had expected, but Fed policymakers, still adopting a wait-and-see stance, curbed risk appetite during the midweek market session. The Bank of England (BoE) will hold its own rate meeting on Thursday and is expected to cut rates by another quarter point.
Forex Today: All eyes on the Bank of England
Market sentiment declined after Fed Chairman Jerome Powell's press conference. He said that US trade tariffs could hamper the Fed's inflation and employment targets this year. Powell warned that continued policy instability could force the Fed to take a ‘wait-and-see’ approach to interest rates. While the Trump administration's tariffs have weighed heavily on consumer and business sentiment, the lack of significant negative economic data makes it difficult for the Fed to justify an immediate change in interest rates.
Powell: The right thing to do is to wait for further clarity
The Bank of England is expected to cut the rate by a further quarter point at its upcoming meeting on Thursday, marking the fourth rate cut since it peaked in 2023. The Bank of England's Monetary Policy Committee (MPC) is expected to vote nine to one in favour of another rate cut in an attempt to support the faltering UK economy.
Trading recommendation: SELL 1.3330, SL 1.3350, TP 1.3230

$RATS Heating Up — 100% Move on the Table?$RATS – Pressure Building, Breakout Imminent
$RATS is quietly loading up for a massive breakout. Price has been grinding higher with strong demand stepping in at every dip — support structure is holding beautifully.
🧠 Key Observations:
Clean ascending structure
Consistent higher lows
Testing a major resistance zone
Volume creeping up = Accumulation signs
📈 Breakout Potential:
Once $RATS clears this resistance zone, the chart opens up for a sharp move — a 100%+ pump is well within reach based on the current range.
📌 What I’m watching for:
Break & close above resistance
Volume confirmation on breakout
Retest = entry zone for momentum chasers
The structure’s solid, the risk is tight, and the upside is explosive. Eyes on $RATS — the move could be BIG.Image

XAUUSDStrong trend movement up, then range. This movement is considered another rise for me as an analysis of 3469, 3506, but any political news, especially from a press conference, is unexpected and the analysis may end up falling. Today we have important news, which is the US interest rate decision and a press conference.

Euro will exit from pennant and grow to resistance levelHello traders, I want share with you my opinion about Euro. Looking at this chart, we can see how the price, after a strong upward impulse, the price entered into a consolidation phase, forming a classic upward pennant pattern. Throughout this structure, the price repeatedly respected both the support line and resistance line, tightening inside the pennant while still holding above the support level at 1.1300. This zone, between 1.1280 and 1.1300, marked as the buyer zone, has acted as a strong floor multiple times. Every touch to this area sparked bullish reactions, and most recently, we can see the rice once again starting to grow after dipping into this zone. On the upper side, the resistance level at 1.1430 coincides with the breakout target of the pennant, and also lies just below the seller zone, making it a logical TP 1 area for bulls. The current price action suggests that after a minor pull-back, the price may test the lower pennant edge and then rebound, potentially initiating an impulsive breakout toward 1.1430. Given this structure and the strong base forming around 1.1300, I expect Euro will grow upward toward my TP 1 at the 1.1430 level, thereby exiting from the pennant. Please share this idea with your friends and click Boost 🚀

Gold Ahead of FOMC – China Rate Cut Shocks Market as USD Surges⚠️ Gold Ahead of FOMC – China Rate Cut Shocks Market as USD Surges
Gold (XAU/USD) is facing a pivotal moment after a dramatic correction from $3,435 down to the 3,360s, triggered by a combination of surprising policy moves and rising macro uncertainty.
🧭 Macro Recap: Why Did Gold Drop?
🇨🇳 China unexpectedly cut interest rates by 10 basis points ahead of a key trade dialogue with the US.
➤ This supports global liquidity sentiment but simultaneously strengthens the USD in the short term.
💵 DXY surged, taking advantage of China's rate cut — adding pressure to gold.
⚠️ Geopolitical tensions in South Asia (India–Pakistan) resurfaced but failed to lift gold.
➤ This hints that the current correction is more dollar-driven than risk-off in nature.
🏛️ All eyes now shift to FOMC later today, where Fed policy will dictate gold’s next major move.
Will Powell surprise markets with dovish signals, or does this China cut hint at coordinated central bank play before a wider easing cycle?
📊 Technical Outlook – Gold in Volatile Expansion
Despite the macro volatility, gold continues to respect key liquidity zones and high-volume clusters on the chart. However, momentum is broad and inconsistent — requiring traders to react to confirmed breaks, not early assumptions.
🔺 Resistance Levels:
3390 → 3402 → 3416 → 3425 → 3432 → 3444 → 3468
🔻 Support Levels:
3365 → 3356 → 3332 → 3314
🎯 Trade Strategy – 7 May 2025 (FOMC Day)
🟢 BUY SCALP
Entry: 3355
SL: 3350
TPs: 3360 → 3364 → 3368 → 3372 → 3376 → 3380
🟢 BUY ZONE (Mid-Term Opportunity)
Entry: 3332 – 3330
SL: 3326
TPs: 3336 → 3340 → 3344 → 3348 → 3352 → 3358 → 3365
⚠️ Key BUY Level: 3314 – 3312
This is a critical level for bulls — aligned with 0.5 FIBO retracement and previous demand flip zone. However, a move here could invalidate structure and signal deeper bearish pressure. Use caution.
🔴 SELL SCALP
Entry: 3430 – 3432
SL: 3436
TPs: 3425 → 3420 → 3415 → 3410 → 3400
🔴 SELL ZONE (High-Risk Short)
Entry: 3468 – 3470
SL: 3474
TPs: 3464 → 3460 → 3455 → 3450 → 3445 → 3440 → 3430
🧠 Final Thoughts:
Gold remains range-bound but extremely reactive to macro news.
Today’s FOMC meeting could be a game changer. Whether the Fed maintains its current stance or signals dovish pivot will determine the direction for the rest of the week.
🎯 In times like this, it’s not about picking tops or bottoms — it’s about trading the reaction and protecting your capital.
✅ Stick to SL.
✅ Let price confirm.
✅ Be prepared for high volatility spikes.
Good luck, traders — and stay sharp.

Fundamental Market Analysis for May 7, 2025 EURUSDEURUSD:
EUR/USD failed to hold on Tuesday, marking a new short-term consolidation range near the key 1.1300 mark as traders wait for a reason to move. The key event this week is the Federal Reserve (Fed) rate announcement in the middle of the week, which has pinned investor sentiment to the pole for now.
The Fed's upcoming rate decision on Wednesday remains the focus of markets this week. While many expect the Fed to maintain current rates, investors will be closely monitoring comments from policymakers, especially Fed Chairman Jerome Powell, for any signs that the shift to a rate-cutting cycle may occur sooner than expected.
Recently, the Fed has been facing increasing pressure to lower interest rates. Market participants have consistently sought lower funding costs, and the Trump administration has been particularly vocal in insisting that the Fed must cut rates to ease the cost of servicing US debt. However, this stance runs counter to the Fed's dual mandate of promoting full employment and controlling price stability, which President Donald Trump does not appear to be taking into account.
Trading recommendation: BUY 1.1350, SL 1.1330, TP 1.1440

XAUUSD Bullish Continuation Setup (read-caption)📊 Chart Overview:
Asset: Unspecified (likely XAUUSD or a crypto asset).
Timeframe: Looks like 4H or Daily.
Tools Used:
EMA 50 (🔴 Red Line) — 3,283.978
EMA 200 (🔵 Blue Line) — 3,185.603
Resistance & Support Zones (🔴 Highlighted boxes)
Price: 3,335.415
🔍 Technical Analysis:
🟩 Trend Direction:
📈 Uptrend Confirmed: Price is above both EMA 50 and EMA 200 → Strong bullish momentum.
✅ Golden Cross: EMA 50 is above EMA 200, confirming long-term bullish bias.
📌 Key Levels:
🧱 Main Support Zone (🟥 Bottom Box - ~2,950–3,050):
Historical strong bounce zone.
Acts as a bullish base in case of a deeper pullback.
🔄 Mid Resistance/Support (~3,180–3,260):
Now acting as support after price bounced above it.
Also aligns with EMA 200 ➕🟦 – adds confluence.
📌 Main Resistance Zone (~3,300–3,380):
Current area of consolidation.
If broken, price likely to retest upper resistance.
🚧 Top Resistance Zone (~3,450–3,500):
Target area if bullish breakout continues.
✈️ Next take-profit zone for bulls.
🧭 Market Forecast:
🔁 Retest Expected: Price might pull back slightly to the main resistance area (~3,300), retesting previous resistance as support.
🚀 Upside Potential: Upon successful retest, price is projected to head toward the upper resistance (~3,480).
📉 Bearish Scenario: If price breaks back below 3,260 and EMA 50, expect a dip toward 3,180 or even the main support zone.
📈 Summary:
Bias: ✅ Bullish
Watch for:
🔍 Retest of 3,300 zone
✅ Breakout above 3,380
❌ Breakdown below 3,260 invalidates bullish scenario

NATRIUM | Investing | Why BILL GATES is Betting on NATRIUMBill Gates is betting big on Natrium - should you be, too?
Natrium is this next-generation nuclear reactor design that's attracting a lot of attention from people like Bill Gates and other major investors. What's particularly interesting about it is that it combines a fast reactor with a built-in molten salt "battery." Essentially, it can generate a steady output of power and then provide an extra boost during peak demand by drawing on its stored heat. This design aims for greater flexibility in meeting fluctuating electricity needs.
The technology is a joint development by TerraPower, the company co-founded by Bill Gates, and GE Hitachi. They're presenting it as a zero-carbon power source capable of reliably backing up intermittent renewables like wind and solar, ensuring a consistent supply of clean energy.
The excitement from investors like Bill Gates appears to be driven by the need to address climate change and secure reliable energy supplies. They view Natrium as a way to deliver large-scale, carbon-free power while potentially overcoming some of the limitations of older nuclear reactor designs. Gates has emphasized the enhanced safety features and potential for lower operating costs. Furthermore, Natrium's specific design to complement the intermittency of solar and wind, through its energy storage, is a significant draw for investors looking at future energy solutions. The substantial public and private investment, including government funding and bipartisan legislative support, also signals strong confidence in this technology.
The description of TerraPower as a "Bill Gates-backed" firm developing this multi-billion dollar demonstration plant highlights the high-profile nature of the project. The fact that corporate partners, such as the data center company exploring Natrium for their power needs, are also getting involved indicates a broader recognition of its potential beyond just government initiatives.
Compared to traditional nuclear reactors, Natrium offers some potential advantages. Its sodium coolant operates at near-atmospheric pressure, simplifying safety compared to the high-pressure water systems in older designs. This allows for natural heat dissipation in case of issues, reducing the risk of large steam explosions. Another key aspect is Natrium's potential for more efficient fuel utilization and reduced long-lived waste generation. The design aims for better fuel efficiency and a smaller volume of long-term radioactive waste compared to current light-water reactors.
Natrium's primary advantage over wind and solar is its dispatchability. Unlike the intermittent nature of renewables, Natrium can provide power consistently, 24/7. The integrated energy storage allows it to complement renewables by absorbing excess energy or releasing power during periods of low renewable output. This firm grid support is a significant benefit for utilities concerned about grid stability and the variability of renewable sources.
For utilities transitioning away from coal, Natrium offers a carbon-free, relatively direct replacement in terms of power output. It also has a smaller land footprint compared to large-scale wind or solar installations.
There are inherent challenges with a first-of-a-kind system like Natrium. The prototype is still under construction, lacking a proven operational track record. Construction and licensing processes could face delays and cost overruns. Critics also raise valid points about the actual safety and cost-effectiveness compared to projections. The use of sodium coolant, while offering safety advantages, also presents risks due to its reactivity with air and water, requiring robust containment systems. Regulatory scrutiny will undoubtedly be extensive.
And fuel supply is a critical uncertainty. Natrium requires high-assay, low-enriched uranium (HALEU), which is not currently widely available. Disruptions in the supply chain and limited existing production capacity pose a significant risk to the timely and cost-effective operation of Natrium plants.
Looking ahead, Natrium is being considered for deployment in regions needing reliable power to complement renewables and to power energy-intensive industries. The long-term vision involves integrating Natrium with renewable energy sources to create a more stable and decarbonized grid.
The speculative outlook for Natrium in the next 5-10 years is heavily dependent on the successful completion of the Wyoming demonstration plant. If it meets its targets, it could pave the way for wider adoption. However, the timeline is ambitious, and challenges related to fuel supply and regulatory approvals remain. A successful demonstration could trigger significant investment and adoption in the coming decades, positioning Natrium as a key player in the energy transition.
If you're interested in investing in companies involved with TerraPower's Natrium reactor, several publicly traded firms are integral to its development and supply chain:
🔧 Engineering & Construction
KBR Inc. | (NYSE: KBR)
KBR has formed a strategic alliance with TerraPower to commercialize and deploy Natrium reactors globally. The collaboration focuses on creating a replicable contracting framework to reduce financial risk and ensure cost transparency in deploying Natrium technology.
terrapower.com
⚛️ Nuclear Fuel & Components
BWX Technologies Inc. | (NYSE: BWXT)
BWXT has been awarded a contract by TerraPower to design the Intermediate Heat Exchanger for the Natrium demonstration project. This component is critical for transferring heat within the reactor system.
Centrus Energy Corp. | (NYSE American: LEU)
Centrus Energy is collaborating with TerraPower to establish domestic production capabilities for high-assay, low-enriched uranium (HALEU), which is essential for fueling the Natrium reactor.
⚙️ Manufacturing & Industrial Partners
Doosan Enerbility Co., Ltd. | 034020.KQ (KOSDAQ)
Doosan Enerbility is supplying critical components for the Natrium reactor, including the core barrel and internal supports.
HD Hyundai | 329180.KQ
HD Hyundai is manufacturing the reactor vessel for the Natrium project.
🌍 International Collaborators
SK Inc. | 034730.KQ
SK Inc., a South Korean conglomerate, has invested $250 million in TerraPower to support the demonstration and commercialization of the Natrium reactor.
Korea Hydro & Nuclear Power (KHNP) | 15760.KS (KOSPI)
KHNP has entered into a strategic collaboration with TerraPower to support the Natrium project, leveraging its expertise in nuclear power development.
OTHERS:
1. Mirion Technologies (NYSE: MIR)
Mirion is supplying the Radiation Monitoring System (RMS) and Nuclear Instrumentation System (XIS) for the Natrium Reactor Demonstration Project in Wyoming.
2. GE Vernova (NYSE: GEV)
Through its subsidiary, Global Nuclear Fuel–Americas (GNF-A), GE Vernova is partnering with TerraPower to establish the Natrium Fuel Facility in Wilmington, North Carolina. This facility aims to produce high-assay, low-enriched uranium (HALEU) fuel essential for the Natrium reactor.
3. NuScale Power Corporation (NYSE: SMR)
While not directly involved with the Natrium project, NuScale is a prominent developer of small modular reactors (SMRs), a category that includes Natrium. The company's advancements in SMR technology contribute to the broader nuclear energy landscape.
4. Southern Company (NYSE: SO)
Southern Company is collaborating with TerraPower on the development of a molten chloride fast reactor (MCFR), a separate advanced nuclear project. Their involvement in advanced nuclear technologies aligns with the innovations seen in the Natrium project.
________________________________
Sources: Recent industry reports and news articles and TerraPower press releases provide the data above. Also put together with the help of AI.
world-nuclear-news.org, ans.org, gatesnotes.com, scientificamerican.com, terrapower.com, reuters.com

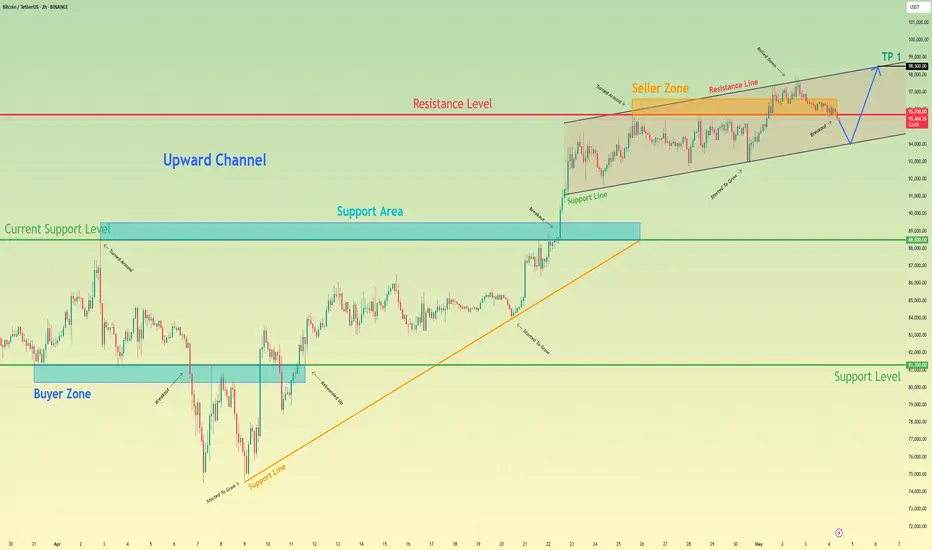
Bitcoin can bounce from support line of channel to 98500 pointsHello traders, I want share with you my opinion about Bitcoin. Looking at this chart, we can observe how the price of Bitcoin has been in recent price action. The asset had been confidently moving inside an upward channel, building structure through higher highs and higher lows. Each upward impulse was supported by pullbacks to the support line, showing continued buyer pressure. The latest breakout above the support area confirmed a bullish continuation, and the price entered the seller zone, where it faced resistance. Despite multiple attempts to break through, the price repeatedly turned around, forming a tight triangle pattern within the upper boundary of the channel. Currently, the price has broken down from the triangle, but it still holds above the channel's lower line. Given that the channel remains intact and there's no strong breakdown of the structure, I expect the price to rebound from the lower boundary and continue climbing toward my TP 1 at 98500, which aligns with the resistance line of the channel. Please share this idea with your friends and click Boost 🚀
EUR/GBP Wedge Breakout (06.05.2025)The EUR/GBP Pair on the M30 timeframe presents a Potential Selling Opportunity due to a recent Formation of a Wedge Breakout Pattern. This suggests a shift in momentum towards the downside in the coming hours.
Possible Short Trade:
Entry: Consider Entering A Short Position around Trendline Of The Pattern.
Target Levels:
1st Support – 0.8476
2nd Support – 0.8463
🎁 Please hit the like button and
🎁 Leave a comment to support for My Post !
Your likes and comments are incredibly motivating and will encourage me to share more analysis with you.
Best Regards, KABHI_TA_TRADING
Thank you.
