Analysis

GOLD (XAU/USD) Breakout Watch –Bullish Continuation or Pullback?🔍 Instrument Analysis: XAU/USD (Gold vs USD)
Timeframe: Likely 1H or 4H (based on candle structure)
Indicators:
EMA 50 (Red) – Current value: 3,365.25
EMA 200 (Blue) – Current value: 3,248.04
📈 Current Market Structure
Price: Trading at 3,433.62, in a strong uptrend with higher highs and higher lows.
Trend: Bullish, supported by price trading above both the 50 EMA and 200 EMA.
Key Zones:
Immediate Resistance: ~3,430 - 3,440 zone (currently being tested).
First Support Zone: ~3,315 - 3,330
Second Support Zone: ~3,250 - 3,270
🧠 Scenario Analysis
✅ Bullish Scenario (Primary Bias)
Price is attempting a break and retest of the resistance zone.
If a successful retest confirms it as support, next upside leg could target 3,480+.
Bullish continuation is favored as long as price holds above 3,385 (recent breakout level).
⚠️ Bearish Scenario (Secondary Bias)
If price fails to hold above 3,385, we may see a pullback to:
3,315 - 3,330 support area (reaction likely due to proximity to EMA 50).
A deeper retracement toward the 3,250 zone, aligned with EMA 200, which would be a critical level for bullish continuation or breakdown.
📊 EMA Insight
EMA 50 > EMA 200: Confirms bullish momentum.
The slope of both EMAs is upward, reinforcing current upward trend.
A test of the EMA 50 may offer a buy opportunity if structure holds.
🔔 Trade Outlook
Bullish bias remains intact above 3,385.
Look for bullish price action confirmation (bullish engulfing, pin bars, etc.) on retest of resistance-turned-support.
Monitor volume/activity around 3,385-3,400 for potential rejection or continuation clues.

GOLD SMASHES THROUGH $3,450🚨 GOLD SMASHES THROUGH $3,450 – IS THIS THE START OF A GLOBAL FINANCIAL RESET? 🚨
🔥 Unstoppable Surge in Motion 🔥
Gold has soared past $3,450 as Asian markets opened, climbing over $100 a day!
In just two weeks, gold is up by over $500 — this isn’t just a rally, it’s a major structural breakout.
A surge in demand from Chinese funds appears to be fuelling the rise, with increasing evidence that Asia is leading a strategic shift away from fiat risk.
💷 Is the Dollar in Decline? Investors Flee the Old System 💷
The US Dollar Index (DXY) has taken a sharp downturn — confidence in USD is clearly under pressure.
Capital is flowing out of the United States, signalling a move away from the traditional financial order dominated by the dollar.
This gold rally isn't just about price — it's a global vote of no confidence in the status quo.
📉 Implications for the UK
With the pound holding relatively stable against the dollar, this gold spike presents a unique hedge opportunity.
For UK investors, rising gold prices could help offset currency risk and inflation concerns — especially in the face of persistent market uncertainty and geopolitical tensions.
📊 Technical Overview 📊
Gold is currently testing critical resistance around $3,519.
A pullback may see it retest support at $3,416 or as low as $3,210.
Fibonacci levels indicate a likely consolidation zone around $3,416.
The momentum is strong — we could be in the early phase of a global asset rotation.
📈 2-Hour Gold Chart Insight
Recent charts show a parabolic move with significant volume, primarily from Asia-based buyers.
This is not a short-term speculative move — it's likely a long-term strategic repositioning.
🌍 What Comes Next? 🌍
Should gold maintain levels above $3,450, a move towards $3,600 and beyond looks increasingly likely.
Talk of a financial "reset" is no longer just fringe theory — it’s entering the mainstream conversation.
From a UK perspective, now could be the time to:
Re-evaluate gold as a portfolio stabiliser
Reconsider exposure to US-denominated assets
Anticipate further volatility across fiat currencies
📌 Key Price Levels to Watch:
Resistance: $3,519 / $3,601
Support: $3,416 / $3,210
Upside Target: $3,600+
📈 Suggested Trading Zones:
Buy Zone
Entry: $3,424 – $3,422
Stop Loss: $3,418
Take Profit Targets: $3,428 / $3,432 / $3,436 / $3,440 / $3,450
Sell Zone
Entry: $3,604 – $3,606
Stop Loss: $3,610
Take Profit Targets: $3,600 / $3,596 / $3,592 / $3,588 / $3,584 / $3,580
💬 What’s your take? Is gold signalling the end of USD dominance?
Is the UK prepared for a global monetary shake-up? Let’s discuss. 🪙

Fundamental Market Analysis for April 22, 2025 GBPUSDGBPUSD:
The GBP/USD pair is trading in positive territory around 1.3370 during the early Asian session on Tuesday. Concerns over slowing growth in the United States (US) and worries over the independence of the Federal Reserve (Fed) are driving the US Dollar (USD) lower and creating a tailwind for the major pair.
US President Donald Trump condemned Powell for continuing to maintain a “wait-and-see” monetary policy until there is clarity on how the new tariff policy will affect the economic outlook. In a Truth social media post, Trump warned that the US economy will slow down if Powell doesn't cut interest rates immediately.
Heightened uncertainty surrounding Trump's tariffs and rising trade tensions between the U.S. and China are undermining the U.S. dollar across the board.
On the other hand, softer UK consumer price index (CPI) inflation data for March and global uncertainty paved the way for an interest rate cut by the Bank of England (BoE) at its May meeting. Financial markets are now betting on an interest rate cut at the Bank of England's May meeting, estimating an 86% probability of this happening, according to LSEG data. This, in turn, could affect the Pound Sterling (GBP) exchange rate against the US Dollar.
Trading recommendation: BUY 1.3425, SL 1.3395, TP 1.3510

FET/USDT - Trendline Breakout (22.04.2025)The FET/USDT Pair on the M30 timeframe presents a Potential Selling Opportunity due to a recent Formation of a Breakout Pattern. This suggests a shift in momentum towards the downside in the coming hours.
Possible Short Trade:
Entry: Consider Entering A Short Position around Trendline Of The Pattern.
Target Levels:
1st Support – 0.553
2nd Support – 0.516
🎁 Please hit the like button and
🎁 Leave a comment to support for My Post !
Your likes and comments are incredibly motivating and will encourage me to share more analysis with you.
Best Regards, KABHI_TA_TRADING
Thank you.

USD/CAD - Channel Pattern (22.04.2025)The USD/CAD Pair on the M30 timeframe presents a Potential Selling Opportunity due to a recent Formation of a Channel Pattern. This suggests a shift in momentum towards the downside in the coming hours.
Possible Short Trade:
Entry: Consider Entering A Short Position around Trendline Of The Pattern.
Target Levels:
1st Support – 1.3771
2nd Support – 1.3745
🎁 Please hit the like button and
🎁 Leave a comment to support for My Post !
Your likes and comments are incredibly motivating and will encourage me to share more analysis with you.
Best Regards, KABHI_TA_TRADING
Thank you.

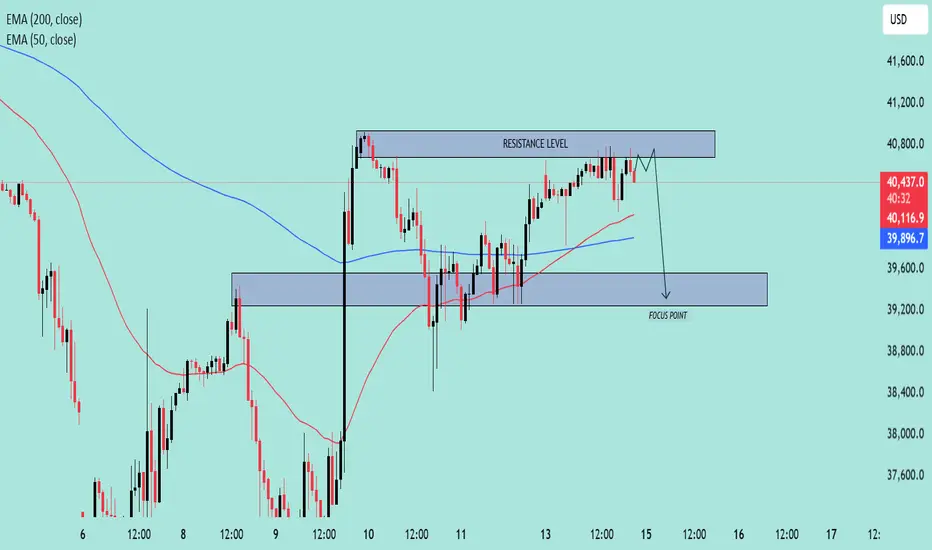
US30 Approaching Key Resistance–Potential Reversal Setup in Play🧠 Chart Overview
Asset: US30 (likely the Dow Jones Industrial Average)
Timeframe: Appears to be 1H or 2H
Indicators:
EMA 50 (Red): 40,119.5
EMA 200 (Blue): 39,897.3
Price at time of chart: Around 40,503
🔍 Key Technical Levels
🔴 Resistance Zone
Range: ~40,750 to 40,850
Price has tested this level multiple times and is currently hovering near it.
The resistance is holding, and no strong breakout has occurred.
🟦 Support / Focus Zone
Range: ~39,200 to 39,600
Marked as the “FOCUS POINT” – likely the expected target on a breakdown.
EMAs Insight:
Price is above both the 50 EMA and 200 EMA, suggesting short-term bullishness.
However, since it’s stalling at resistance, it could flip bearish on rejection.
🧭 Price Action Narrative
The chart suggests a potential fakeout above resistance, followed by a sharp rejection.
The path drawn shows a short-term dip, targeting the FOCUS POINT (support zone).
Rejection at resistance aligns with typical distribution behavior.
📌 Trade Idea (Bearish Bias)
Entry Idea: Short near or just above the resistance level (~40,800)
Target: 39,400 zone
Stop-Loss: Above the resistance level (~40,900+)
Risk/Reward: Favorable if price fails to break above resistance convincingly
📉 Bias: Bearish Reversal
Unless price breaks and closes above resistance with strong momentum, the chart favors a pullback scenario.
Gold (XAU/USD) Bullish Continuation Setup – Key Support Levels 📊 Chart Context & Setup
Chart Type: Candlestick
Indicators Used:
50 EMA (red): Currently at 3,199.009
200 EMA (blue): Currently at 3,123.168
Support Zone: Around 3,157.786 – 3,123.168
Current Price: Approximately 3,211.90
Focus Point (Target Zone): 3,283.810
🧠 Technical Analysis
🔹 Trend Analysis
Overall Trend: Bullish
Price is trading above both the 50 EMA and 200 EMA.
The EMAs are sloping upward, indicating strong momentum.
Golden Cross previously occurred (50 EMA crossing above 200 EMA).
🔹 Key Support & Resistance
Immediate Resistance Zone: Around 3,240
This area is acting as a potential rejection zone, with minor consolidation.
Support Zone (Highlighted): 3,157 – 3,123
This zone was previously a breakout level and now serves as a retest support.
It coincides with the 200 EMA, adding to its strength.
🔁 Scenarios Presented
Scenario A – Bullish Rejection from Immediate Support (3,199)
Price could hold above or near the 50 EMA.
Break and retest of minor resistance could lead to a push toward 3,283.81 (target).
This is a higher-risk entry as the support is not deeply tested yet.
Scenario B – Deeper Pullback to Major Support (3,157 – 3,123)
A drop below current price into the main demand zone.
Bullish engulfing or strong reaction in this zone would offer a high-probability long setup.
Ideal entry point for swing traders, especially if confirmed by volume or bullish candlestick reversal.
🎯 Trade Strategy Suggestion
✅ Long Setup
Entry Option 1: On bullish rejection above 3,199 with confirmation.
Entry Option 2 (Preferred): At strong support zone 3,157 – 3,123 with bullish reversal signal.
Target: 3,283.81
Stop Loss:
For Entry 1: Below 3,157
For Entry 2: Below 3,100 or 200 EMA, depending on aggressiveness
📌 Conclusion
This chart illustrates a classic bullish continuation setup with two potential entry scenarios:
A minor pullback and bounce from the 50 EMA.
A deeper retracement into a strong support zone aligned with the 200 EMA.
The uptrend remains intact as long as the price holds above the 200 EMA and the major demand zone. A break below 3,100 would invalidate the bullish outlook short-term

Fundamental Market Analysis for April 21, 2025 EURUSDEUR/USD broke out of a multi-day trading range and hit a new high since February 2022 around 1.1485 during the Asian session on Monday.
Despite “aggressive” comments from Federal Reserve (Fed) Chairman Jerome Powell, uncertainty over US President Donald Trump's trade policy continues to undermine the dollar. Last Wednesday, Powell said the Fed would likely keep the benchmark interest rate unchanged and wait for more clarity before considering any policy adjustments. Meanwhile, Trump's retaliatory tariff announcements undermined investor confidence in U.S. economic growth and drove the dollar to a two-year low early in the new week.
The aforementioned factors largely offset the European Central Bank's (ECB) soft decision last week and served as a tailwind for EUR/USD. On Thursday, the ECB cut interest rates for the seventh time in a year and warned that economic growth would be hit hard by US tariffs, bolstering the case for further policy easing in the coming months.
Moving forward, traders this week will be focused on scheduled speeches by ECB President Christine Lagarde on Tuesday and a number of influential FOMC members this week. In addition, the market's focus will be on the release of flash PMI indices, which could provide new insights into the state of the global economy. This, in turn, may give some impetus to the US dollar and EUR/USD.
Trade recommendation: BUY 1.1520, SL 1.1465 , TP 1.1565.

Gold hits new record — Next stop: $4000!Gold has soared above $3,300 per ounce, setting a new all-time high. Since the beginning of the year, XAUUSD has gained over 20% , and analysts are warning: this may just be the beginning of a rally toward $4,000. As geopolitical tensions flare, supply chains for critical minerals falter, and traditional risk assets crumble, the spotlight is back on gold as the ultimate safe haven.
FreshForex analysts have been forecasting this surge since November 2023. We believe gold will remain a strong investment, supported by a range of powerful factors:
Trade war escalation: Donald Trump has signed executive orders targeting the reduction of U.S. reliance on imported strategic minerals like uranium, cobalt, and rare earths — the market reacted instantly. Conflicts, wars, sanctions, and international tension typically drive investors to seek refuge in gold.
Fed at a crossroads: The probability of a rate cut in May is 92.3% (CME data). Lower interest rates reduce returns on traditional fixed-income instruments like bonds, making gold a more appealing option for investors.
Central banks are stockpiling gold: In Q1 2025, global gold purchases surged 41% compared to 2024. Gold ETFs are holding a record $345.5 billion. Many countries are ramping up gold reserves to diversify away from the U.S. dollar, fueling further demand for physical gold.
Inflation and structural debt crisis in the U.S.: The University of Michigan forecasts consumer inflation at 6.7% — the highest since 1981. Rising yields, budget deficits, and political instability are accelerating capital flight from the dollar.
Goldman Sachs analysts (#GoldmanSac) have once again raised their gold forecast. The investment bank expects gold to reach $3,700 per ounce by the end of this year and $4,000 by mid-2026. Meanwhile, FreshForex believes the $4,000 mark could be tested as early as this year!

Gold Daily Outlook Short-Term Pullback Before Trend Continuation📌 Gold Daily Outlook – Short-Term Pullback Before Trend Continuation? 💡📉
📊 Technical Overview
Gold (XAU/USD) is currently testing a key resistance zone around 3412 – 3414, where we could see short-term selling pressure emerge after recent bullish momentum. Following a strong rally, the market may be preparing for a healthy retracement to collect liquidity before resuming the trend.
The chart shows signs of a potential intraday distribution pattern forming near highs, especially as price struggles to break above resistance during the early Asian session. Today’s outlook leans toward a short-term dip into support zones before buyers potentially step back in.
🔴 SELL ZONE (Short-term Reversal Opportunity)
Entry: 3412 – 3414
Stop Loss: 3420
Take Profit: 3409 → 3400 → 3390 → 3380 → 3370
This is a high-probability reversal zone. If price prints bearish confirmation (e.g., pin bar or engulfing candle), short entries may offer favourable risk-reward setups.
🟢 BUY ZONE 1 – Minor Pullback Area
Entry: 3355 – 3353
Stop Loss: 3348
Take Profit: 3358 → 3370 → 3380 → 3390 → 3400
Ideal for quick buy setups if price reacts cleanly to this mid-structure level.
🟢 BUY ZONE 2 – Deeper Support for Trend Re-entry
Entry: 3335 – 3333
Stop Loss: 3328
Take Profit: 3338 → 3350 → 3360 → 3370 → 3380
If a deeper pullback occurs, this zone may act as a key demand area and offer clean trend continuation opportunities.
🌍 Fundamental Insight
No major economic events are scheduled today, so market direction will likely follow technical structure.
USD is showing mild intraday strength, adding some pressure on gold in the short term.
Overall sentiment still supports gold as a safe-haven, but short-term profit-taking near highs is expected after recent aggressive buying.
⚠️ Strategy Notes
Focus on trading within defined structure: Sell from resistance with confirmation; buy dips at clean support zones.
Avoid FOMO entries – let the market give you confirmation.
Always use clear TP/SL levels – especially in a sensitive market environment like this.
💬 How are you approaching gold today? Looking to fade highs or waiting for dip-buy setups? Drop your thoughts below! 👇👇👇

ENA/USDT Breakout Pattern (18.04.2025)The ENA/USDT pair on the M30 timeframe presents a Potential Buying Opportunity due to a recent Formation of a Breakout Pattern. This suggests a shift in momentum towards the upside and a higher likelihood of further advances in the coming hours.
Possible Long Trade:
Entry: Consider Entering A Long Position around Trendline Of The Pattern.
Target Levels:
1st Resistance – 0.3015
2nd Resistance – 0.3217
🎁 Please hit the like button and
🎁 Leave a comment to support for My Post !
Your likes and comments are incredibly motivating and will encourage me to share more analysis with you.
Best Regards, KABHI_TA_TRADING
Thank you.

Bitcoin may exit from pennant and fall to support levelHello traders, I want share with you my opinion about Bitcoin. Over the past weeks, the price traded inside a broad horizontal range, repeatedly testing the boundaries of the seller zone and the buyer zone. After several failed breakouts, the price sharply dropped from the upper range and entered a phase of lower highs, forming a downward pennant structure. Inside this pennant, the market continued consolidating under pressure from the resistance area. Each attempt to break above the resistance line was met with rejection, confirming strong selling interest near the current resistance level at 88500. At the moment, BTC is testing the upper boundary of the pennant again. This area aligns closely with the resistance level and the long-term descending trendline. Given this confluence and historical rejection zones, I expect BTC to face resistance and reverse, initiating a decline back toward the 79000 support level, thereby exiting from the pennant, which is my current TP1. The compressed price structure, repeated rejections, and clean pattern formation support this bearish outlook in the short term. Please share this idea with your friends and click Boost 🚀

Euro may correct to support area and then rebound upHello traders, I want share with you my opinion about Euro. Looking at the chart, we can see that the price started its growth from the buyer zone between 1.0730 - 1.0785 points, where the price found strong support near the lower boundary of the broadening wedge. After bouncing off that zone, Euro gained momentum and made an impulsive move upward, breaking through the resistance line and establishing a bullish trajectory. Once the pair overcame the 1.1265 level, which is now acting as current support, the price entered a period of consolidation inside the support area between 1.1310 - 1.1265 points. This zone is showing signs of strength again, with the price attempting to stabilize above it. The overall structure continues to respect the boundaries of the broadening wedge, with higher highs and higher lows confirming bullish control. At the moment, EUR is correcting slightly after reaching local highs and is approaching the support area again. A healthy pullback toward 1.1310 - 1.1265 would be in line with the pattern and could trigger the next bullish impulse. Given the ongoing upward structure, the strong support area, and the clear wedge formation, I expect Euro to continue growing toward the upper wedge boundary near 1.1555 points, which is my current TP1. Please share this idea with your friends and click Boost 🚀

GBPUSD Discretionary Analysis: Bounce at 1.33Hello traders.
On GBPUSD, I'm watching this 1.33 zone closely. It's where I'll be looking for a reaction. It can be a solid bounce spot if it shows signs.
Discretionary Trading: Where Experience Becomes the Edge
Discretionary trading is all about making decisions based on what you see, what you feel, and what you've learned through experience. Unlike systematic strategies that rely on fixed rules or algorithms, discretionary traders use their judgment to read the market in real time. It's a skill that can't be rushed, because it's built on screen time, pattern recognition, and the ability to stay calm under pressure.
There's no shortcut here. You need to see enough market conditions, wins, and losses to build that intuition—the kind that tells you when to pull the trigger or sit on your hands. Charts might look the same, but context changes everything, and that's something only experience can teach you.
At the end of the day, discretionary trading is an art, refined over time, sharpened through mistakes, and driven by instinct. It's not for everyone, but for those who've put in the work, it can be a powerful way to trade.

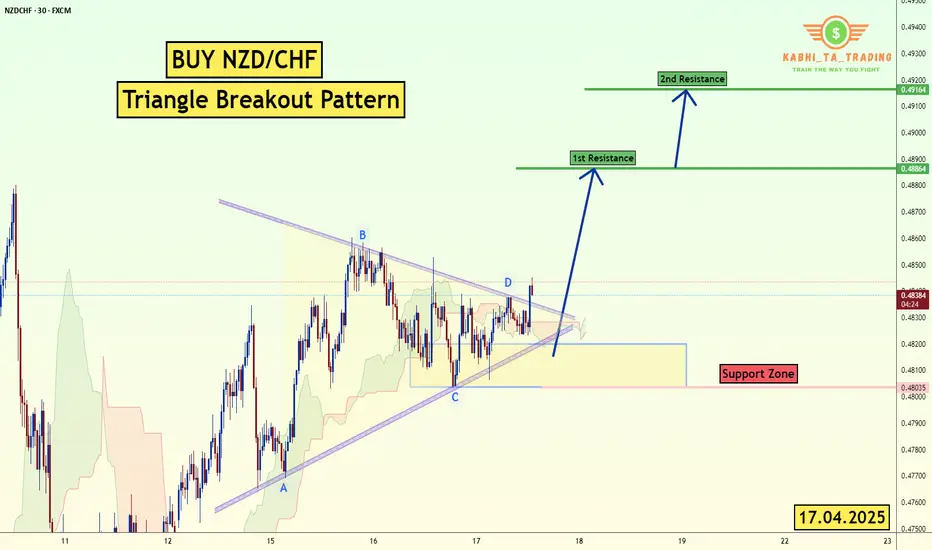
NZD/CHF Triangle Breakout (17.04.2025)The NZD/CHF pair on the M30 timeframe presents a Potential Buying Opportunity due to a recent Formation of a Breakout Pattern. This suggests a shift in momentum towards the upside and a higher likelihood of further advances in the coming hours.
Possible Long Trade:
Entry: Consider Entering A Long Position around Trendline Of The Pattern.
Target Levels:
1st Resistance – 0.4886
2nd Resistance – 0.4916
🎁 Please hit the like button and
🎁 Leave a comment to support for My Post !
Your likes and comments are incredibly motivating and will encourage me to share more analysis with you.
Best Regards, KABHI_TA_TRADING
Thank you.
WILL THE S&P 500 COME CRASHING DOWN? TRIPLE RSI DIVERGENCE?!S&P 500 (SPX) Is considered to be one of the primary benchmarks for the U.S economy. Recently it appears to be showing a triple bearish RSI divergence, DMI indicating bearish with ADX above 20, and a bearish MACD on the 1 Month chart. The technical analysis seems to have a highly bearish hypothesis in my opinion. If we give some thought to Ray Dalio's Principles for Dealing with the Changing World Order , some haunting indicators appear to be forming. Could this just be a minor correction? Or is this the beginning of an extended economic downturn?
Disclaimer: Not financial advice.

Gold can exit from wedge and drop to support levelHello traders, I want share with you my opinion about Gold. Price action on Gold has shown strong bullish momentum earlier, as it broke out of the previous upward channel and started forming an upward wedge. The rally gained traction once the price left the buyer zone between 3006 - 3025 points, pushing through multiple resistance levels and creating a new structure of higher highs. After the breakout from the wedge’s support line, the price continued to grow and eventually reached the upper boundary of the wedge pattern. Here, we saw a clear reaction and reversal, signaling potential exhaustion among buyers. Currently, the price is trading just below the upper wedge resistance and has already made a pullback after the latest local high. Given this structure and the fact that the wedge pattern is tightening, I expect gold to reverse again and decline toward 3270, which is my first TP. If pressure continues, the price may drop to the 3210 current support level as TP2. The reaction from the upper wedge boundary, combined with weakening momentum and a strong support area below, supports my bearish outlook for now. Please share this idea with your friends and click Boost 🚀

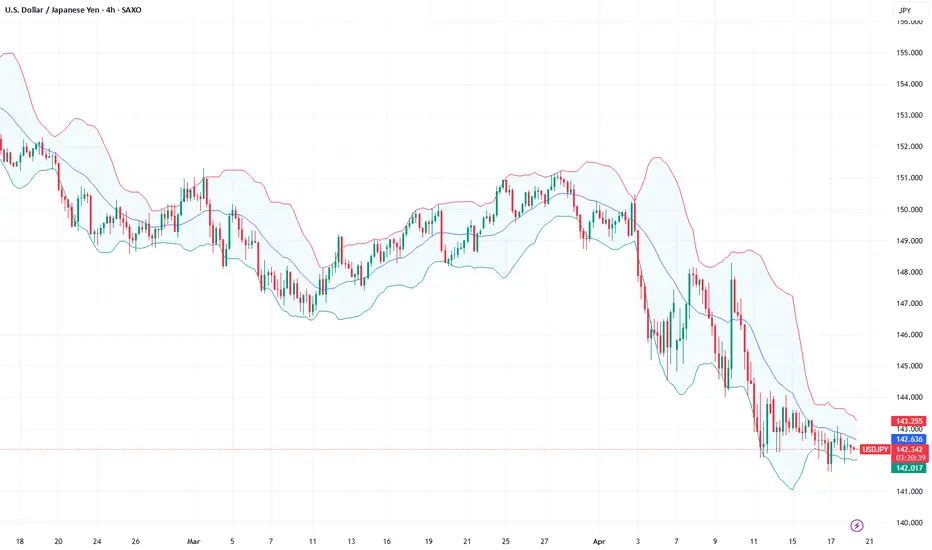
Fundamental Market Analysis for April 18, 2025 USDJPYThe USD/JPY pair is down to 142.25 in thin trading session on Friday. The US Dollar (USD) is declining against the Japanese Yen (JPY) amid concerns over the economic impact of tariffs.
Data released by the Statistics Bureau of Japan on Friday showed that the national consumer price index (CPI) rose 3.6% in March, up from the previous reading of 3.7%. Meanwhile, the national CPI excluding fresh food was 3.2% y/y in March, up from 3.0% previously. The reading was in line with the market consensus.
Finally, the consumer price index excluding fresh food and energy rose 2.9% y/y in March vs. the previous reading of 2.6%. The Japanese Yen remains strong against the US Dollar as an immediate reaction to Japanese inflation data.
However, JPY gains may be limited as Bank of Japan (BoJ) officials signalled a pause in the consideration of interest rate hikes, emphasising the need to monitor uncertainty heightened by US tariff measures.
Economic data from the US on Thursday was mixed. US initial jobless claims fell to their lowest level in two months, signalling a stable labour market. In addition, the Philadelphia Fed index fell short of expectations, a warning shot from the manufacturing sector.
Trade recommendation: SELL 142.05, SL 143.40, TP 139.80
Gold Hits New Highs as US-China Tensions Escalate 📌 Gold Outlook: US-China Trade Tensions Fuel New Bullish Wave Amid Policy Uncertainty 🧨📈
🌍 Geopolitical Drivers Taking the Lead
On April 15th, President Donald Trump ordered an investigation into potential tariffs on all critical minerals imported into the U.S. – a move seen as the latest escalation in his ongoing economic confrontation with global trade partners, most notably China.
This development has shaken overall market sentiment, prompting investors to rotate into safe-haven assets like gold, which has surged in response.
At the same time, the U.S. Dollar weakened sharply, nearing 3-year lows last week, further increasing gold’s appeal for holders of other currencies.
🏦 Central Bank Uncertainty Adds Fuel to the Fire
Fed Chairman Jerome Powell stated that the central bank would not intervene to “rescue” markets during turbulent periods, suggesting that volatility may persist as hedge funds unwind leverage and global investors remain cautious.
He emphasized that the current volatility may be driven by shifting trade policies and broader uncertainty — which he said is “too early to fully diagnose.”
With central banks showing no immediate intent to inject liquidity or cut rates, the bullish case for gold remains strong in the coming weeks.
📊 Technical Outlook: New Highs in Sight, But Volatility Will Be Sharp
Gold continues to print new ATHs, and the dominant strategy right now is to trade with the trend — which clearly remains bullish. In such an environment, sudden drops are normal and not necessarily tied to any single news event.
Rather than attempting to short the market near highs, we are focusing on catching bullish continuation setups after sharp intraday corrections. These will likely form at support zones or classic continuation patterns on M15/M30 timeframes.
🔍 Price Levels to Watch
🟢 Support Zones:
3314 – 3300 – 3284 – 3266
🔴 Psychological Resistance:
3380 – 3396 – 3410
💼 Trade Plan
BUY ZONE:
Entry: 3300 – 3298
SL: 3264
TP Targets: 3304 → 3308 → 3312 → 3316 → 3320 → 3324 → 3330 → higher
SELL ZONE (Psychological Reaction Only):
Entry: 3396 – 3398
SL: 3402
TP Targets: 3392 → 3388 → 3384 → 3380 → 3376 → 3370
⚠️ Final Thoughts
We remain firmly buy-biased, especially as gold continues to be driven by macro and political catalysts. Pullbacks should be welcomed — not feared — and seen as opportunities to scale into longs at structure.
While intraday drops may appear sharp and sudden, they often lack fundamental backing and provide the best entry conditions for continuation traders. Be cautious with shorts — unless reacting to extended psychological resistance zones.
Always trade with a clear plan and never forget to honor your TP/SL levels to safeguard your capital.
💬 How are you navigating gold during this surge in global tension? Are you buying dips or waiting for a deeper correction? Let us know below! 👇👇👇

If Nike Were Born Today: The Hypothetical Valuation of a New-AgeAbstract
Nike is one of the most recognizable brands on the planet, yet its valuation often lags behind newer, tech-driven companies with far less global influence. What if Nike were launched today — with its current revenue, market dominance, and brand power — but operated like a modern D2C startup with a tech DNA? This research explores what Nike would be worth in today’s market conditions, showing just how undervalued it may actually be when compared to new-age companies.
1. Introduction
Nike, Inc. (NYSE: NKE) is a global sportswear powerhouse with over $51 billion in annual revenue and a footprint in more than 170 countries. It has shaped athlete endorsement culture, built a generational brand, and transformed consumer behavior. Yet its current market capitalization sits around $80 billion — modest compared to newer players with less revenue but tech-first narratives.
This article dives into a simple but powerful hypothetical:
If a new company replicated Nike's current revenue and global dominance today, how would the market value it?
2. Nike Today: A Snapshot
Metric Value
FY2023 Revenue $51.2 Billion
Market Cap (Apr 17, 2025) ~$80 Billion
Net Profit Margin ~10.5%
P/E Ratio (TTM) ~17.9
Brand Value (Forbes, 2020) ~$39.1 Billion*
Global Reach 170+ Countries
*According to Forbes' Most Valuable Brands, Nike ranked #13 globally with a brand value of $39.1 billion in 2020. Other rankings (e.g., Interbrand 2023) place Nike's brand value even higher at $53.7 billion.
Despite being a category leader, Nike trades at a modest 1.6x sales multiple, compared to modern companies that command 5x, 7x, or even 30x+ valuations.
3. New-Age Valuation Framework
Today’s market rewards:
Tech-first operations
High-margin D2C models
Recurring revenue (subscriptions, memberships)
Community-driven brand growth
AI, personalization, and digital experiences
Let’s compare valuation multiples:
Company Sector Revenue Market Cap P/S Ratio
Nike Apparel $51.2B $80B ~1.6x
Lululemon Apparel SEED_TVCODER77_ETHBTCDATA:9B $50B ~5.5x
Salesforce SaaS $34B $240B ~7x
Nvidia AI/Chips $60B $2.3T ~38x
4. What Would a “Modern Nike” Be Worth Today?
If a new company today built:
$50B+ revenue
Global presence and branding like Nike
D2C-first, tech-enabled business
40–50% gross margins with scalable digital ops
Then, even at a conservative 6x revenue multiple, its valuation would be:
$50B × 6 = $300 Billion
And that's before factoring in:
AI-driven retail personalization
Creator monetization ecosystems
Loyalty programs and recurring revenue streams
Lower inventory risk with tech-driven fulfillment
5. Brand Value Through Royalty Method
Using the Royalty Relief Method:
Brand-attributable revenue (90% of $51.2B) = FWB:46B
Royalty rate = 6%
Annual royalty = $2.76B
Present Value (8% discount rate):
$2.76B ÷ 0.08 = \boxed{~$34.5B}
Nike’s brand, purely from an intellectual property lens, is worth significantly more than market pricing implies.
6. Why Nike Seems Undervalued
Categorized as a traditional apparel retailer vs. tech-first brand
Slower YoY growth relative to newer disruptors
Wholesale-heavy model impacts margins
Market overlooks its cultural dominance and brand loyalty
If Nike shifted its model to fully digital, leaned into AI and subscriptions, and emphasized platform economics, its valuation could more than double.
7. Conclusion
Nike, if built today, would not be an $80B company — it would likely be valued between $300B and $400B.
That’s the gap investors often miss.
Nike isn’t just a shoe and apparel brand — it’s global IP, media, culture, and influence. Yet in today’s market, it trades like a legacy retailer. If a startup were to achieve what Nike already has, it would be considered a generational tech unicorn.
Nike isn’t overvalued — it’s misunderstood.
About This Research
This research article was developed using AI-powered analytical tools, historical data modeling, and comparative valuation logic to explore hypothetical scenarios around Nike’s valuation. It combines financial fundamentals with modern market heuristics to offer a data-driven perspective on brand valuation in the context of today’s tech-driven economy.
Disclaimer
The information provided in this article is for informational and educational purposes only and does not constitute financial, investment, or trading advice. The analysis, opinions, and projections expressed are solely those of the author and are based on publicly available data as of the time of writing. This article is a hypothetical research exploration and should not be interpreted as a recommendation to buy, sell, or hold any securities mentioned herein.
All trademarks, brand names, and company references (including Nike Inc., Nvidia, Salesforce, etc.) are the property of their respective owners and are used for illustrative purposes only. The author is not affiliated with, endorsed by, or sponsored by any of the mentioned companies.
Investing in the stock market involves risk, including the potential loss of principal. Readers are strongly advised to do their own research and consult with a licensed financial advisor or other qualified professionals before making any investment decisions.
Past performance does not guarantee future results. The hypothetical scenarios and valuations discussed in this article are speculative in nature and are not guarantees of future company valuations or performance.

Bitcoin can exit from triangle and drop to support levelHello traders, I want share with you my opinion about Bitcoin. The chart shows how the price previously made a strong decline, followed by a sharp rebound from the buyer zone between 77800 - 79000 points. This recovery formed a short-term uptrend, which led the price back into the seller zone, where bullish momentum slowed down. After testing resistance, BTC formed a wedge pattern that eventually broke to the downside, causing a new wave of correction. Following this drop, the market rebounded again from support and began forming a triangle pattern. The triangle developed inside the same larger resistance area that had already rejected price action before. The structure of the triangle shows lower highs with clear resistance along the 88500 level, reinforcing bearish pressure. Currently, BTC is trading near the apex of this triangle, and the price just bounced down again from resistance. This reaction suggests that the market is struggling to push higher and could be ready for a breakdown. Based on the triangle structure, the seller zone rejection, and the multiple failed attempts to break higher, I expect BTC to move downward toward the 80000 points, which I consider as TP1. The 79000 - 80000 area also coincides with the next major support and previous accumulation zone. Please share this idea with your friends and click Boost 🚀

Crude Oil AnalysisFenzoFx—Crude Oil started a bullish wave from $55.15, trading at around $62.20. Momentum slowed near $63.90 resistance.
The Stochastic Oscillator indicates short-term overpricing as Crude Oil remains below $63.90, keeping the bearish trend intact. Price may dip toward $58.90 support, with further pressure potentially driving it to $55.15.
If Crude Oil surpasses $63.90, the bearish outlook invalidates, targeting $65.10 resistance.
>>> No Deposit Bonus
>>> %100 Deposit Bonus
>>> Forex Analysis Contest
All at F enzo F x Decentralized Forex Broker
