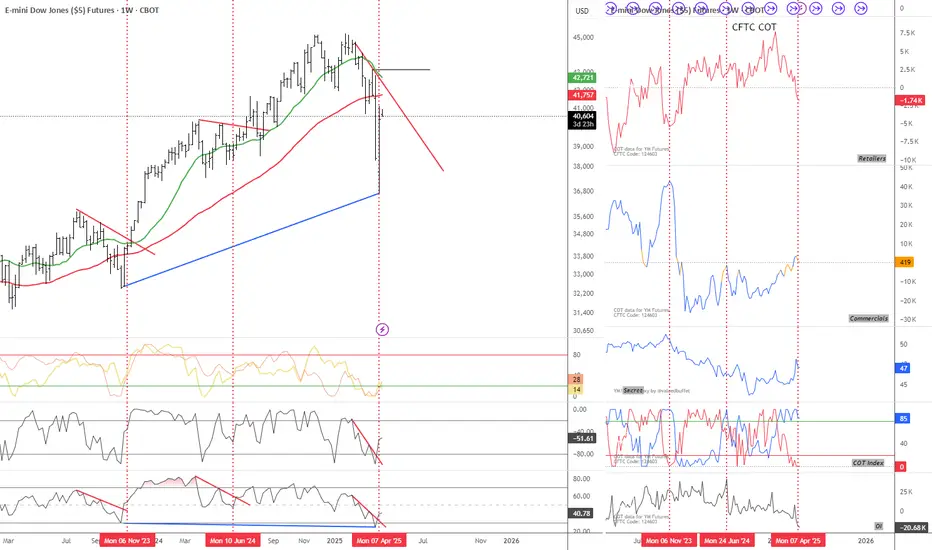
Is it going to happen again? My view to the markets right now...CBOT_MINI:YM1!
Is the Dow Jones breaking the downtrend again?
I believe there's a strong chance the markets are setting up for another move higher. From a fundamental standpoint, the recent pause in tariffs is a big deal. It removes an immediate layer of uncertainty that’s been hanging over the global economy, especially for exporters and multinational companies. On top of that, the fact that key tech products have been left out of the latest tariff actions is boosting confidence in the sector that has been leading market strength for years.
Economically, we’re still seeing resilience in key indicators. Unemployment remains low, consumer spending is steady, and central banks are staying cautious with tightening. The environment still leans more towards slow growth than recession, which supports equities over the medium term.
More importantly, my own criteria for a favorable market setup are lining up. Whether it’s sentiment, intermarket signals, or trend conditions—this looks like a solid spot for a bullish stance.
You can see my chart to check out my current viewpoint on the Dow Jones and how I’m positioning based on all this.
Not Financial Advice
Analysis
#DOGE #DOGEUSD #DOGEUSDT #DOGECOIN #Analysis #Eddy#DOGE #DOGEUSD #DOGEUSDT #DOGECOIN #Analysis #Eddy
DOGEUSDT.P Higher Time Frame Analysis
(( First, I predict a 35% drop, and finally, from the lower green line, a 178% growth to the first target, and then a 364% pump to the second target. ))
Important areas of the higher time frame are identified and labled.
Everything is clear and I have clearly drawn the important areas in the chart and the labels and names of the areas are included. Depending on your analytical style, you can get the necessary confirmations and see the reduction from the marked areas to the specified targets.
This Analysis is based on a combination of different styles, including the volume style with the ict style.
Based on your strategy and style, get the necessary confirmations for this analysis to buy entery the trade.
Don't forget risk and capital management.
The responsibility for the transaction is yours and I have no responsibility for not observing your risk and capital management.
💬 Note : The price can go much higher than the first target, and there is a possibility of a 364% pump on this currency. By observing risk and capital management, obtaining the necessary approvals, and saving profits in the target, you can keep it for the pump.
Be successful and profitable.
Proceed according to my analysis on the Total 3 chart.
My analysis of the Total 3 chart :
👆 Based on the analysis provided on the Total 3 chart, proceed and wait for another bearish lag for the Total 3 chart to reach the specified area. The divergence on the upper timeframe is most likely a market maker trap and the current bullish move is a fake. In my opinion, the main bullish move will begin after another 30-45% correction on altcoins and the Total 3 chart reaching the specified area and the orange POC line.

#TOTAL3 #Analysis #Eddy#TOTAL3 #Analysis #Eddy
Crypto Total Market Cap Excluding BTC and ETH
Everything is clearly drawn and labeled.
For buy Long & Spot investment on altcoins, wait for the Total 3 index to reach its demand zone.
This is just my opinion and you should make your decision based on your style and strategy and get the necessary confirmations.
Be sure to take a look at this indicator on the monthly time frame.

Trading Week 15 Review 2025Hello fellow traders , my regular and new friends!
How was your trading this week?
Did you get a killing on the SNP, EURUSD etc?
This part will be on the review for this week.
Moving forward I will separate both the Trade review and Coming week trade analysis for easy viewing!
-- Get the right tools and an experienced Guide, you WILL navigate your way out of this "Dangerous Jungle"! --
*********************************************************************
Disclaimers:
The analysis shared through this channel are purely for educational and entertainment purposes only. They are by no means professional advice for individual/s to enter trades for investment or trading purposes.
*********************************************************************

DXY NEXT MOVE AND MARKET EFFECTThe US Dollar Index (DXY) is currently testing a major multi-year support zone around the 99.70–100.00 level. This level has held firm multiple times in the past, acting as a strong demand area during key macroeconomic cycles. Right now, price action is showing indecision with a clear do-or-die moment forming. If bulls defend this zone, we could witness a significant bullish reversal, potentially targeting the 103.00–105.00 range. However, a decisive break below this support could trigger a bearish wave toward the 96.00 handle or even lower.
Technically, this zone is not just psychological, but also a structural demand region, aligning with previous swing lows and price pivots. We’re seeing a potential for either a double bottom reversal or a breakdown structure forming, depending on how the market reacts in the coming sessions. Price is extremely oversold on higher timeframes, which could fuel a relief rally if momentum shifts. The reaction here will be key for broader market direction, especially as the dollar plays a pivotal role across forex majors.
Fundamentally, the DXY is under pressure as recent U.S. macro data reveals weakening momentum. March CPI printed hotter than expected, but other indicators like core PCE, NFP softness, and signs of slowing consumer demand are fueling expectations that the Fed may be nearing a policy pivot. At the same time, global risk sentiment is improving and yields have pulled back slightly, putting pressure on the greenback. However, rising geopolitical tensions and elevated oil prices continue to support USD as a safe-haven asset.
As a professional trader, this is a critical level to watch. I’m keeping an eye on price action confirmation for either a bullish engulfing setup or a clean break and retest of the 99.50 level. Both scenarios offer high-probability trades. Patience here is crucial — let the market reveal its hand, then align with the momentum. Dollar volatility is likely to remain elevated heading into next week, so managing risk with clarity is key.

Idea for Mon 14 Apr - Gold Short – Bear in a Bull OutfitOANDA:XAUUSD
Gold has been heavily influenced by recent developments in the trade war.
A 90-day pause on tariffs (excluding China) and the exemption of smartphones and computers from tariffs were announced on friday.
These headlines may temporarily calm markets and give stocks room to rise — which typically puts pressure on gold. If Dollar is rising again, could be a side effect too.
This could lead to a short-term pullback in gold prices.
A price gap was formed around $3175.51 during the opening session on Thursday, April 10th.
After a small bounce, i expect gold to move downward to fill that gap.
A potential support level is sitting near $3156, which could act as a bounce zone.
"Next week it’s a bear inside a bull outfit."
Despite a broader bullish structure, we could see the week start with a correction. A classic gap-fill setup for the short-term traders.
RSI and MacD are on top levels, but for how long?
-------------------------------------------------------------------------
This is just my personal market idea and not financial advice! 📢 Trading gold and other financial instruments carries risks – only invest what you can afford to lose. Always do your own analysis, use solid risk management, and trade responsibly.
Good luck and safe trading! 🚀📊

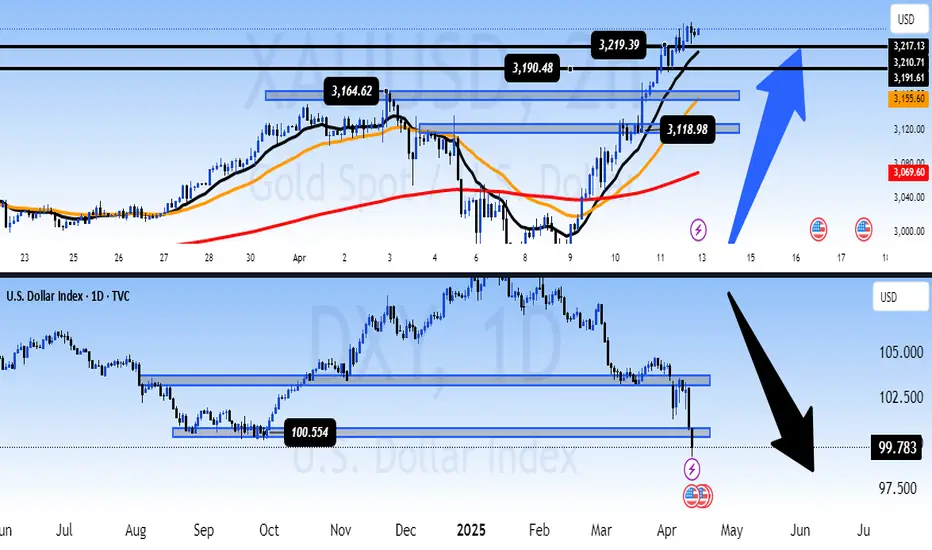
[XAU/USD & DXY] – Long-Term Outlook📌 – Long-Term Outlook: Is Gold Entering a New Bull Cycle as USD Weakens?
📊 Technical Analysis – Gold & DXY
The divergence between Gold and the U.S. Dollar Index (DXY) has become increasingly clear:
🔹 Gold (XAU/USD):
Price has broken the previous high at 3,190 and is now testing 3,219 – a fresh all-time high on the daily chart.
The MA13, MA34, and MA200 are showing a perfect “bullish fan” formation, indicating a sustainable uptrend rather than a short-term pump.
The key support zone around 3,164 – 3,118 remains critical for any healthy pullback.
🔻 U.S. Dollar Index (DXY):
Price has decisively broken below the psychological 100.55 support and is now hovering near 99.78.
If DXY fails to hold above 99.7, the next downside target could be 97.5 in the coming quarter.
The technical structure is clearly bearish, confirming USD weakness across the board.
→ This negative correlation aligns with macro expectations: a weaker dollar is fueling gold’s bullish momentum.
🌍 Fundamental Analysis – Macro Drivers
US PPI & CPI both come in lower than expected:
Inflation is showing clear signs of cooling.
Markets are now pricing in a possible rate cut as early as June.
Shift in Fed tone – from hawkish to neutral:
While not officially declared, recent Fed statements have been more dovish, supporting risk assets and weakening the dollar.
Strong safe-haven demand remains:
Geopolitical risks and economic uncertainty continue to push capital into gold, especially as USD enters a weakening phase.
🧭 Long-Term Perspective
Gold is potentially entering a new bull cycle. With consecutive ATH breakouts and favorable macro conditions (falling inflation, expected rate cuts, USD weakness), gold could push to even higher levels into Q2 and Q3.
The USD faces downside pressure in the coming months, especially if the Fed signals a firm pivot toward easing.
⚠️ Strategy Caution
Short-term corrections may occur, especially after such a sharp rise.
However, any pullbacks into key support zones could present strategic long opportunities for longer-term investors.
💬 What’s Your Take?
Is this the beginning of a major bull cycle in gold, or do you expect deeper pullbacks before continuation?
Drop your analysis and charts below! 👇👇👇
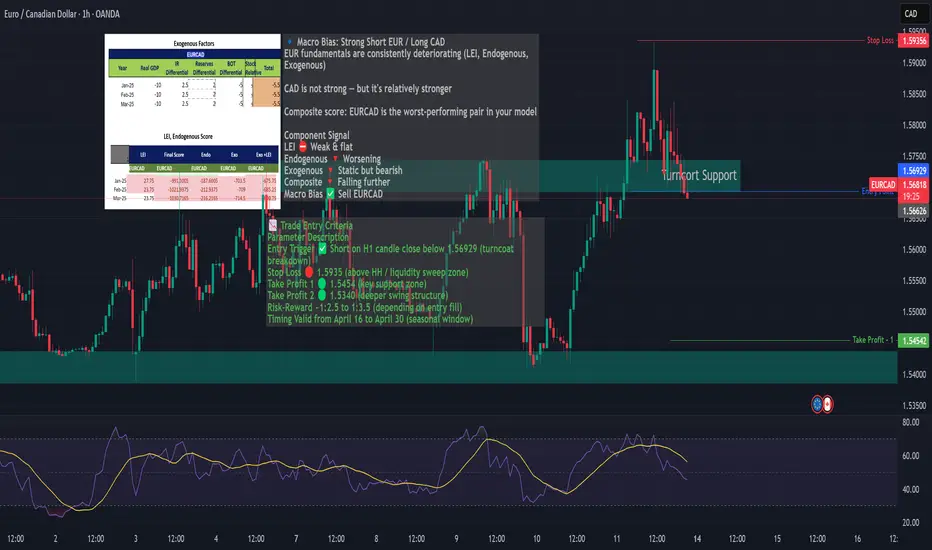
EURCAD Breakdown Watch–Bearish Divergence + Fundamental WeaknessEURCAD rallied into a key turncoat zone (former resistance → support)
Currently consolidating within this zone and showing clear RSI bearish divergence on both 1H and 4H timeframes.
Price is losing momentum while macro and seasonal factors align for a short bias.
🔍 Macro & Seasonality Confluence:
EUR Fundamentals: Worsening LEI, Endogenous & Exogenous scores
CAD Stability: Mildly bearish, but stronger than EUR
Seasonal Bias: EURCAD turns bearish after April 15
GOLD Explosive Bull Run or Setup for a Historic Short?📌 XAU/USD Outlook: Explosive Bull Run or Setup for a Historic Short? 💥📈
✨ Market Overview:
Gold (XAU/USD) has entered an exceptionally volatile phase, with price swings exceeding $100 per day. After dropping from 3,280 to 3,080, gold has roared back to a new all-time high at 3,200 in just two sessions — raising the critical question: Is this a true recovery wave, or merely a bull trap ahead of a potential historic short?
A surge of capital has flooded into financial markets, aggressively buying the dip across multiple asset classes. Investor psychology is now at the forefront, driving gold into extreme territory.
🌍 Fundamental Outlook:
Recent U.S. economic data came in weaker than expected, supporting the bullish momentum in gold. If history repeats itself, we could witness similar outcomes with the upcoming CPI and PPI releases — both of which are forecast to remain soft, potentially weakening the USD and further lifting gold.
Short-term: U.S. consumer demand appears weaker, pressuring USD.
Medium-to-long term: These weak data points may be laying the groundwork for a massive short on gold once the Fed initiates its expected rate cuts — potentially as early as June.
📊 Technical Outlook:
Gold’s price action is becoming increasingly difficult to predict. It took a full week for gold to fall $200 — but only two days to fully reclaim that ground and establish a new ATH.
Today, the market may continue this bullish surge, particularly if the PPI data surprises to the downside.
Key Support Levels:
3,200
3,188
3,174
3,157
3,130
3,120
Key Resistance Levels:
3,265
3,302
🧭 Trading Plan:
BUY Zone (High Probability):
Entry: 3,175 – 3,173
Stop Loss: 3,168
Take Profit: 3,180 | 3,184 | 3,188 | 3,192 | 3,196 | 3,200 | Open
SELL Zone (Aggressive Counter-Play)
Entry: 3,301 – 3,303
Stop Loss: 3,308
Take Profit: 3,296 | 3,292 | 3,288 | 3,284 | 3,280 | 3,270 | Open
⚠️ Risk Management Advisory:
Price action is extremely volatile — trade setups should be chosen carefully. Ensure proper stop-loss and take-profit are in place for every trade. Avoid emotional entries and respect risk-to-reward principles to protect your capital.
💡 Conclusion:
Gold is in a critical zone. With macro sentiment, news flow, and technicals all aligned, traders must stay alert. In the short term, the FOMO-driven rally looks likely to continue — but remain vigilant for signs of a reversal that could usher in a massive short wave.
🗨️ Share Your View:
Do you see gold continuing this bullish run — or is this the calm before a historic dump? Share your thoughts and strategies below! 💬👇

AUD/USD - Sellers remain in control!The AUD/USD pair has been in a clear and consistent downtrend on both the 4-hour and daily timeframes. Sellers have maintained firm control over price action, driving the pair lower while it continues to respect the prevailing bearish market structure. Each failed bullish attempt further validates the dominance of the bears, reinforcing the narrative that the path of least resistance remains to the downside.
Recently, however, the 4-hour chart witnessed a sharp move to the upside, tapping into and filling a previously unmitigated 4H Fair Value Gap (FVG). Despite this temporary rally, the broader structure remains bearish, with the market still printing lower highs and lower lows, a classic hallmark of a sustained downtrend. As such, the current momentum favors a continuation lower, potentially targeting the green imbalance/FVG zone on the 4H timeframe, which aligns with the next logical area of liquidity.
This green FVG also coincides with the golden pocket retracement zone (61.8%–65%), adding confluence and strengthening its validity as a potential support area. A reaction here could provide an opportunity for a short-term bullish correction or even the start of a larger reversal, depending on how price behaves around this level.
That said, a bullish scenario is not entirely off the table. Should price decisively break above the red FVG to the upside, and ideally close above it with conviction, it may signal a potential shift in market sentiment. This would be the first sign of buyers regaining control, suggesting a possible trend reversal or at least a deeper retracement toward higher time frame resistance zones.
Until such confirmation is seen, however, bearish momentum prevails. Traders can continue to favor short setups, with particular interest around premium zones on the 4H chart. Any bullish setups should be approached cautiously and ideally considered only at key areas of support like the green FVG, especially where it aligns with high-probability fib levels.
Thanks for your support.
- Make sure to follow me so you don't miss out on the next analysis!
- Drop a like and leave a comment!

Buy with 1% Risk ! Sure Shot This trade is Based on Advanced Smc and Ict Concepts !
RR 1:6
Used Money Management

Fundamental Market Analysis for April 11, 2025 EURUSDEUR/USD hit its highest levels in nearly two years on Thursday, breaking through and closing above 1.1200 for the first time in 21 months. Market tensions continue to ease after the Trump administration dropped its own tariffs at the last minute, causing a general weakening in US Dollar flows.
US consumer price index (CPI) inflation fell significantly short of forecasts in March. The core CPI fell to 2.8 per cent year-on-year, a four-year low after nearly eight months above 3.0 per cent. Core CPI inflation also fell to 2.4 per cent year-on-year. Investment markets will face a major challenge if the tariffs reverse the Federal Reserve's (Fed) multi-year efforts to curb inflation.
On Friday, the week will conclude with the release of the University of Michigan (UoM) Consumer Sentiment Index survey. The University of Michigan's consumer sentiment index is expected to decline again in April as consumers feel the pressure of the Trump administration's tariff and trade policies, and is likely to fall to a near three-year low of 54.5. In addition, expected consumer inflation data will be released on Friday, with UoM's 1-year and 5-year expected consumer inflation previously standing at 5% and 4.1% respectively.
Trade recommendation: SELL 1.1305, SL 1.1380, TP 1.1150

USD/JPY(20250411)Today's AnalysisMarket news:
The annual rate of the US CPI in March was 2.4%, a six-month low, lower than the market expectation of 2.6%. The market almost fully priced in the Fed's interest rate cut in June. Trump said inflation has fallen.
Technical analysis:
Today's long-short boundary:
145.38
Support and resistance levels:
149.05
147.68
146.79
143.97
143.08
141.71
Trading strategy:
If the price breaks through 145.38, consider buying, the first target price is 146.79
If the price breaks through 143.97, consider selling, the first target price is 143.08

GBP/JPY Triangle Breakout (11.04.2025)The GBP/JPY Pair on the M30 timeframe presents a Potential Selling Opportunity due to a recent Formation of a Triangle Breakout Pattern. This suggests a shift in momentum towards the downside in the coming hours.
Possible Short Trade:
Entry: Consider Entering A Short Position around Trendline Of The Pattern.
Target Levels:
1st Support – 184.40
2nd Support – 182.60
🎁 Please hit the like button and
🎁 Leave a comment to support for My Post !
Your likes and comments are incredibly motivating and will encourage me to share more analysis with you.
Best Regards, KABHI_TA_TRADING
Thank you.

AUDUSD Long – Fair Value Gap + Macro Confluence + Bullish LEI AUDUSD Swing Long Setup – Technical + Macro Confluence
✅ Bias: Long AUD/SD
Based on a multi-factor thesis:
Macro: RBA steady; AUD LEI rising steadily (87 → 96), Endogenous improving
USD Weakness: Fed dovish + GDP downgraded = downside pressure
Seasonality: USD historically weak entire April

Pre-Market Analysis – CAD/CHF1️⃣ The price has broken below the previous support zone, which had held multiple times in the past. This area is now likely to act as a new resistance.
2️⃣ The bottom boundary of the descending channel has been touched, signaling a potential reaction or short-term bounce from this level.
3️⃣ It’s quite probable that the price retraces back to the midline of the channel before continuing its downward move. This would be a classic pullback within a bearish channel structure.
📉 If price fails to reclaim the broken support and reacts bearishly near the resistance-turned zone or the channel’s midline, it could provide a solid continuation setup to the downside.

ETH — Still Lagging Behind. Two Levels That MatterETH continues to underperform the market — and it's not just about Ethereum. Most alts showed weakness after yesterday’s front-running impulse ended in today’s fade-out.
Let’s see how they behave on BTC’s next leg up.
As for ETH — only two levels matter for now:
1689 to the upside, and 1485.7 to the downside.
I’ll take action only after a confirmed breakout and hold above or below one of these zones. Until then — just observing.

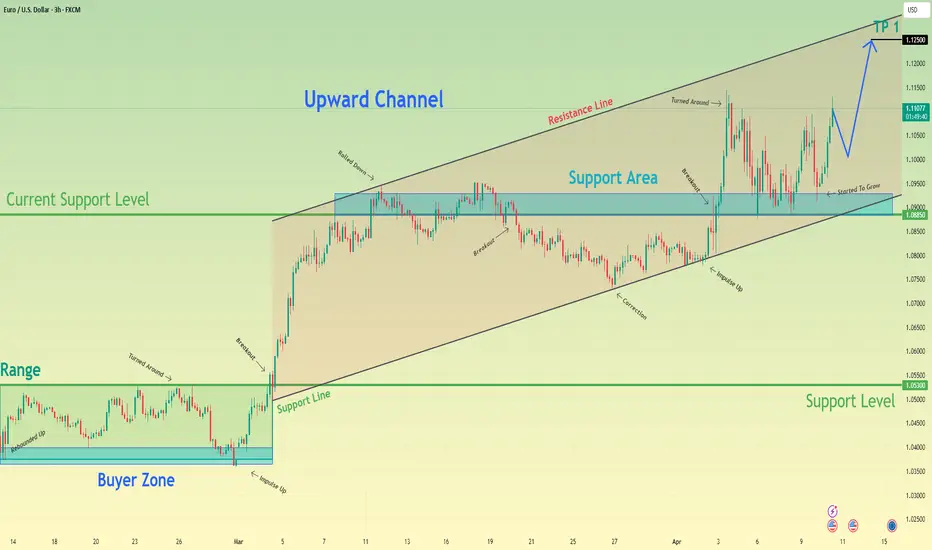
Euro may continue to move up inside upward channelHello traders, I want share with you my opinion about Euro. We can see how the pair spent a long time inside a wide range, repeatedly testing the buyer zone between 1.0365 - 1.0400 points. After multiple rebounds and false breakouts, Euro finally broke through the resistance and started forming a strong upward channel. The bullish structure was further confirmed when the price respected the support line of the channel and created a new higher low near 1.0885, which now acts as the current support level. This level also coincides with the bottom of the seller zone, which was recently flipped into support. Price reacted with a sharp impulse up, breaking the consolidation range and confirming continued bullish pressure. Now Euro is approaching the middle of the channel and gaining strength again. I expect the pair to make a slight pull-back to the support area, followed by a continuation of the upward trend toward TP1 - 1.1250 points, which aligns with the upper boundary of the channel. As long as EUR remains above 1.0885 points and respects the bullish structure, I’m looking for another leg higher. The chart structure supports the bullish case, and the upward momentum is clearly in play. Please share this idea with your friends and click Boost 🚀
NZDUSD Long Setup – FVG + Order Block + Macro Bullish BiasI'm looking to go long on NZDUSD based on a strong confluence of fundamentals, seasonal trends, and technical structure.
🔹 Macro bias: USD weakening as Fed leans dovish, while NZD is gaining momentum from rate cuts and improving LEI.
🔹 Seasonality: Historically, NZD shows strength in the first half of April, while USD tends to weaken mid-to-late April.
🔹 Technical setup:
Price left a Fair Value Gap (FVG) on the 4H chart
Pullback into a bullish Order Block (OB)
Entry within imbalance

XAU/USD Outlook: Gold's Bullish Momentum Strengthens 📌 XAU/USD Analysis: Gold on a Strong Bullish Momentum Amid Economic Optimism 📈💰
✨ Overview:
Gold (XAU/USD) is currently demonstrating significant bullish momentum, driven by improved global economic sentiment. The recent 90-day tariff suspension among major global economies and hints from the recent FOMC meeting about potential rate cuts later this year are fueling investor optimism.
📊 Technical Analysis:
🔹 Key Resistance Levels:
3,146
3,162
3,168
🔸 Key Support Levels:
3,096
3,078
3,066
3,052
📈 Moving Averages Analysis:
MA 13 (Short-term): Clearly supports bullish momentum, offering buy signals as price sustains above this MA.
MA 34 (Medium-term): Supporting bullish sentiment with prices comfortably above.
MA 200 (Long-term): Reinforces the robust long-term bullish outlook with price consistently trading above this level.
🚀 Trading Strategy & Recommendations:
BUY Strategy (Preferred Scenario):
Entry Zone: 3,094 – 3,096
Stop Loss: 3,090
Take Profit Levels: 3,100 | 3,104 | 3,108 | 3,112 | 3,116 | 3,120
SELL Strategy (Cautious Approach):
Entry Zone: 3,164 – 3,166
Stop Loss: 3,170
Take Profit Levels: 3,160 | 3,156 | 3,152 | 3,148 | 3,144 | 3,140
🌍 Fundamental Context:
Positive Market Sentiment: The global economic outlook has turned favorable due to tariff suspensions and strong performance in equity markets.
Interest Rate Outlook: Recent signals from the FOMC regarding possible interest rate cuts are providing further support for gold’s upward trajectory.
⚠️ Risk Management:
Emphasize caution when engaging in short positions, given the prevailing bullish conditions.
Always implement strict stop-loss measures and maintain risk-to-reward ratios of at least 1:2.
Avoid over-leverage and ensure trades are sized appropriately.
💡 Conclusion & Final Thoughts:
Gold remains strongly bullish, backed by both technical indicators and a positive fundamental backdrop. Traders are encouraged to focus primarily on buy opportunities near significant support levels and remain alert to potential trend reversals at key resistance zones.
🗨️ Engage with Us:
What are your current strategies for gold? Share your insights and views in the comments section below! 💬👇

Fundamental Market Analysis for April 10, 2025 USDJPYThe Japanese yen (JPY) showed strength during the Asian trading session on Thursday, reacting to the release of producer price index (PPI) data that exceeded market expectations. This macroeconomic signal reinforced speculation about possible further monetary policy tightening by the Bank of Japan (BoJ), keeping the probability of an interest rate hike in the future. Additional support for the yen was provided by positive expectations of a potential trade agreement between Japan and the United States.
Amid the weakening of the US dollar (USD), the USD/JPY pair showed a pullback and fell below the psychologically important level of 147.000, which was also supported by a limited correction of the US currency amid a general recovery in market confidence.
The divergence in monetary expectations between the Bank of Japan and the Federal Reserve remains significant. While Japan is increasingly likely to tighten monetary policy, markets in the US are pricing in a scenario of multiple cuts in the Fed's key interest rate in 2025. This discrepancy has prevented the US dollar from maintaining momentum after an overnight recovery from a weekly low, prompting a reallocation of capital in favor of the more stable yen despite its status as a low-yielding currency.
Improved global risk sentiment, driven by US President Donald Trump's announcement of a temporary suspension of retaliatory tariffs against key trading partners, may also help strengthen the yen as a safe haven asset, especially amid continued uncertainty in international markets.
Trade recommendation: SELL 146.800, SL 147.400, TP 145.400

USD/JPY(20250410)Today's AnalysisToday's buying and selling boundaries:
146.66
Support and resistance levels:
150.90
149.32
148.29
145.03
144.01
142.42
Trading strategy:
If the price breaks through 148.29, consider buying, the first target price is 149.32
If the price breaks through 146.66, consider selling, the first target price is 145.03

S&P - What will happen next for the S&P?The S&P 500 has been dropping quickly after Trump's tariff policies were announced. It fell from 5750 to 4900, and is now at 5053, all in just a few days. This is a sharp decline, and sellers are clearly in control right now.
However, after such a big drop, it's common to see a short-term bounce before the market continues to fall. There is strong resistance between 5400 and 5500, which lines up with the golden pocket (a key level in technical analysis). This could make it harder for the S&P to rise past these levels.
Looking further down, there is another strong support area between 4500 and 4600. This level also matches the golden pocket on the daily chart, making it an important point for potential support. If the market keeps falling, we could see this area tested before any significant recovery.
Right now, it seems likely that the market will keep going lower. My main expectation is that we’ll get a small rally first, which could trick some traders into thinking the market is recovering, before continuing down. However, with all the uncertainty around the news and policies right now, it's also possible the market could keep dropping sharply without much of a rally.
Keep a close eye on the markets and stick to good risk management practices. If you don’t, it could really hurt your portfolio. Stay alert and adjust your strategy as things change.
Thanks for your support.
- Make sure to follow me so you don't miss out on the next analysis!
- Drop a like and leave a comment!
