AND

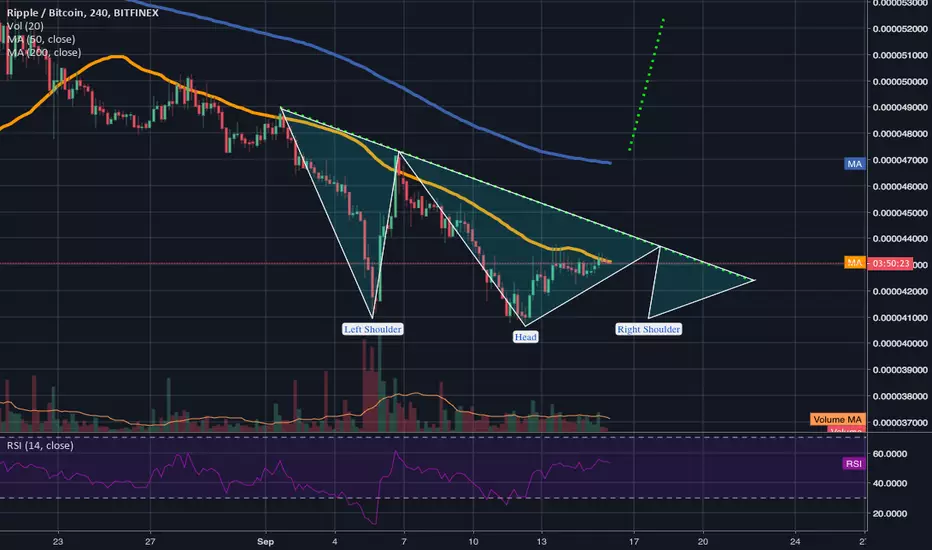
XRP 4hr cup and handle pattern overlapping 1day bull pennantShow here is the 1 day chart bull pennant. I will post the 4hr chart below this to get a better look at the cup and handle. The top trendline of the bull pennant is overlapping with the rimline of the cup and handle pattern...which is currently causing double reinforced resistance...I believe however by the apex of this 1 day bull pennant(next 1 day candle) that we will be able to flip that resistance to double reinforced support and continue our breakout upward. We should know by the next 1 day candle....of course always wise to be prepared for the exact opposite outcome as well.

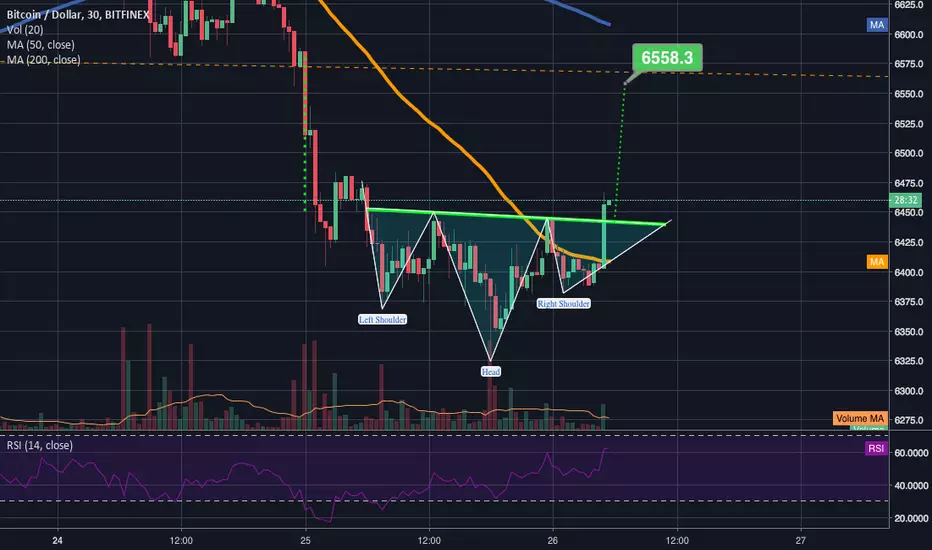
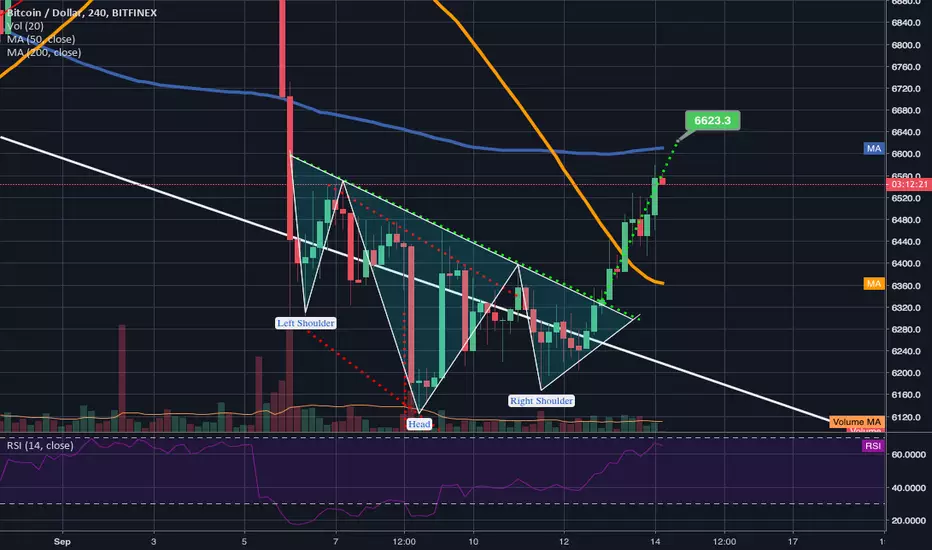
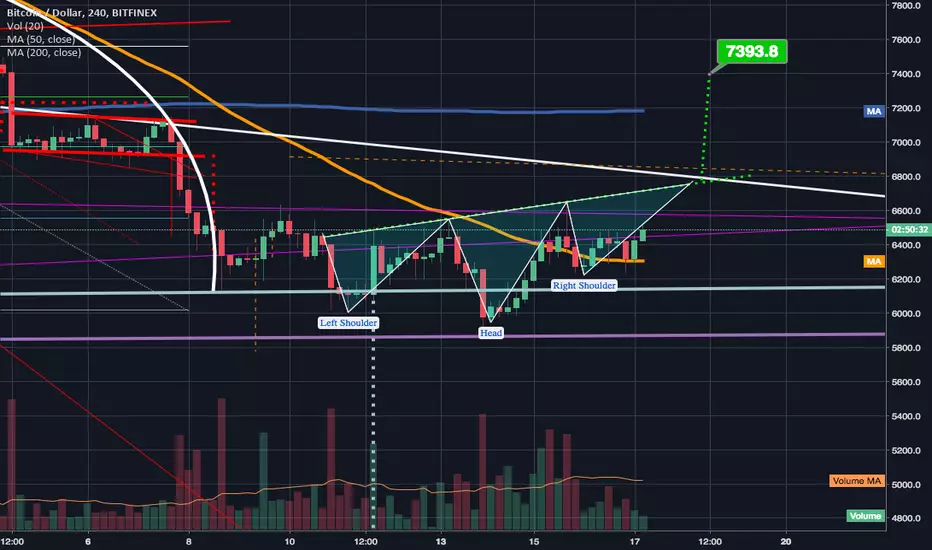
After triggering a 30min inv h&s BTC now forming a normal h&sso far it has completed a left shoulder and a head keep an eye on it to form a right shoulder. If so I will switch from neutral to short if I see it break the necklien and confirm....but only short for a little while considering 30minute head aand shoulders don't typically drop too far.

triggering the 30min chart inv h&s can take us to $6560Looking like it may confirm the break but as always we need confirmation candles to confirm the breakout and with a 30minute chart it may take more than one...looking optimistic so far though.
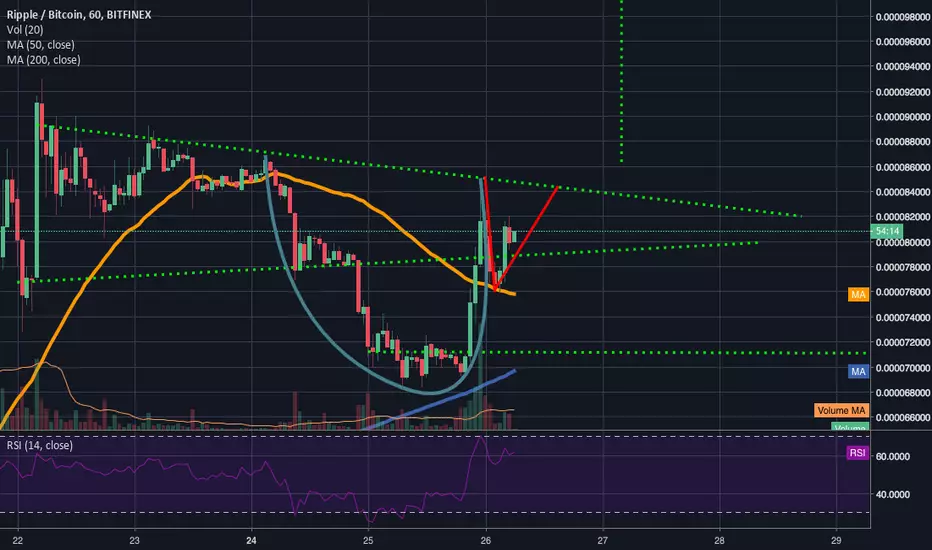
Potential Cup & Handle forming on XRP A Pattern worth keeping an eye on...price action is currently heading back towards the neckline.
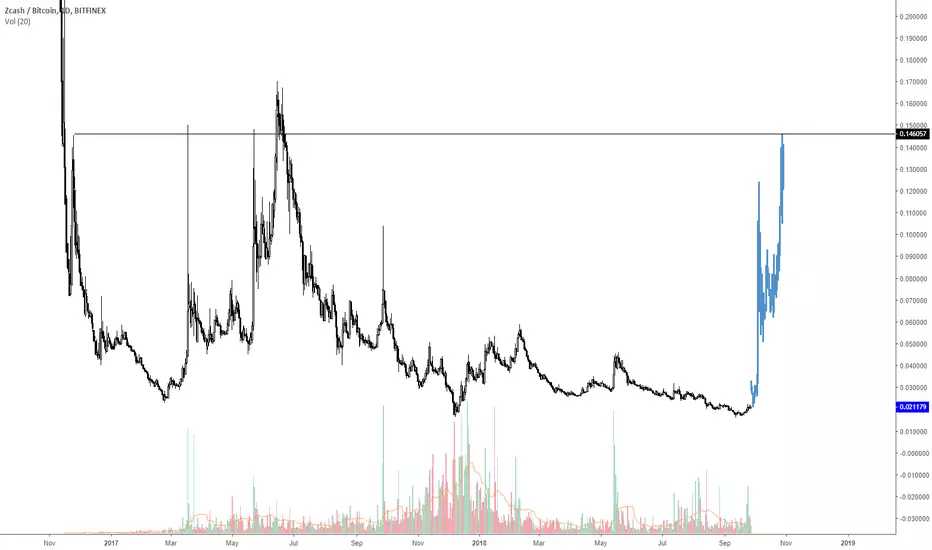
ZCash primed to complete right shoulder of potential invrted h&sZCash is one of my long holds so regardless of whether or not this inv h&s pattern breaks I will be holding. I'm pretty confident it will at least be testing the neckline soon and likely breaking upward. If it does break upward I have the price target posted here in green.


SP1! Still a Buy Dips Market - Long and Strong
S&P 500 Update SP1! Chart 12:36 Bst 07:36 Est 22nd September
The S&P has given back 8 or so points from the high reached
at 2945.
ideally it will come back to 2935 around the open and bounce
again from there to give another entry point.
This still looks positive whilst it holds at 2935 and above.
S&P 500 Update SP1! Chart 10:10 Bst 05:10 Est September 22nd
The S&P has continued its rally overnight and is now probing
the next (still sketchy) resistance level at 2945.
Still difficult to identify a stop level under this long shot as
there's still been no consolidation overnight.
Can either close out and take the 27 points profit from 2918
long or raise the stop to 2930 and let it run some more.
If you choose to close out the long rather than hang on to a
notional stop be ready to follow long again from lower down
towards 2930 if we see it later - otherwise be ready to follow
long again on a break above 2945 with stops 2 points lower
looking for a test of the upper parallel at around 2964 as the
next likely point of resistance above 2945, (amended).
Resistance potential: 2945, 2964/upper parallel, 3005, 3209.
18:32 Bst 13:32 est September 21st
A stellar day for the major markets has seen the S&P blast higher
all day - amazing if there's no profit taking towards the close.
Even if there is am staying long towards 2946 as we should
have a good day tomorrow - at least to begin with before
boiling over.
Some may prefer to close out because the stop has to stay
under the 2916 line otherwise as there's been no correction so
far to be able to raise the stop through the day.
This break is good and signals further upside to around 2945
initially. But has more in it to 3005 and then 3209 before the
year is out.
This is obviously best guess from here - we're in deep
uncharted waters - but this break looks good for the medium term.
13:06 Bst 08:06 Est September 21th
Long story short it's still a buy dips market - it was OK to get
long again once the 2913 line was broken to the upside a little
earlier today but the stop has to stay under 2910 for now if
so. Otherwise take profits at 2919 but be ready get long again
once 2920 is broken above.
If flat it's OK to wait for the next signal from here which looks
like a break above 2920 looking for 2946.


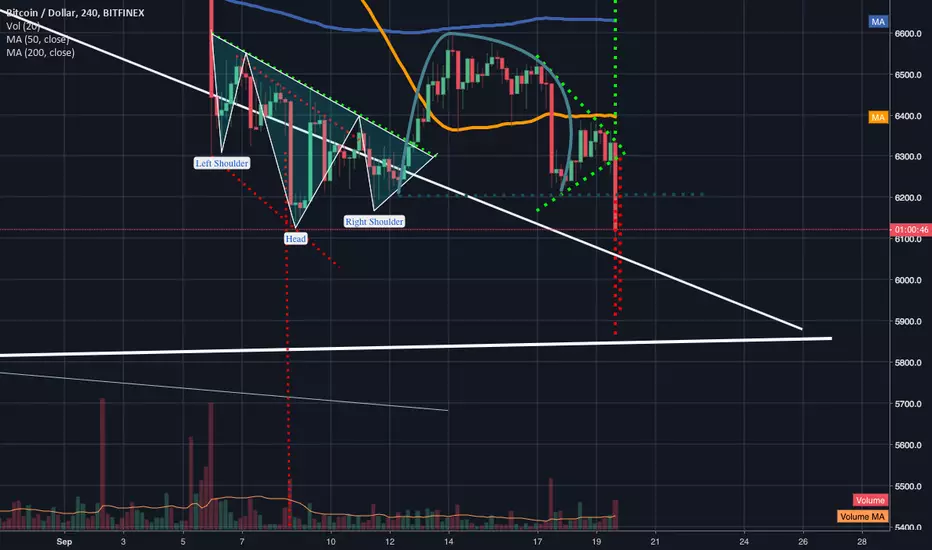
Inverted cup and handle spotted priceaction testing necklineIn dark turquoise here I ahve drawn an inverted cup and handle pattern...the price action has sent a wick to the neckline...should we not climb back into the symmetrical triangle by the time this candle closes probability is very high that we could trigger this cup and handle pattern...if so the target drop would be down to the bottom trendline of the weekly descending triangle pattern...I think we could see nice support there around 5845 or so. This may of course though be a bear trap and we still have time to climb back into the symmetrical triangle pattern before the candle closes...try to be prepared for both outcomes.
possible inverted h&s on XRPJust a thought not listing this as long because even though I am long on XRP the idea itself is not one I currently have a high degree in confidence for and simply just a possibility to consider especially since BTC recently triggered and inverted h&s pattern. *Not Financial Advice*
Inv H&S Breakout confirmed but may not surpass 100maTHe projected breakout is posted here just under 6.7k. At first that seemed like it would clearly allow it to surpass both the 4hr 50ma(in orange) and 100ma(in blue). However the way the 100ma is now starting to tilt upwards could prove to allow it to maintain resistance and get above the projected target price before the price action reaches it....the 4hr death cross is now solidly in effect and would tak a lot more bullish action to reverse. It's possible but until I see the price action surpass the 100ma and both flip the 100ma from resistance to support and solidify that support...than I have to anticipate that the 100ma will provide some solid resistance especially now that the 4hr rsi is nearing oversold levels. Of course still very possible we can get more bullish action to come. For now I'm still neutral but right when the inv head and shoulders was confirmed I was long to the projected target.
4hr death cross occurred + inv h&s still valid= wait 4 the breakThe 4hr death cross has occurred, however priceaction still hasn't chosen a direction. The inverted head an shoulders is still very much valid. Gonna have to wait for a clear break one way or the other and hodl int he meantime or if you sold sodl. If it continues to simply ove sideways all month somehow then we may very well be experiencing the purgatory phase that occurs right before the follow up bull run. For now, Neutral.

Can a potential invrted h&s breakout prevent the 4hr deathcross?Still neutral here as BTC gets ready to amke a decision. A breakout of this inverted head and shoulder pattern could send the price action up to $6725 and be enough to potentially help the 4hr 50ma (in orange) bounce upward off the 200 ma (in blue). Let's hope we go up from here. *not financial advice*

EURUSD - Long (Head and shoulder pattern completed)Price has completed a head and shoulder pattern and is currently retesting break line. Looking for a signal to buy to 1.173.
For further confirmation, wait until price breaks daily resistance line and then place order.

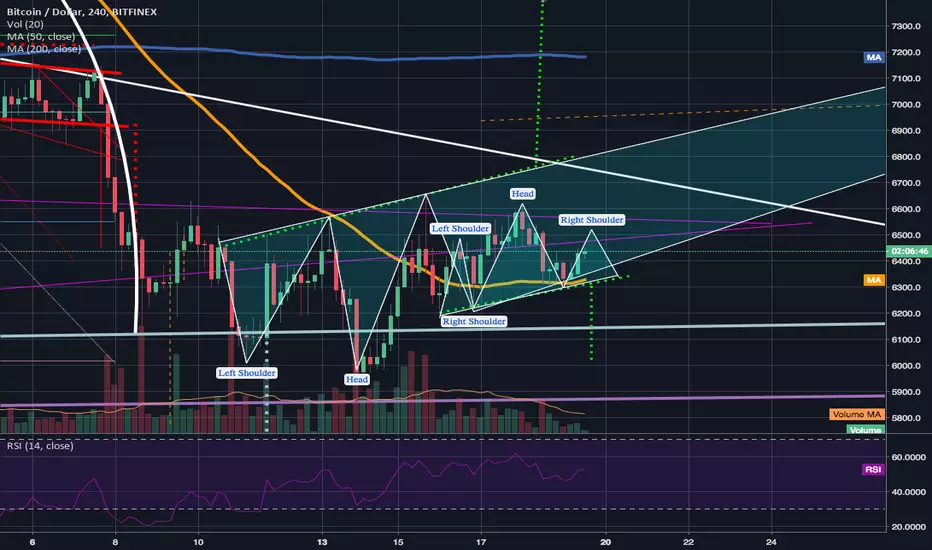
Right shoulder of inverted h&s forming smaller h&s patternNot sure which way this will break but its very important to be aware of the current smaller head and shoulder forming inside the right shoulder of the inverted head and shoulder pattern...the drop target for the this smaller h&s pattern is not enough to invalidate the inverted h&s but there is always a chance for it to fall well past the drop target. Definitely something to keep an eye on. The RSI + stochrsi on the daily, 4hr, and hourly should help give us some indication of which way is more likely. As well as any bullish or bearish divergences.
4 hour chart inverted cup and handle on ETCIm an ameture trader to a 't' although i belive that what im looking at could be an inverted cup and handle bullish on the release. Any ideas comments concerns appreciated.

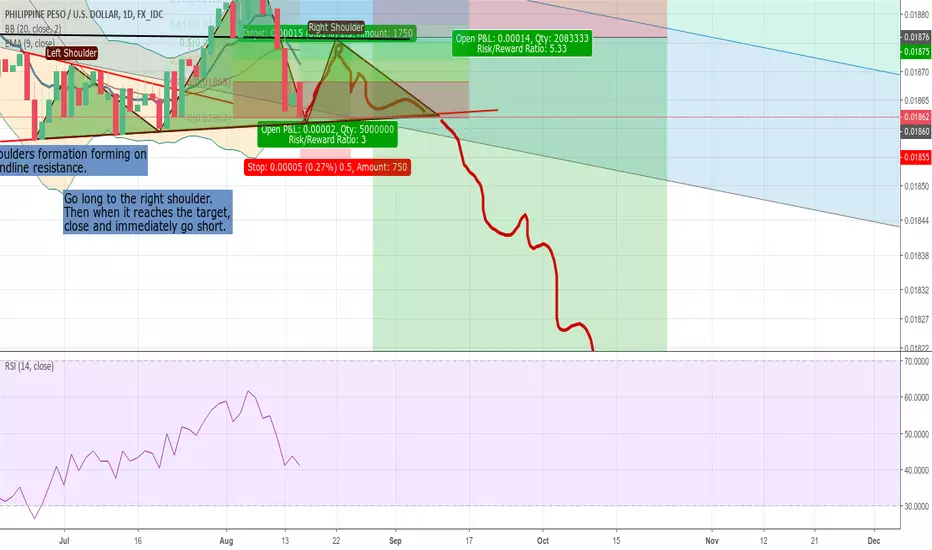
PHP downtrend continuation. Great R:R.The Peso continues to decline this month. Since the 10% crash from January to February, the long term trend is in a downwards channel. However I believe that it will once again break below the channel and continue to fall. (Click and drag on the price axis to move the chart).
Looking at more short term profits:
A Head and Shoulders pattern is forming on the daily chat. This is normally a reversal pattern and not a continuation, however I believe that a 50% retracement of the "head" will still act as resistance, as it has in previous red daily candles. See the black horizontal minor resistance level from the past month as this also lines up.
Normally the target of this H&S would be a 1:1 extension of the head to the neckline, however because it will be breaking this important channel, there is no resistance there to hold it so expect a drop fast. Possible resistance level is the black line on the chart.
The RSI is not near the oversold level, so still has further to fall.
Downsides:
-There have not been any noticeable H&S formations on this pairing in the past.
-H&S normally signifies a reversal rather than continuation.
-The resistance in the channel may be enough to push it back up as this "H&S" is not yet so big. If this fails then look for a short opportunity after a larger structure.
Good luck trading.
Potential Inverted Head & Shoulder Pattern on 4hr chartAfter seeing a nice fakeout on the daily of the inverted cup and handle pattern we are now seeing the 4hr chart form both a higher high and at least for now what appears like it will be a follow up higher low...if so the odds are favorable of following that up with another higher high and in doing so very likely we could trigger this currently developing inverted head and shoulder pattern. Though the 4hr chart is looking bullish we must still keep in mind that on the 1 day chart we have a giant bear flag and an inverted c up and handle to tend with...one of these 2 paths will be chosen either the bullish 4hr chart scenario will p;ay out or the bearish 1 day chart scenario. So be ready for either this idea for these reasons will be listed as neutral.
Technical and Fundamental Analysis of GBPUSD.On the daily chart, the 200EMA shows me where the long term trend will be for the currency, the EMA showed that price was below the EMA which indicates that the trend is bearish.I can also see a breakout on the price resistance line(1.26978) so it could show that the price will continue to go down.I switched to the 4 hour to see if the Ichimoku signals show bearish signals, there is bearish cross with Kijun Sen is in top of the Tenken sen which shows price is bearish. Price is also below the pink cloud which shows signal for the that the trend is bearish. Also the Chikou space shows that the line is below price which gives e the confirmation that the trade is more likely to go bearish. The fundamental news was on the GBP and it was the U.K. Average Earnings Index +Bonus is the measure of the change in the price businesses and the government pay for labour, including bonuses. The Average Earnings figure gives us a good indication of personal income growth during the given month, but also potential inflationary pressures. The U.K. Claimant Count Change is the measure change in the number of unemployed people receiving unemployment benefits in the U.K. during the reported month. A rising trend indicates weakness in the labour market.. as both of the readings were lower than previous, the Average Earnings Index +Bonus previous was 2.5% and the actual was 2.4%, the U.K. Claimant Count Change previous was 9.0K and the actual forecast was 6.2K .it means that price will do be in a bearish forecast. I would go short on this major pair.

GBP/AUD Broken Head and Shoulders - EntryHead and shoulders pattern on the daily chart. Now currently pulling back. Awaiting break of trendline on H1 chart to enter. Possible 1000 pip plus move to be had over the next couple of months (hopefully).

Inverted Cup & Handle Fakeout confirmed?As I said in the last 2 ideas wait for confirmation from the volume in this situation. I also said that with both the 4hr and 1 day charts rsi levels right near the oversold zone it would be very difficult for price action to sustain triggering an inverted cup and handle. Right now we are seeing lots of volume. and a big green candle spike...Odds are very good that we will be breaking upward from here but always be prepared for a fakeout even at this level. So far so good...need to keep a close eye on the close of this 4 hr candle as well as the next one to eb sure we will sustain this pump.
