#ARB Can Long Soon#ARB
The price is moving within a descending channel on the 1-hour frame and is expected to break and continue upward.
We have a trend to stabilize above the 100 moving average once again.
We have a downtrend on the RSI indicator that supports the upward move with a breakout.
We have a support area at the lower boundary of the channel at 0.3190, acting as strong support from which the price can rebound.
We have a major support area in green that pushed the price upward at 0.3180.
Entry price: 0.3200
First target: 0.3297
Second target: 0.3393
Third target: 0.3513
To manage risk, don't forget stop loss and capital management.
When you reach the first target, save some profits and then change your stop order to an entry order.
For inquiries, please comment.
Thank you.
Arbitrage

#ARB/USDT Ready for a Major Breakout!#ARB
The price is moving within a descending channel on the 1-hour frame, adhering well to it, and is heading for a strong breakout and retest.
We are seeing a bounce from the lower boundary of the descending channel. This support is at 0.3500.
We have a downtrend on the RSI indicator that is about to be broken and retested, supporting the upside.
There is a major support area in green at 0.3050, which represents a strong basis for the upside.
Don't forget a simple thing: ease and capital.
When you reach the first target, save some money and then change your stop-loss order to an entry order.
For inquiries, please leave a comment.
We are looking to hold above the 100 Moving Average.
Entry price: 0.3640
First target: 0.3828
Second target: 0.4009
Third target: 0.4229
Don't forget a simple thing: ease and capital.
When you reach your first target, save some money and then change your stop-loss order to an entry order.
For inquiries, please leave a comment.
Thank you.

#ARB/USDT#ARB
The price is moving within a descending channel on the 1-hour frame and is expected to break and continue upward.
We have a trend to stabilize above the 100 moving average once again.
We have a downtrend on the RSI indicator, which supports the upward move by breaking it upward.
We have a support area at the lower limit of the channel at 0.3382, acting as strong support from which the price can rebound.
Entry price: 0.3408
First target: 0.3466
Second target: 0.3523
Third target: 0.3596

#ARB/USDT#ARB
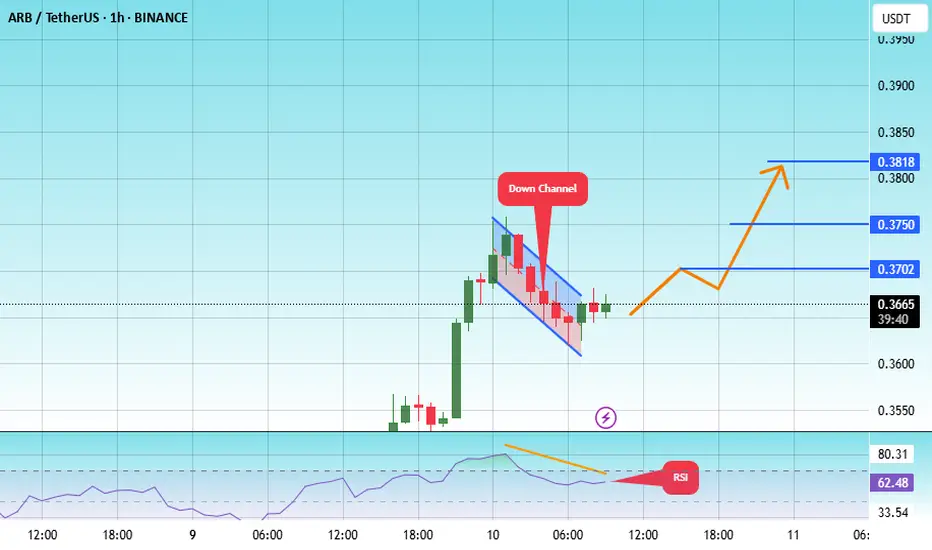
The price is moving within a descending channel on the 1-hour frame, adhering well to it, and is heading towards a strong breakout and retest.
We are experiencing a rebound from the lower boundary of the descending channel. This support is at 0.3620.
We are experiencing a downtrend on the RSI indicator, which is about to break and retest, supporting the upward trend.
We are heading towards stability above the 100 moving average.
Entry price: 0.3667
First target: 0.3700
Second target: 0.3750
Third target: 0.3820
#ARB/USDT#ARB
The price is moving within a descending channel on the 1-hour frame and is expected to break and continue upward.
We have a trend to stabilize above the 100 moving average once again.
We have a downtrend on the RSI indicator, which supports the upward move by breaking it upward.
We have a support area at the lower limit of the channel at 0.3210, acting as strong support from which the price can rebound.
Entry price: 0.3250
First target: 0.3406
Second target: 0.3510
Third target: 0.3667

#ARB/USDT#ARB
The price is moving within a descending channel on the 1-hour frame and is expected to break and continue upward.
We have a trend to stabilize above the 100 moving average once again.
We have a downtrend on the RSI indicator, which supports the upward move by breaking it upward.
We have a support area at the lower limit of the channel at 0.4033, acting as strong support from which the price can rebound.
Entry price: 0.4120
First target: 0.4229
Second target: 0.4373
Third target: 0.4540

#ARB/USDT#ARB
The price is moving within a descending channel on the 1-hour frame, adhering well to it, and is heading for a strong breakout and retest.
We are experiencing a rebound from the lower boundary of the descending channel, which is support at 4050.
We are experiencing a downtrend on the RSI indicator, which is about to be broken and retested, supporting the upward trend.
We are looking for stability above the 100 Moving Average.
Entry price: 0.4436
First target: 0.4700
Second target: 0.4994
Third target: 0.5367

#ARB/USDT#ARB
The price is moving in a descending channel on the 1-hour frame and is adhering to it well and is heading to break it strongly upwards and retest it
We have a rebound from the lower limit of the descending channel, this support is at a price of 0.3640
We have a downtrend on the RSI indicator that is about to be broken and retested, which supports the rise
We have a trend to stabilize above the moving average 100
Entry price 0.3730
First target 0.3890
Second target 0.4047
Third target 0.4266

#ARB/USDT Ready to launch upwards#ARB
The price is moving in a descending channel on the 1-hour frame and is adhering to it well and is heading to break it strongly upwards
We have a bounce from the lower limit of the descending channel, this support is at a price of 0.5960
We have a downtrend on the RSI indicator that is about to be broken, which supports the rise
We have a trend to stabilize above the moving average 100
Entry price 0.6220
First target 0.6567
Second target 0.6890
Third target 0.7262

OCS arbitrageOCS arbitrage between icelandic and US market. This is a risk free trade given a couple of things.

Sprott Physical Copper Trust (symbol, COP.UN) traded in Canada COP.UN is showing a big discount of about 20% against NAV
So a buy set up in COP.UN around current levels of about CAD 9,65 could show some nice profits
in the coming months when the discount will probably getting smaller.
Potential upside 20%
Long positions in COP.UN can be hedged by going short CPER (Copper ETF) in the US market to hedge against price drops in COP.UN

#ARB/USDT#ARB
The price is moving in a descending channel on a 30-minute frame and is expected to continue upwards
We have a trend to stabilize above the moving average 100 again
We have a descending trend on the RSI indicator that supports the rise by breaking it upwards
We have a support area at the lower limit of the channel at a price of 0.9861
Entry price 0.9861
First target 1.024
Second target 1.0
Third target 1.10

#ARB/USDT Ready to go higher#ARB
The price is moving in a descending channel on the 1-hour frame and sticking to it well
We have a bounce from the lower limit of the descending channel, this support is at 1.07
We have a downtrend on the RSI indicator that is about to break, which supports the rise
We have a trend to stabilize above the 100 moving average
Entry price 1.07
First target 1.13
Second target 1.17
Third target 1.23

#ARB/USDT Ready to go up#ARB
The price is moving in a descending channel on the 30-minute frame and sticking to it well
We have a bounce from the lower limit of the descending channel, this support is at 0.8400
We have a downtrend on the RSI indicator that is about to be broken, which supports the rise
We have a trend to stabilize above the moving average 100
Entry price 0.8684
First target 0.8922
Second target 0.9288
Third target 0.9647

HES CVX M&A ArbitrageCVX & HES are expected to complete a merger on 6/30/25. CVX will pay every holder of HES stock 1.025 shares of CVX per share of HES. This is represented by the spread. Spread has been widening since announcement date, and would be interesting to make a play on. FTC seems to be interested in having a say in the merger.
NYSE:CVX *1.025-NYSE:HES

#ARB/USDT#ARB
The price is moving in a descending channel on the 1-hour frame upwards and is expected to continue.
We have a trend to stabilize above the moving average 100 again.
We have a downtrend on the RSI indicator that supports the rise by breaking it upwards.
We have a support area at the lower limit of the channel at a price of
0.5700.
Entry price 0.5290.
First target 0.6113.
Second target 0.6346.
Third target 0.6583.

MSTU Oct 2024 -- an 8X+ BTC surrogate MSTU provides 2X on MSTR which invented the BTC-on-balance-sheet strategy.
MSTR has been providing approx > 4X on Bitcoin movements (up and down).
This means MSTU is providing > 8% X on BTC by % movements.
Today, 10/24/24, when BTC went up 1.93% MSTU went up approx 21%
Long Call options on MSTU further amplify this multiplier effect.
Not financial advice, Do your own research, Get in and out at the right times,
Your money; your decisions.

#ARB/USDT#ARB
The price is moving in a descending channel on the 4-hour frame
And it is sticking to it well
We have a bounce from the lower limit of the descending channel and we are now touching this support at a price of 0.5170
We have a downtrend on the RSI indicator that is about to be broken, which supports the rise
We have a trend to stabilize above the moving average 100
Entry price 0.5390
First target 0.5642
Second target 0.5912
Third target 0.6240

Spike in the Bitcoin price in the near futureI have noticed that there is a big discrepancy between the price of Bitcoin and MSTR.
I haven't checked how the trading volumes compare, but my guess is that this arbitrage should have a noticable impact on increasing the Bitcoin price, until the prices of MSTR and Bitcoin find each other in the middle.
The "Middle" is dependent on the price discrepancy and total volume discrepancy.

Why is MSTR at an ATH while Bitcoin is dumping at 60k? Something doesn't make sense here.
Either people closer to the stocks know something about Bitcoin that we don't, or the market became extremely inefficient and there is a great opportunity for arbitrage.
I am not sure how to execute this yet, maybe I leave something in the comments.

e-Learning with the TradingMasteryHub - Sentiment Analysis**🚀 Welcome to the TradingMasteryHub Education Series! 📚**
Are you looking to level up your trading game? Join us for the next 10 lessons as we dive deep into essential trading concepts that will help you grow your knowledge and sharpen your skills. Whether you're a beginner or looking to refine your strategy, these lessons are designed to guide you on your journey to better understand the markets.
**📊 What is Sentiment Analysis?**
Sentiment analysis gauges the mood of market participants towards an asset or the entire market. By analyzing news, social media, and financial reports, you can determine whether the sentiment is bullish, bearish, or neutral, helping you anticipate market moves.
**👥 Who Are the Most Important Market Participants?**
The market is shaped by various players: Retail traders, institutional investors, market makers, central banks, high-frequency traders, and arbitrageurs. Each plays a crucial role in price movements and market efficiency.
**📈 Why Does Sentiment Matter?**
Sentiment drives market behavior. Understanding it allows you to anticipate trends, avoid potential pitfalls, and make informed decisions before significant market moves.
**🔍 How to Read the Market Sentiment?**
Analyze news headlines, social media, market indices like the VIX, and sentiment indicators like the Put/Call Ratio to get a comprehensive view of market sentiment.
**🎯 The Right Indicator**
Selecting the right sentiment indicator depends on your trading focus. Use tools like the Bullish Percent Index, AAII Sentiment Survey, and VIX to gain deeper insights.
--> ❤️ I love the sentiment indicator by Dreatblitz: Bull Bear Power Trend (BBPT) - I use it to find divergences in price and emotional trends.
**👍 Pros and Cons of Sentiment Analysis**
**Pros:** Anticipate market moves, identify overbought/oversold conditions, and complement other analyses.
**Cons:** It can be subjective, rapidly change, and sometimes lead to irrational market behavior.
**🔚 Conclusion and Recommendation**
Sentiment analysis is a powerful tool in your trading arsenal. Combine it with technical and fundamental analysis for the best results, and always prioritize risk management. With practice, you'll become adept at reading market sentiment and using it to your advantage.
**🔥 Can’t get enough? Don't Miss Out!**
Subscribe, share, and engage with us in the comments. This is the start of a supportive trading community—built by traders, for traders! 🚀 Join us on the journey to market mastery, where we grow, learn, and succeed together. 💪
**💡 What You'll Learn:**
- The fundamentals of trading
- Key technical and sentiment indicators
- Risk management strategies
- And much more!...
Best wishes,
TradingMasteryHub

BTC Arb TradingA simple and pretty visualization of long and short leveraged ETFs and Bitcoin Index. Comments welcome on ways to interpret the data into executing winning trades. Cheers!

#ARB/USDT#ARB
The price is moving within a bullish channel pattern on a 12-hour frame, which is a retracement pattern
We have a bounce from a green support area at 0.9000
We have a tendency to stabilize above the Moving Average 100
We have a downtrend on the RSI indicator that supports the rise and gives greater momentum
Entry price is 0.9700
The first target is 1.048
The second goal is 1.136
Third goal 1.24
