ARKMUSDT Make or Break? Testing the Ultimate Historical Support!🧱 Critical Support Zone in Play
ARKM is currently trading around $0.470, sitting right on top of a major historical support zone ($0.400–$0.470) highlighted in yellow on the chart. This area previously served as a launchpad in late 2023, propelling price to an all-time high of $3.996.
Now, after a prolonged downtrend, the price is once again testing this same key level. The market's reaction here will likely define the next macro direction—will ARKM bounce and reverse, or break down into new lows?
---
📐 Technical Structure & Key Levels
Major Support (Demand Zone): $0.400 – $0.470
Layered Resistance:
Minor: $0.616, $0.730, $0.894
Mid-Level: $1.575
Major: $2.493 & $3.188
All-Time High: $3.996
Volume Insight: Still relatively low, suggesting possible accumulation.
---
🔄 Pattern Development:
✅ Potential Double Bottom or Accumulation Base – Multiple bounces off the $0.400 zone hint at the formation of a medium-term reversal structure.
If buyers step in and push the price above $0.616–$0.730, we could see confirmation of a trend reversal beginning.
---
📈 Bullish Scenario:
If price:
Holds and rebounds strongly from $0.400–$0.470
Breaks and closes above $0.616 and $0.730 with increasing volume
Then next bullish targets are:
➡️ $0.894 (key resistance)
➡️ $1.575 (mid-range supply zone)
➡️ $2.493 – $3.188 (macro targets for medium-long term rally)
📌 Volume breakout and bullish candle structures will strengthen this scenario.
---
📉 Bearish Scenario:
If price:
Breaks and closes decisively below $0.400, invalidating the support zone
This could trigger a mass stop-loss cascade, with sellers taking over.
Next possible supports: ⚠️ $0.250 (minor support)
⚠️ $0.170 (last structural support in breakdown mode)
This scenario might unfold if overall crypto market sentiment worsens.
---
🧠 Strategy & Trade Ideas:
Buy on Reversal: Strong bounce at $0.400 zone with tight stop-loss below support
Buy on Breakout: Clear break and retest of $0.730 with volume confirmation
Sell/Short: Breakdown below $0.400 with failed retest
🛡️ Always apply proper risk management with a minimum 1:2 risk-reward ratio. Avoid FOMO—wait for confirmation.
---
🔍 Final Thoughts:
ARKM is in a high-stakes zone that has historically generated explosive moves. This is either a huge opportunity for accumulation or a potential breakdown into uncharted lows. The next few candles could define the rest of the year for this asset.
#ARKM #ARKMUSDT #CryptoTA #AltcoinAnalysis #SupportAndResistance #CryptoBreakout #DoubleBottomPattern #ReversalZone #BuyOrBreak #CryptoSetup
Arkmusdtlong

ARKM/USDT – Major Breakout Signal from Multi-Month Accumulation Detailed Analysis:
ARKM/USDT is currently showing a strong technical signal for a potential bullish reversal after a prolonged downtrend from its peak near $3.996. Here are the key insights from the chart:
1. Long-Term Accumulation Zone:
Price has formed a strong horizontal support zone between $0.35 and $0.45 (highlighted in yellow).
Multiple rejections from this zone indicate accumulation by smart money.
2. Descending Triangle Breakout Pattern:
A clear downward trendline has been tested multiple times and is now close to being broken.
A successful breakout could trigger a powerful upward rally.
3. Potential Upside Targets (Resistance Levels):
Target 1: $0.73
Target 2: $0.894
Target 3: $1.575
Target 4: $2.493
Target 5: $3.188
Final Target (ATH): $3.996
4. Potential Trading Strategy:
Aggressive entry: On breakout above the descending trendline with strong volume.
Conservative entry: On retest of the broken trendline, now acting as support.
Stop-loss: Just below the accumulation zone (~$0.30).
5. Market Sentiment:
The market structure suggests a potential bullish reversal is building.
If momentum confirms, this setup has significant upside potential.
🎯 Summary:
ARKM is showing signs of strength as it approaches a breakout from a key descending triangle pattern. A move above the resistance could mark the beginning of a strong bullish trend. Keep an eye on volume and breakout confirmation.
#ARKM #ARKMUSDT #CryptoBreakout #AltcoinAnalysis #TechnicalAnalysis #CryptoReversal #BullishSetup #CryptoTrading #TradingView #DescendingTriangle

ARKMUSDT 2D AnalysisARKM ~ 2D Analysis
#ARKM Buy gradually from this support block with a short term target of at least 20%+ from here.

#ARKM/USDT#ARKM
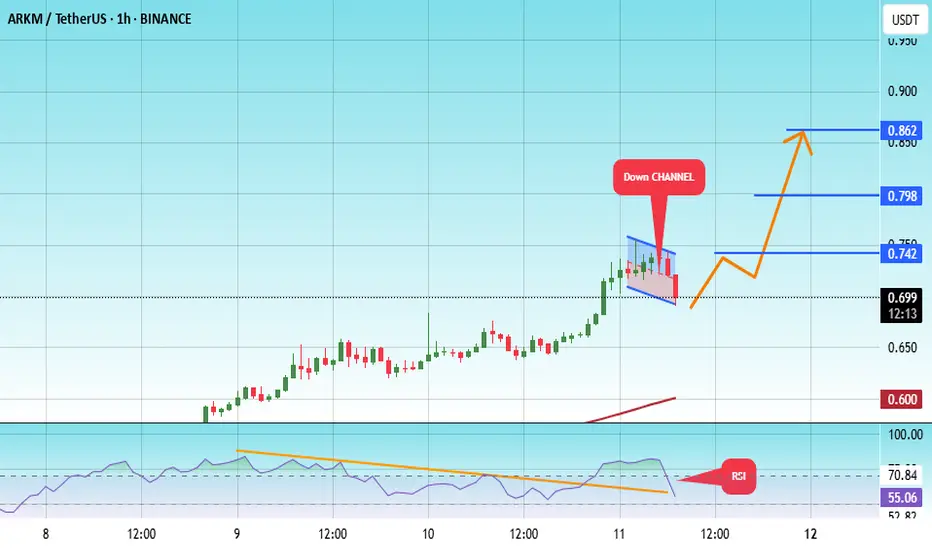
The price is moving within a descending channel on the 1-hour frame, adhering well to it, and is heading for a strong breakout and retest.
We are seeing a bounce from the lower boundary of the descending channel, which is support at 0.690.
We have a downtrend on the RSI indicator that is about to be broken and retested, supporting the upward trend.
We are looking for stability above the 100 moving average.
Entry price: 0.695
First target: 0.742
Second target: 0.798
Third target: 0.862
#ARKM/USDT#ARKM
The price is moving within a descending channel on the 1-hour frame, adhering well to it, and is heading for a strong breakout and retest.
We are seeing a bounce from the lower boundary of the descending channel, which is support at 0.612.
We have a downtrend on the RSI indicator that is about to break and retest, supporting the upward trend.
We are looking for stability above the 100 moving average.
Entry price: 0.635
First target: 0.684
Second target: 0.663
Third target: 0.684

ARKMUSDT 3DARKM ~ 3D Analysis
#ARKM Buy gradually from here if you still have a Conviction on this coin with a short -term target of at least 20%+.

ARKM/USDTHello friends
Given the price growth of this token, now that we are in a price correction, it is a good opportunity to buy.
We have identified the buying steps for you, which are three ranges, one is the market, the other two are green ranges, and price targets have also been identified.
*Trade safely with us*

ARKMUSDT 3DARKM ~ 3D Analysis
#ARKM Buy gradually from here with a short -term target of at least 15%+.
ARKMUSDT 3DARKM ~ 3D Analysis
#ARKM If you still have a Conviction on this Coin, Maybe you can consider this support to start buying again.

ARKMUSDT 2DARKM ~ 2D
#ARKM If you still have Conviction on this coin,. Buy in stages from here with a minimum target of 20%++

#ARKM/USDT#ARKM
The price is moving in a descending channel on the 4-hour frame and is sticking to it well
We have a bounce from the lower limit of the descending channel and we are now touching this support at a price of 1.45
We have a downtrend and the RSI indicator is about to break, which supports the rise
We have a trend to stabilize above the moving average 100
Entry price 1.56
First target 1.78
Second target 1.96
Third target 2.15

ARKM/USDT analysis: approaching key resistance ARKM/USDT analysis: approaching key resistance
ARKM/USDT is currently nearing a significant resistance level, showing potential for a breakout. The price action is gaining momentum, and a clear move above this zone could lead to a bullish trend. This is a good time to monitor closely for trading opportunities.
Key observations:
- Resistance zone: ARKM/USDT is testing a crucial level that has previously acted as a barrier. Breaking this could trigger a strong upward move.
- Volume dynamics: A noticeable increase in trading volume during a breakout will confirm buyer strength.
- Momentum signals: Indicators like RSI and MACD are showing signs of bullish momentum building up.
Tips for trading this setup:
- Wait for confirmation with a 4H or daily candle closing above the resistance.
- Look for a retest of the broken resistance as new support to enter safely.
- Keep an eye on volume spikes, as they validate the strength of the breakout.
- Always manage risk with a stop-loss placed below the breakout zone.
Potential targets:
- First target: .
- Second target: .
This is for educational purposes only. Always do your own research before making trading decisions.

ARKMUSDT Are We on the Verge of a Major Move or a Deeper Fall?Yello, Paradisers! Is #ARKMUSDT setting up for a major breakout, or are we heading for a significant dip? Let’s break down what’s happening with this coin and how it could play out.
💎#ARKM is losing momentum after facing a strong rejection at the key resistance level of $1.83. Now, all eyes are on the demand zone between $1.68 - $1.55. If the price holds and rebounds here, it could gather the momentum needed to retest and possibly break out above that $1.83 resistance. If successful, this would signal a return to a bullish structure, with a high probability of reaching our next target.
💎However, things could take a turn for the worse if the price fails to rebound at the $1.68 - $1.55 zone. A breakdown below this area could lead to a continuation of the downward trend, with the price potentially revisiting the Order Block (OB) at $1.35.
💎In line with previous price action, the $1.35 area has historically acted as a strong level of support, which could offer a significant rebound opportunity. But for the price to regain its upward momentum, it must reclaim the $1.68 level. Failure to do so—and worse, a breakdown below the $1.127 demand level—would confirm a bearish trend and suggest further downside potential.
Strive for consistency, not quick profits. Treat the market as a businessman, not as a gambler.
MyCryptoParadise
iFeel the success🌴

#ARKM Quick PUMM Is Loading #ARKM Quick PUMM Is Loading .. A Exit/Quick Pump may occur in #ARKM..This is about 70 % Pump Target..
For Timely Updates DM me.

$ARKM Ignites: Are We Heading for All-Time Highs?I regret overlooking $ARKM, especially after it just fired a massive bullish signal on the monthly chart. This asset has all the indicators pointing toward a potential return to all-time highs.
From the chart analysis, a retrace to $1.33 would be fortunate, as I expect $ARKM to continue its ascent toward the initial target of $1.87. Should a full reversal occur, we could see $3.50 in the near future.
For now, let’s focus on riding this momentum. The daily trend is active, but I plan to be cautious and wait for a retrace before increasing my position. I might regret not being more aggressive, but it's the end of the week, which could lead to some selling pressure at Monday’s open.
If NYSE:FET moves, this one follows. Simple

ARKM target 2.524h time frame
-
Entry: $1.4
TP: $2.52
SL: $1.28
RR: 7.26
-
(1) Potential symmetrical structure, will go to the high at $2.52 before December
(2) Retesting the standard double bottom, which neckline is around $1.4
(3) Fibonacci projection 0.618 provide another support
(4) Target is set at Fib 2.0, which also have the resistance from previous structure
(5) Stop loss once going below $1.28

ARKM Bullish Momentum Signals Potential Trend Reversal!!Yello, Paradisers! Is #ARKMUSDT about to make its next big move? This chart is giving us strong signals that we might be witnessing a *bullish reversal*, but there are key levels to watch closely. Let’s dive in.
💎#ARKM is showing strong bullish momentum after a successful breakout from the previous pattern, even breaking the last lower high (LH). This could signal a **trend reversal** back to the upside. However, before getting too excited, we need to see a retest of the demand zone between 1.25 and 1.15. If this retest holds, we could expect a significant upward movement, with price potentially reaching the major resistance area over the next few weeks or months.
💎If ARKM fails to rebound from 1.32 and breaks below this level, we could be looking at a fake-out. In that case, the price may revisit the major support zone between 0.92 and 0.74. If this happens, it might actually present a solid buying opportunity since this level has a high probability of recovery, offering another chance for the upward trend to resume.
💎A daily candle close below 0.74 would invalidate the bullish outlook, as this breaks the previous low. If that happens, ARKM could make a new lower low, potentially leading to further downside.
Remember, Paradisers, patience and discipline are key.
MyCryptoParadise
iFeel the success🌴

ARKMUSDT BULLISH (Harmonic AB=CD)ARKMUSDT shows a bullish momentum as soon as it hits the LH and make new HH. Price actions also shows harmonic AB=CD with a price target going up to TP5. There is no divergence and also open interest is increasing.
***Trade Plan***
Entry @ Buy Stop
Stop Loss @ previous LL
TP1 to TP5 @ 1:5
What do you think, will it work?
