APX Rebound in Play?📈 “APX Rebound in Play? Eyeing the AUD 1.55 Resistance”
Appen (APX) has shown a significant uptick today, closing at AUD 1.040 (+5.58%) with a sharp volume spike (8.96M shares) that could suggest accumulation. After a long downtrend, price appears to be consolidating above key support near AUD 1.00, forming a potential base for reversal.
🔍 Chart Highlights:
Support Zone: AUD 1.000 – strong historical level holding.
Resistance Targets: → AUD 1.555 → AUD 1.655 → AUD 1.785
R/R Setup: Defined green zone shows potential upside if momentum continues; red zone clearly marks invalidation below support.
🧠 Thesis: If APX maintains momentum and holds above AUD 1.00, we may be witnessing a structural shift with upside potential toward AUD 1.78 in stages. Breakout traders might watch for confirmation via volume and price action at each resistance.
💬 “Could we be looking at an early-stage reversal or just a dead-cat bounce? Watching the 1.00 level closely.”
#ASX #APX #APPEN #MJTRADING #TRADING #SHARE #STOCKMARKET #BUY #CHART #MONEYMANAGEMENT
ASX

Bullish potential detected for HDNEntry conditions:
(i) breach of the upper confines of the Darvas box formation for ASX:HDN
- i.e.: above high of $1.31 of 9th May (most conservative entry), and
(ii) swing up of indicators such as DMI/RSI along with a test of prior level of resistance of $1.31 from 31st October 2022.
Stop loss for the trade (based upon the Darvas box formation) would be:
(i) below the support level from the low of 15th May (i.e.: below $1.24).

Potential outside week and bullish potential for CQREntry conditions:
(i) higher share price for ASX:CQR above the level of the potential outside week noted on 6th June (i.e.: above the level of $4.10).
Stop loss for the trade would be:
(i) below the low of the outside week on 2nd June (i.e.: below $3.91), should the trade activate.

ASX200 short term bias has turned negative.ASX200 - 24h expiry
Short term bias has turned negative.
A shooting star has been posted on the weekly charts.
Bearish divergence is expected to cap gains.
Previous resistance located at 8550.
50 4hour EMA is at 8528.
We look to Sell at 8529 (stop at 8581)
Our profit targets will be 8375 and 8355
Resistance: 8543 / 8574 / 8594
Support: 8476 / 8400 / 8335
Risk Disclaimer
The trade ideas beyond this page are for informational purposes only and do not constitute investment advice or a solicitation to trade. This information is provided by Signal Centre, a third-party unaffiliated with OANDA, and is intended for general circulation only. OANDA does not guarantee the accuracy of this information and assumes no responsibilities for the information provided by the third party. The information does not take into account the specific investment objectives, financial situation, or particular needs of any particular person. You should take into account your specific investment objectives, financial situation, and particular needs before making a commitment to trade, including seeking advice from an independent financial adviser regarding the suitability of the investment, under a separate engagement, as you deem fit.
You accept that you assume all risks in independently viewing the contents and selecting a chosen strategy.
Where the research is distributed in Singapore to a person who is not an Accredited Investor, Expert Investor or an Institutional Investor, Oanda Asia Pacific Pte Ltd (“OAP“) accepts legal responsibility for the contents of the report to such persons only to the extent required by law. Singapore customers should contact OAP at 6579 8289 for matters arising from, or in connection with, the information/research distributed.

ASX 200 Looks Set to BounceThe ASX 200 has drifted lower since its latest record high was set six days ago. 8500 held as support before doji formed on Tuesday to mark a false break of this key level. ASX 200 futures also tried but failed to break beneath it overnight.
Given the bullish divergence on the 1-hour RSI (14) and RSI (2), the bias is to seek dips towards 8500 for a cheeky long towards the December high.
Matt Simpson, Market Analyst at City Index and Forexc.com

High Dividend Stock on the Move? COH – Eyes on 351.51 Cochlear Limited (ASX: COH) is showing strong bullish potential after price tapped into a respected Monthly Order Block (OB). This region aligns with a historically strong demand zone, offering a prime entry opportunity for longer-term investors and SMC traders alike.
From a Smart Money Concept (SMC) perspective, the structure remains bullish:
- Price swept a low into the Monthly OB, indicating engineered liquidity grab.
- The reaction shows strong displacement to the upside, validating the OB.
- Volume also suggests institutional interest at this level.
- There’s now a clean path toward Equal Highs at 351.51, a natural draw for buy-side liquidity.
With COH offering consistent dividend payouts, this could be a double win – capital appreciation + income.
🧠 As always: Do Your Own Research (DYOR).

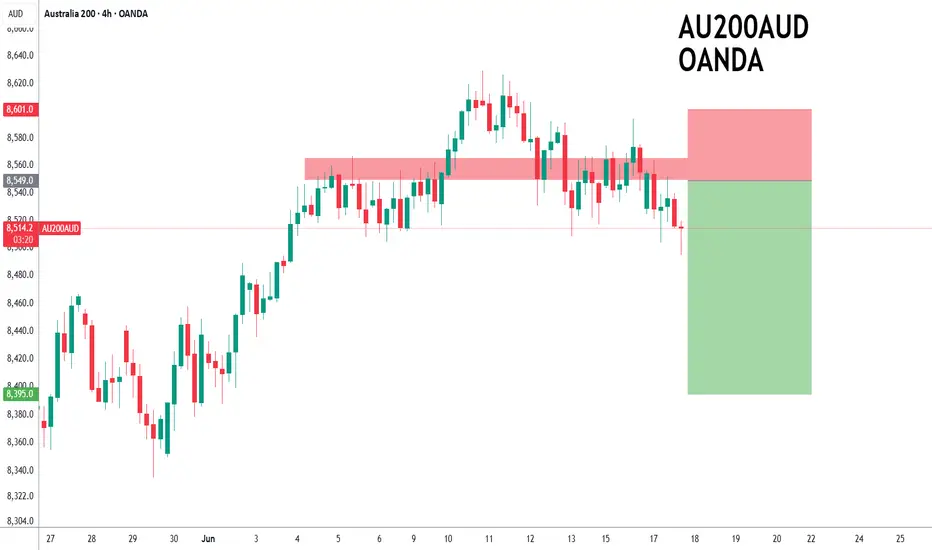
ASX200 forming a top?ASX200 - 24h expiry
Price action looks to be forming a top. A shooting star has been posted on the weekly charts.
Bearish divergence is expected to cap gains.
Previous resistance located at 8550.
Although the bulls are in control, the stalling positive momentum indicates a turnaround is possible.
We look to Sell at 8549 (stop at 8601)
Our profit targets will be 8395 and 8365
Resistance: 8552 / 8594 / 8629
Support: 8504 / 8450 / 8400
Risk Disclaimer
The trade ideas beyond this page are for informational purposes only and do not constitute investment advice or a solicitation to trade. This information is provided by Signal Centre, a third-party unaffiliated with OANDA, and is intended for general circulation only. OANDA does not guarantee the accuracy of this information and assumes no responsibilities for the information provided by the third party. The information does not take into account the specific investment objectives, financial situation, or particular needs of any particular person. You should take into account your specific investment objectives, financial situation, and particular needs before making a commitment to trade, including seeking advice from an independent financial adviser regarding the suitability of the investment, under a separate engagement, as you deem fit.
You accept that you assume all risks in independently viewing the contents and selecting a chosen strategy.
Where the research is distributed in Singapore to a person who is not an Accredited Investor, Expert Investor or an Institutional Investor, Oanda Asia Pacific Pte Ltd (“OAP“) accepts legal responsibility for the contents of the report to such persons only to the extent required by law. Singapore customers should contact OAP at 6579 8289 for matters arising from, or in connection with, the information/research distributed.
Markets rally as missiles fly | how long can risk be ignored? Markets may be underpricing Israel and Iran risk.
Despite continued fighting—including high-impact strikes and rising casualties—global equities moved higher to start the week.
U.S. indices led the advance, with the Nasdaq gaining 1.5%, followed by the S&P 500 and Dow. Earlier in the session, European and Asian markets also closed higher, with Germany’s DAX up 0.8% and Japan’s Nikkei rising 1.3%. Now Asian markets are set to open for the second trading day of the week.
Tensions escalated further on Monday as Israel launched drone strikes on Iran’s state-run IRINN television headquarters in Tehran, interrupting a live broadcast. Additional Israeli attacks hit the South Pars gas field. In retaliation, Iran launched a fresh wave of missile attacks into Israel, killing at least five people.

Potential outside week and bullish potential for NEMEntry conditions:
(i) higher share price for ASX:NEM above the level of the potential outside week noted on 13th June (i.e.: above the level of $88.35).
Stop loss for the trade would be:
(i) below the low of the outside week on 11th June (i.e.: below $80.70), should the trade activate.

Potential outside week and bearish potential for TLXEntry conditions:
(i) lower share price for ASX:TLX below the level of the potential outside week noted on 2nd June (i.e.: below the level of $24.91).
Stop loss for the trade would be:
(i) above the high of the outside week on 5th June (i.e.: above $27.40), should the trade activate.
Important note for the trade:
- Observe market reaction at two key areas illustrated in the chart above, should the trade activate ($24.79 and $24.47), which could act as support against the short trade.

Bearish potential detected for NHCEntry conditions:
(i) lower share price for ASX:NHC along with swing of DMI indicator towards bearishness and RSI downwards, and
(ii) observing market reaction around the share price of $3.57 (open of 11th April).
Stop loss for the trade would be:
(i) above the high of the recent swing high once the trade is activated (currently $3.75 from the high of 19th May).

Bullish potential detected for DRREntry conditions:
(i) higher share price for ASX:DRR along with swing up of indicators such as DMI/RSI.
Depending on risk tolerance, the stop loss for the trade would be:
(i) a close below the 50 day moving average (currently $3.63), or
(ii) below previous support of $3.49 from the open of 14th March, or
(iii) below previous support of $3.34 from the open of 5th September.

Bullish potential detected for ABGEntry conditions:
(i) higher share price for ASX:ABG along with swing up of indicators such as DMI/RSI.
Depending on risk tolerance, the stop loss for the trade would be:
(i) a close below the 50 day moving average (currently $1.148), or
(ii) below previous resistance (now support) of $1.14 from the open of 28th March, or
(iii) below previous support of $1.09 from the open of 9th April / 14th January.

Bearish potential detected for AIAEntry conditions:
(i) lower share price for ASX:AIA along with swing of DMI indicator towards bearishness and RSI downwards, and
(ii) close below the 200 day moving average, and
(iii) observing market reaction around the share price of $7.08 (open of 8th April).
Stop loss for the trade would be:
(i) above the high of the recent swing high once the trade is activated (currently $7.41 from the high of 8th May).

Bearish potential detected for PDNEntry conditions:
(i) lower share price for ASX:PDN along with swing of DMI indicator towards bearishness and RSI downwards, and
(ii) close below the 50 day moving average (currently $5.91), and
(iii) observing market reaction around the share price of $5.72 (open of 28th March).
Stop loss for the trade would be:
(i) above the high of the recent swing high once the trade is activated (currently $6.35 from the high of 2nd May).

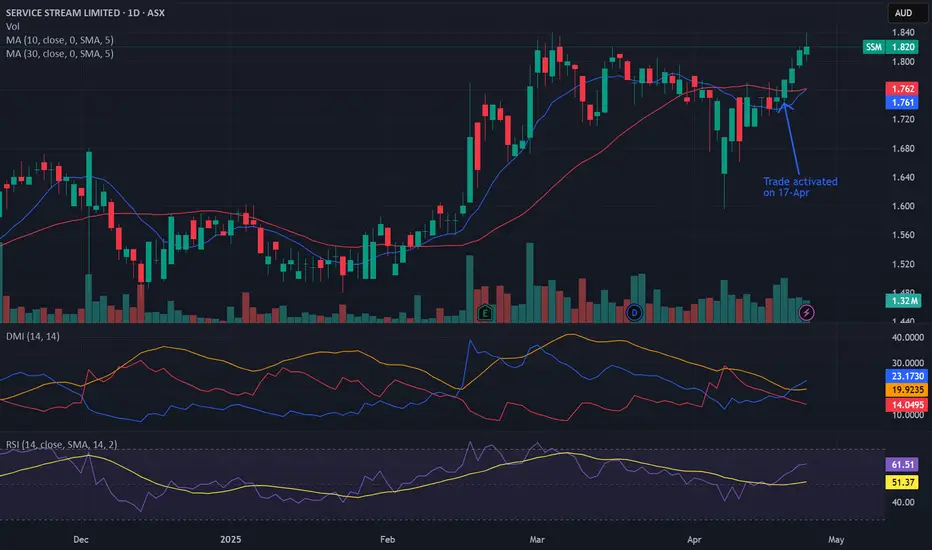
Bullish potential detected for SSMEntry conditions:
(i) higher share price for ASX:SSM along with swing up of indicators such as DMI/RSI.
Stop loss for the trade would be:
(i) below the support level from the open of 13th March (i.e.: below $1.725), or
(ii) below the support level from the open of 26th February (i.e.: below $1.67), or
(ii) below the support level from the open of 7th April (i.e.: below $1.645), depending on risk tolerance.
Bullish potential detected for RIOEntry conditions:
(i) higher share price for ASX:RIO along with swing up of indicators such as DMI/RSI.
Depending on risk tolerance, the stop loss for the trade would be:
(i) below the recent swing low of 14th May (i.e. $118.63), or
(ii) a close below the 200 day moving average (currently $116.88), or
(iii) a close below the 50 day moving average (currently $115.66).

ASX short term bias remains positive.ASX200 - 24h expiry
Our short term bias remains positive.
Intraday dips continue to attract buyers and there is no clear indication that this sequence for trading is coming to an end.
Buying continued from the 78.6% pullback level of 8321.
We look to buy dips.
50 4hour EMA is at 8331.
We look to Buy at 8330 (stop at 8275)
Our profit targets will be 8495 and 8545
Resistance: 8386 / 8426 / 8500
Support: 8343 / 8300 / 8249
Risk Disclaimer
The trade ideas beyond this page are for informational purposes only and do not constitute investment advice or a solicitation to trade. This information is provided by Signal Centre, a third-party unaffiliated with OANDA, and is intended for general circulation only. OANDA does not guarantee the accuracy of this information and assumes no responsibilities for the information provided by the third party. The information does not take into account the specific investment objectives, financial situation, or particular needs of any particular person. You should take into account your specific investment objectives, financial situation, and particular needs before making a commitment to trade, including seeking advice from an independent financial adviser regarding the suitability of the investment, under a separate engagement, as you deem fit.
You accept that you assume all risks in independently viewing the contents and selecting a chosen strategy.
Where the research is distributed in Singapore to a person who is not an Accredited Investor, Expert Investor or an Institutional Investor, Oanda Asia Pacific Pte Ltd (“OAP“) accepts legal responsibility for the contents of the report to such persons only to the extent required by law. Singapore customers should contact OAP at 6579 8289 for matters arising from, or in connection with, the information/research distributed.

Bearish potential detected for CMMEntry conditions:
(i) lower share price for ASX:CMM along with swing of DMI indicator towards bearishness and RSI downwards, and
(ii) observing market reaction around the share price of $8.23 (open of 21st March).

Bullish potential detected for NHFEntry conditions:
(i) higher share price for ASX:NHF along with swing up of indicators such as DMI/RSI.
Stop loss for the trade would be:
(i) below the support level from the open of 17th March (i.e.: below $6.41), or
(ii) below the support level from the open of 24th February (i.e.: below $6.30), depending on risk tolerance.

Potential outside week and bullish potential for KCNEntry conditions:
(i) higher share price for ASX:KCN above the level of the potential outside week noted on 2nd May (i.e.: above the level of $1.825).
Stop loss for the trade would be:
(i) below the low of the outside week on 28th April (i.e.: below $1.54), should the trade activate.

Bullish potential detected for WPREntry conditions:
(i) higher share price for ASX:WPR along with swing up of indicators such as DMI/RSI.
Stop loss for the trade would be:
(i) a close below the 200 day moving average (currently $2.49), or
(ii) a close below the 50 day moving average (currently $2.42), or
(ii) below the support level from the open of 2nd January (i.e.: below $2.34), depending on risk tolerance.

Bullish potential detected for WOWEntry conditions:
(i) higher share price for ASX:WOW along with swing up of indicators such as DMI/RSI, and
(ii) observation of market reaction at the resistance level / volume profile area at $32.32 after closing above 200 day MA.
Stop loss for the trade would be, dependent on risk tolerance:
(i) a close below the 200 day moving average (currently $31.63), or
(ii) a close below the 50 day moving average (currently $30.17).
