AUDUSD LONG FORECAST Q2 W23 D3 Y25👀 AUDUSD LONG FORECAST Q2 W23 D3 Y25
Professional Risk Managers👋
Welcome back to another FRGNT chart update📈
Diving into some Forex setups using predominantly higher time frame order blocks alongside intraday confirmation & breaks of structure.
Let’s see what price action is telling us today! 🔥
💡Here are some trade confluences📝
✅Weekly 50 EMA
✅Daily 50 EMA
✅15’ order block
✅Intraday bullish breaks of structure
🔑 Remember, to participate in trading comes always with a degree of risk, therefore as professional risk managers it remains vital that we stick to our risk management plan as well as our trading strategies.
📈The rest, we leave to the balance of probabilities.
💡Fail to plan. Plan to fail.
🏆It has always been that simple.
❤️Good luck with your trading journey, I shall see you at the very top.
🎯Trade consistent, FRGNT X
AUDUSD
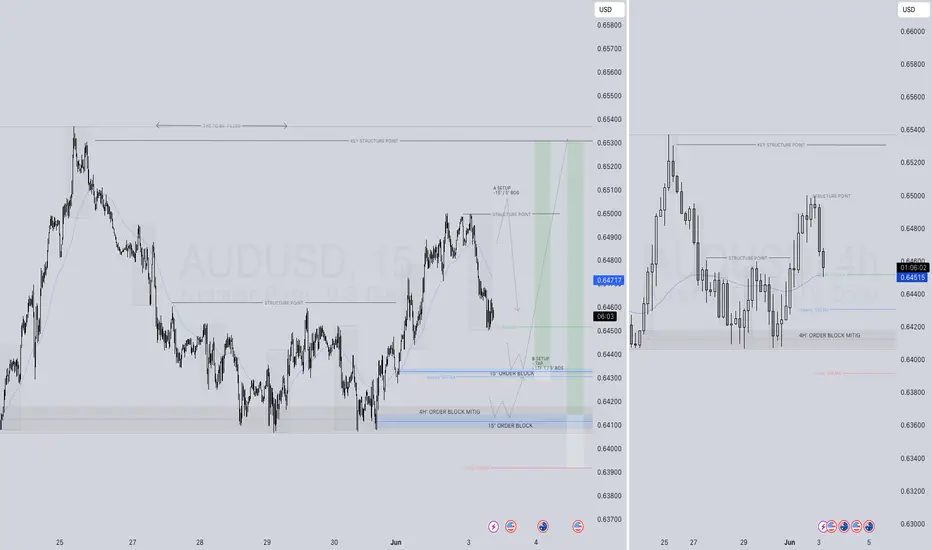
AUDUSD Asia SessionWe could see bullish momentum during the Asian session pushing price into the upper supply zone around 0.65200. From there, we’ll be monitoring for bearish price action (PA) to potentially confirm a short setup.
If confirmation aligns, the short idea targets the demand zone between 0.64600–0.64500.
This is a forecast — not a signal. Trade execution will depend on what price does upon reaching the supply. We’ll drop to the H1 or M15 to refine entries if bearish confirmations present themselves.
Higher Timeframe Context: clearly marked HTF supply. Price has made a corrective leg up into this zone.
Liquidity & Reaction Area: There's likely resting liquidity above the most recent highs before the 0.65200 zone — perfect for a sweep.
Entry Plan: Smart to wait for CHoCH or BOS on LTF once we enter the supply zone. Avoid rushing — let the zone prove itself.
Target Area: The 0.64600–0.64500 zone aligns with previous structure and a minor FVG — solid short-term TP.

AUD/USD Coiling for Breakout as Wedge Tightens Below 200-day SMAAUD/USD is threatening a breakout from a bullish ascending triangle pattern after weeks of tight consolidation:
Triangle Pattern: The pair has carved out a clear ascending triangle, marked by higher lows and resistance near 0.6500. Today's breakout attempt is the most convincing yet.
Key Levels in Play: 0.6500 remains the neckline to beat, while the 200-day SMA (currently near 0.6446) has served as a gravity line for weeks. A daily close above both would mark a significant technical shift.
Momentum Gauges: RSI is lifting off the 50 level, hinting at building bullish momentum. MACD is attempting to cross above the zero line but still lacks follow-through.
Targets: A confirmed breakout opens the door toward the 0.6558 Fibonacci level, with 0.6730 a stretch target if momentum builds.
Failure to break higher from here could bring a sharp drop back toward support near 0.6360. Keep an eye on volume and closing strength.
-MW

AUD/USD - Triangle Breakout (02.06.2025)The AUD/USD pair on the M30 timeframe presents a Potential Buying Opportunity due to a recent Formation of a Triangle Pattern. This suggests a shift in momentum towards the upside and a higher likelihood of further advances in the coming hours.
Possible Long Trade:
Entry: Consider Entering A Long Position around Trendline Of The Pattern.
Target Levels:
1st Resistance – 0.6490
2nd Resistance – 0.6512
🎁 Please hit the like button and
🎁 Leave a comment to support for My Post !
Your likes and comments are incredibly motivating and will encourage me to share more analysis with you.
Best Regards, KABHI_TA_TRADING
Thank you.
Disclosure: I am part of Trade Nation's Influencer program and receive a monthly fee for using their TradingView charts in my analysis.

AUDUSD The Target Is DOWN! SELL!
My dear friends,
My technical analysis for AUDUSD is below:
The market is trading on 0.6477 pivot level.
Bias - Bearish
Technical Indicators: Both Super Trend & Pivot HL indicate a highly probable Bearish continuation.
Target - 0.6446
Recommended Stop Loss - 0.6495
About Used Indicators:
A pivot point is a technical analysis indicator, or calculations, used to determine the overall trend of the market over different time frames.
Disclosure: I am part of Trade Nation's Influencer program and receive a monthly fee for using their TradingView charts in my analysis.
———————————
WISH YOU ALL LUCK
DXY Update..PWL takenGood day traders I’m back yet again with another update but this this it’s DXY(dollarindex)).
Price has taken previous week’s low, and for me that’s the manipulation phase in the power of 3 because my bias is bullish on the dollar and bearish on foreign currencies. Price has taken the PWL in a zone/area where we saw price react higher in that BPR zone/area. For the rest of the week I personally believe we can expect higher prices on DXY, Atleast till the midpoint of that gap above price. ICT teaches more on the importance of that halfway/midpoint of gaps and other PD arrays.
Since we are in a discount zone we can expect price to move higher into the premium range of the daily TF dealing range and our first liquidity (internal) is also inside the premium zone.

AUDUSD Will Move Lower! Sell!
Please, check our technical outlook for AUDUSD.
Time Frame: 9h
Current Trend: Bearish
Sentiment: Overbought (based on 7-period RSI)
Forecast: Bearish
The market is approaching a key horizontal level 0.648.
Considering the today's price action, probabilities will be high to see a movement to 0.644.
P.S
Overbought describes a period of time where there has been a significant and consistent upward move in price over a period of time without much pullback.
Disclosure: I am part of Trade Nation's Influencer program and receive a monthly fee for using their TradingView charts in my analysis.
Like and subscribe and comment my ideas if you enjoy them!

AUDUSD Bullish Signal | Technical + Custom AlgoSmart Trend Signal | Technical Analysis + Custom Algorithm
This signal is the result of a combination of classic technical trend analysis and a proprietary software I personally developed.

AUDUSD trade has hit Take ProfitThe AUDUSD trade I shared earlier has just hit TP at 0.6487. This will be my first and last trade for today. As I mentioned, today and this week are quite heavy in terms of news, so I’ll be trading less. Wishing everyone a profitable day — manage your risk wisely.

AUDUSD Hello traders. Wishing everyone a productive week ahead!
Today, the U.S. Manufacturing PMI (May) and the ISM Manufacturing PMI (May) reports will be released — both are high-impact events for the markets. This week, in particular, is expected to be news-heavy.
That said, it’s wise to remain cautious with trades. My plan is to open a few trades before the news and close them beforehand. One of these opportunities has emerged on the AUDUSD pair. I’ve already taken a Buy trade, and it's currently active.
This setup has two key Take Profit zones:
First TP: 0.6487
Second TP: 0.65137
I’ve personally targeted the first TP level, so I’ll be sharing the details of that trade. However, the same structure applies to the second target as well if you choose to aim higher.
🔍 Trade Details:
✔️ Timeframe: 15-Minute
✔️ Risk-to-Reward Ratio: 1:1 / 1:1.50 / 1:2
✔️ Trade Direction: Buy
✔️ Entry Price: 0.64587
✔️ Take Profit: 0.64865
✔️ Stop Loss: 0.64446
🔔 Disclaimer: This is not financial advice. I’m simply sharing a trade I’ve taken based on my personal trading system, strictly for educational and illustrative purposes.
📌 Interested in a systematic, data-driven trading approach?
💡 Follow the page and turn on notifications to stay updated on future trade setups and advanced market insights.

Aussie H4 | Potential bullish bounceThe Aussie (AUD/USD) is falling towards a multi-swing-low support and could potentially bounce off this level to climb higher.
Buy entry is at 0.6394 which is a multi-swing-low support that aligns with the 23.6% Fibonacci retracement.
Stop loss is at 0.63330 which is a level that lies underneath a multi-swing-low support.
Take profit is at 0.6521 which is a swing-high resistance.
High Risk Investment Warning
Trading Forex/CFDs on margin carries a high level of risk and may not be suitable for all investors. Leverage can work against you.
Stratos Markets Limited (tradu.com ):
CFDs are complex instruments and come with a high risk of losing money rapidly due to leverage. 63% of retail investor accounts lose money when trading CFDs with this provider. You should consider whether you understand how CFDs work and whether you can afford to take the high risk of losing your money.
Stratos Europe Ltd (tradu.com ):
CFDs are complex instruments and come with a high risk of losing money rapidly due to leverage. 63% of retail investor accounts lose money when trading CFDs with this provider. You should consider whether you understand how CFDs work and whether you can afford to take the high risk of losing your money.
Stratos Global LLC (tradu.com ):
Losses can exceed deposits.
Please be advised that the information presented on TradingView is provided to Tradu (‘Company’, ‘we’) by a third-party provider (‘TFA Global Pte Ltd’). Please be reminded that you are solely responsible for the trading decisions on your account. There is a very high degree of risk involved in trading. Any information and/or content is intended entirely for research, educational and informational purposes only and does not constitute investment or consultation advice or investment strategy. The information is not tailored to the investment needs of any specific person and therefore does not involve a consideration of any of the investment objectives, financial situation or needs of any viewer that may receive it. Kindly also note that past performance is not a reliable indicator of future results. Actual results may differ materially from those anticipated in forward-looking or past performance statements. We assume no liability as to the accuracy or completeness of any of the information and/or content provided herein and the Company cannot be held responsible for any omission, mistake nor for any loss or damage including without limitation to any loss of profit which may arise from reliance on any information supplied by TFA Global Pte Ltd.
The speaker(s) is neither an employee, agent nor representative of Tradu and is therefore acting independently. The opinions given are their own, constitute general market commentary, and do not constitute the opinion or advice of Tradu or any form of personal or investment advice. Tradu neither endorses nor guarantees offerings of third-party speakers, nor is Tradu responsible for the content, veracity or opinions of third-party speakers, presenters or participants.

AUDUSD BULLISH RUNAUDUSD is expected to buy to complete the Deep crab pattern. With higher than expected CPI figures AUD is expected to bully the green-back which is struggling with low interest rate figures as a result of declining inflation figures nearing its 2024 inflation target of 2% and global trade wars.
expecting AUDUSD to hit around0.66000 psychological level

Week of 6/1/25: AU AnalysisA lot of consolidation from the prior week, all time frames are technically bullish and internal 1h structure is bullish. I am going to be cautious around the current level until there is a prime entry model to get in long.
Major news:
PMI - Monday
PMI/ADP NFP - Wed
Unemployment Claims - Thurs
NFP/Unemployment rate - Friday

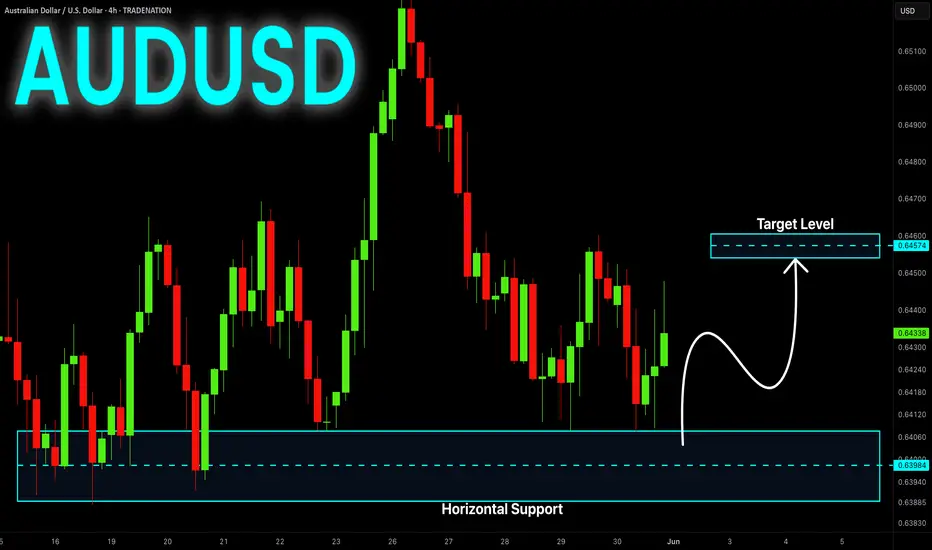
AUD_USD POTENTIAL LONG|
✅AUD_USD fell down sharply
But a strong support level was hit around 0.6400
Thus as a rebound is already happening
A move up towards the target of 0.6463 shall follow
LONG🚀
✅Like and subscribe to never miss a new idea!✅
Disclosure: I am part of Trade Nation's Influencer program and receive a monthly fee for using their TradingView charts in my analysis.

AUDUSD: weekly analysis Jun 1, 2025 – Jun 7, 2025Trump administration makes traders follow trades every single political news. Unpredictable about everything, if I want to describe the U.S president in one phrase. one day he decides to reduce tariffs, the other day he increases. One day wishes a good future for Iran, the other day he threatens Islamic republic with bombing. The same story with Russia, China and everything expects the Crypto. Okay let's get back to Aussie! any good news about China-Australia relations will increase the AUD.
The other important news this week is quarter to quarter GDP of the land of kangaroos.
After all, taking a look at weekly chart! A bullish week is more possible
*******************************************************************
The indicated levels are determined based on the most reaction points and the assumption of approximately equal distance between the zones.
Some of these points can also be confirmed by the mathematical intervals of Murray.
You can enter with/without confirmation. IF you want to take confirmation you can use LTF analysis, Spike move confirmation, Trend Strength confirmation and ETC.
SL could be placed below the zone or regarding the LTF swings.
TP is the next zone or the nearest moving S&R, which are median and borders of the drawn channels.
*******************************************************************
Role of different zones:
GREEN: Just long trades allowed on them.
RED: Just Short trades allowed on them.
BLUE: both long and short trades allowed on them.
WHITE: No trades allowed on them! just use them as TP points

AUDUSD Support & Resistance LevelsThese zones have been generated using a custom-built software tool, developed and refined over an extended period of time. The tool is the result of dedicated effort and research, aiming to identify high-probability support and resistance areas with precision.

Final BTCUSD update..Good day traders, here is my final update on BTCUSD and I like how price has been respecting our PD arrays. Keep in mind traders price moving in waves and what again😂😂🏃🏾♂️, point is today is the last trading day for the week and my thoughts is that we can expect BTCUSD to start going higher today and tomorrow maybe till Tuesday …sorry I’m being too sure but if you focus on time and price you start to KNOW(ledge) things or maybe I should say secrets?!🤨🤔
I always expect price to manipulate higher if my bias is shorts, ICT’s power of 3 works wonders when it come to this thought process.
Watch how price reacts to the FVG where price is trading now, it’s not a signal just watch out price moves always from it for the rest of today.
We only going high to shoot lower…keep that in mind!!🤯

AUD-USD Rebound Ahead! Buy!
Hello,Traders!
AUD-USD made a retest
Of the horizontal demand
Area around 0.6394 and
We are already seeing a
Nice bullish reaction from
The level so we are locally
Bullish biased and we will
Be expecting a further
Local bullish move up
On Monday
Buy!
Comment and subscribe to help us grow!
Check out other forecasts below too!
Disclosure: I am part of Trade Nation's Influencer program and receive a monthly fee for using their TradingView charts in my analysis.
GBPJPY update!!Good day traders, I’m back with yet another beautiful setup on GJ and I really wish we can all monitor how price plays out and learn more about price signature.
For this setup I’ll explain more about it after the fact because it’ll help me make my point clearer and easily understandable.
Yet another gift..🎁🧧

AUD/USD Price Action Analysis – Range Trading Opportunity📉 AUD/USD Price Action Analysis – Range Trading Opportunity 🔁
⚙️ Market Structure Overview:
The AUD/USD pair is currently exhibiting a well-defined range-bound market structure between the Support Zone (0.63800 – 0.64000) and the Resistance Zone (0.65200 – 0.65400).
🟩 Support Zone
📍 Identified by multiple price rejections and bullish reversals (marked with ⬆️ arrows).
💡 This area represents strong buying interest, making it a potential long-entry zone on bullish confirmation.
🟥 Resistance Zone
📍 Marked by two sharp rejections (⬇️ arrows) and upper wicks.
💡 This zone has served as a supply area, where sellers overpower buyers, signaling potential short opportunities.
🔄 Current Scenario:
Price is approaching the support zone again after rejecting the resistance area. Based on historical behavior:
📉 Short-term Bearish Momentum is in play until support is tested.
📈 Potential Bullish Reversal is likely if support holds — aligning with previous bounce behavior.
🔮 Trade Ideas:
📈 Bullish Setup:
📍Entry: Near support zone (~0.63850)
🎯Target: Resistance zone (~0.65250)
🛑Stop-loss: Below support (~0.63650)
📉 Bearish Setup (Breakdown Scenario):
📍Entry: On confirmed break below support (~0.63800)
🎯Target: Lower structure zones (TBD based on breakout leg)
🛑Stop-loss: Above broken support
📅 Key Risk Events:
🔔 Multiple high-impact USD and AUD economic events approaching.
🧭 Traders should monitor fundamentals closely for increased volatility and breakout potential.
🧠 Summary:
📌 The AUD/USD pair is currently respecting a range-bound structure.
🧱 Buying from support and selling from resistance remains the most probable high-probability strategy.
📊 Range trading suits this setup until a confirmed breakout or breakdown occurs.
🔔 Like & Follow for more clean, structured trade setups and zone-based price action ideas!

AUDUSD INTRADAY sideways consolidation supported at 0.6360The AUD/USD pair maintains a bullish bias, underpinned by a steady rising trend on the higher timeframes. However, recent intraday price action shows consolidation, indicating a pause in upward momentum as the market awaits a fresh catalyst.
Key Technical Levels:
Support:
0.6360 – Critical near-term support and prior consolidation zone. A successful retest could reinforce the bullish setup.
0.6320 – Next support level; a break below 0.6360 may trigger a deeper pullback.
0.6280 – Broader downside support zone; loss of this level would signal a shift in trend.
Resistance:
0.6500 – Primary upside target on continuation of bullish momentum.
0.6530 – Secondary resistance; break above would confirm strength.
0.6570 – Long-term resistance zone; potential target if bullish momentum accelerates.
Technical Outlook:
A pullback to 0.6360 followed by a bullish rebound would suggest continuation of the current uptrend, opening room for gains toward 0.6500, 0.6530, and 0.6570 over the medium term. On the downside, a daily close below 0.6360 would invalidate the bullish setup, exposing the pair to a potential decline toward 0.6320 and 0.6280.
Conclusion:
AUD/USD remains in a bullish structure, but near-term direction depends on the 0.6360 level. A rebound from support keeps the upside scenario in play, while a confirmed break lower may lead to a corrective retracement. Traders should watch for price behavior around 0.6360 for confirmation of the next move.
This communication is for informational purposes only and should not be viewed as any form of recommendation as to a particular course of action or as investment advice. It is not intended as an offer or solicitation for the purchase or sale of any financial instrument or as an official confirmation of any transaction. Opinions, estimates and assumptions expressed herein are made as of the date of this communication and are subject to change without notice. This communication has been prepared based upon information, including market prices, data and other information, believed to be reliable; however, Trade Nation does not warrant its completeness or accuracy. All market prices and market data contained in or attached to this communication are indicative and subject to change without notice.

AUDUSD Will Explode! BUY!
My dear followers,
I analysed this chart on AUDUSD and concluded the following:
The market is trading on 0.6420 pivot level.
Bias - Bullish
Technical Indicators: Both Super Trend & Pivot HL indicate a highly probable Bullish continuation.
Target - 0.6455
About Used Indicators:
A super-trend indicator is plotted on either above or below the closing price to signal a buy or sell. The indicator changes color, based on whether or not you should be buying. If the super-trend indicator moves below the closing price, the indicator turns green, and it signals an entry point or points to buy.
Disclosure: I am part of Trade Nation's Influencer program and receive a monthly fee for using their TradingView charts in my analysis.
———————————
WISH YOU ALL LUCK

EURUSD,GBPUSD and AUDUSD Analysis todayHello traders, this is a complete multiple timeframe analysis of this pair. We see could find significant trading opportunities as per analysis upon price action confirmation we may take this trade. Smash the like button if you find value in this analysis and drop a comment if you have any questions or let me know which pair to cover in my next analysis.
