Aurobindo Pharma picking up momentum.Aurobindo Pharma Ltd. engages in the manufacturing of generic pharmaceuticals and active pharmaceutical ingredients. It operates under the following geographical segments: India, USA, Europe, and Rest of the World. Its portfolio includes antibiotics, anti-retroviral, cardiovascular, central nervous system, gastroenterological, anti-allergies, and anti-diabetics.
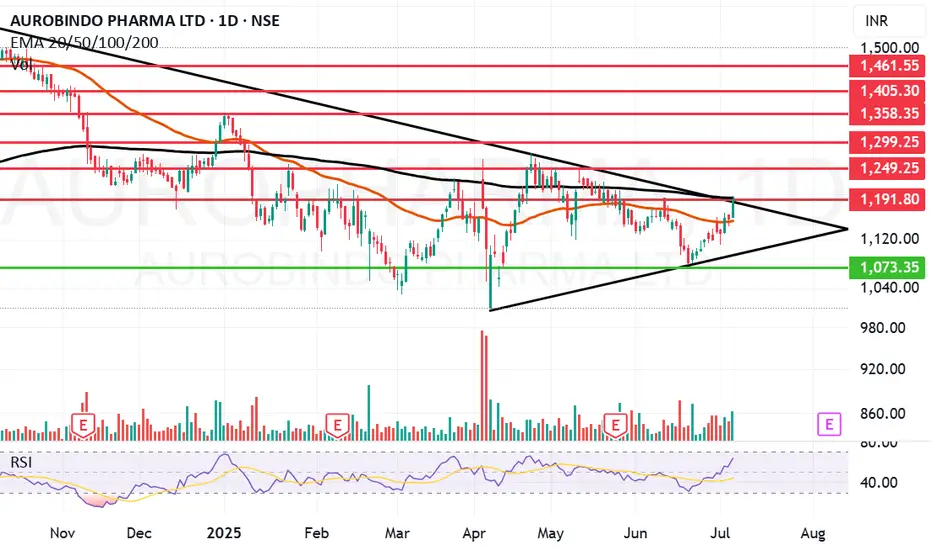
Aurobindo Pharma Ltd. Closing price is 1191.30. The positive aspects of the company are moderate Valuation (P.E. = 19.8), Strong cash generating ability from core business - Improving Cash Flow from operation, Companies with Low Debt, FII / FPI or Institutions increasing their shareholding, RSI indicating price strength and MFs increased their shareholding last quarter. The Negative aspects of the company are Stocks Underperforming their Industry Price Change in the Quarter and High promoter stock pledges.
Entry can be taken after closing above 1192 Historical Resistance in the stock will be 1249, 1299 and 1358. PEAK Historic Resistance in the stock will be 1403 and 1461. Stop loss in the stock should be maintained at Closing below 1073 or 986 depending upon your risk taking ability.
Disclaimer: The above information is provided for educational purpose, analysis and paper trading only. Please don't treat this as a buy or sell recommendation for the stock or index. The Techno-Funda analysis is based on data that is more than 3 months old. Supports and Resistances are determined by historic past peaks and Valley in the chart. Many other indicators and patterns like EMA, RSI, MACD, Volumes, Fibonacci, parallel channel etc. use historic data which is 3 months or older cyclical points. There is no guarantee they will work in future as markets are highly volatile and swings in prices are also due to macro and micro factors based on actions taken by the company as well as region and global events. Equity investment is subject to risks. I or my clients or family members might have positions in the stocks that we mention in our educational posts. We will not be responsible for any Profit or loss that may occur due to any financial decision taken based on any data provided in this message. Do consult your investment advisor before taking any financial decisions. Stop losses should be an important part of any investment in equity.
AUROPHARMA
AUROPHARMAPerfect bounce from OB at 1185-1205
Also support in golden fib zone (985-1580)
Entry - 1225 - 1230
SL - 1170 - 1175
T1: 1400
T2: 1550
DISCLAIMER: Not financial advice. Only for educational purposes.
Invest at your own risk

Stock Analysis Report: Aurobindo Pharma Ltd.Overview:
The chart presents a technical analysis of Aurobindo Pharma Ltd. on a daily timeframe. The stock shows a recovery pattern with a visible RSI divergence, indicating a potential bullish reversal.
Key Observations:
1.RSI Divergence:
A bullish divergence is identified as the price made lower lows while the RSI formed higher lows, signaling waning bearish momentum and the likelihood of an upward move.
2.Critical Support Levels:
Immediate support is marked at ₹1,273.35, corresponding to the 200-day moving average.
A strong base exists at ₹1,199.40 and ₹1,101.55, which acted as previous demand zones.
3.Potential Resistance Zones:
Initial resistance levels are observed at ₹1,310.80 and ₹1,346.60.
Major resistance is seen at ₹1,403.25 and ₹1,450.35, where the stock could face selling pressure.
4.Buying Strategy:
Enter long positions only if the price stabilizes above ₹1,273.35, confirming support.
Watch for a breakout above ₹1,310.80 for momentum trades targeting higher resistance levels.
5.Volume Analysis:
Increased volume on recent upward moves supports the bullish sentiment.
Monitor volume patterns for confirmation of breakouts or trend reversals.
Conclusion:
Aurobindo Pharma shows signs of a potential bullish reversal. Traders should closely observe the ₹1,273.35 support level and enter only upon confirmation. Targets are placed at ₹1,310.80, ₹1,346.60, and beyond. Implement proper risk management to account for potential volatility.

AUROPHARAM Swing Long SetupEnter only when 15minute candle closes above the Entry Zone Price - 1461.70
Target with Risk to reward 1:2 is 1571.1
Stoploss only when 1 day candle closes below the price - 1407
Note: This is not any financial advice, this is for education purpose only.

AUROPHARMA Ready for a Breakout!📈 Bullish momentum building with strong trendline support
🔥 Watch for breakout above ₹1,585.20
🎯 Next targets: ₹1,625 🚀

Auro Pharma - Bullish Harami - Daily Time Frame#AuroPharma
PCR : 0.78
Daily Volume : ++ 2.8x
Daily Fut OI change : +2.3
ATM IV : 27.6 (+1.5)
IVP : 16

Aurobindo Pharma: Bullish Breakout with Strong UptrendAurobindo Pharma (CMP 1465) has displayed a bullish breakout, continuing its strong uptrend since February 2023. The ascending trend line is well-supported by good volume.

AUROPHARMA
NSE:AUROPHARMA
One Can Enter Now !
Or Wait for Retest of the Trendline (BO) !
Or wait For better R:R ratio !
Note :
1.One Can Go long with a Strict SL below the Trendline or Swing Low.
2. R:R ratio should be 1 :2 minimum
3. Plan as per your RISK appetite and Money Management.
Disclaimer : You are responsible for your Profits and loss, Shared for Educational purpose

Aurobindo pharma 23 July 2024If daily price close below channel trendline then it's tend to be bearish otherwise you can continue your upside ride until price touch upper fib sequence.

book profit in Aurobindo Pharma or take short position?
After around 3 months, sell signal is showing on Aurobindo pharma. If not short, i think the stock holders should book profit, and if it goes up further for next couple of weeks, then definitely take a short position for gain of around 10%.

CNXPHARMA - Trend Reversal 📊 Script: CNXPHARMA (NIFTY PHARMA)
Key highlights: 💡⚡
📈 Nifty Pharma is retesting from its support level shown in chart.
📈 Pharma stocks can give good returns.
📈 One can go for Swing Trade into Pharma stocks.
📊 Script: CIPLA
⏱️ C.M.P 📑💰- 1414
🟢 Target 🎯🏆 - 1510
📊 Script: LUPIN
⏱️ C.M.P 📑💰- 1688
ONLY ABOVE 1700
🟢 Target 🎯🏆 - 1828
📊 Script: AUROPHARMA
⏱️ C.M.P 📑💰- 1177
🟢 Target 🎯🏆 - 1267
📊 Script: GLAND
⏱️ C.M.P 📑💰- 1177
🟢 Target 🎯🏆 - 1267
📊 Script: BIOCON
⏱️ C.M.P 📑💰- 1177
🟢 Target 🎯🏆 - 1267
⚠️ Important: Always maintain your Risk & Reward Ratio.
✅Like and follow to never miss a new idea!✅
Disclaimer: I am not SEBI Registered Advisor. My posts are purely for training and educational purposes.
Eat🍜 Sleep😴 TradingView📈 Repeat 🔁
Happy learning with trading. Cheers!🥂

Auropharma giving positive vibes on Hourly and Fifteen mins TFAuropharma is looking on the verge of a breakout due to following reasons:
1. Monthly, Weekly, Daily, Hourly RSI >60.
2. Ascending Triangle formation on hourly/ 15mins chart.
3. 15mins RSI is flirting around 60 which shows the underlying strength.
4. Volume profile shows accumulation is almost complete at slightly lower levels.
5. Underlying current in the pharma sector.
6. Underlying strength in the stock market.

AUROBINDO PHARMAThis stock breakout ATH level TGT will be 1466,2114 and SL will be 962 and this is only for educational purpose only

SHORT TERM TRADE >> SHORT AUROPHARMA at current levels ~ 882SHORT AUROPHARMA at current levels ~ 882 for targets 810 and then 720 over the next few weeks.. stock broke a rising wedge pattern and gave confirmation.. 20% downside is easy.. Short Short Short!!

#PANACEABIO 165 Buy Recommended- Rachit Sethia PANACEABIO 165
NSE:PANACEABIO
TARGET 225
SL 135
Return 36%
TIME FRAME < 6 Months
RR > 2
Factors: BULLISH WEDGE BREAKOUT Trend Following Rising Volume with rising Prices. Flag pattern breakout. Pennant Pattern Breakout with Bullish Candle. Retest Successful. Higher Highs & Higher Lows. Broken above RESISTANCE levels Trading at SUPPORT levels Earnings are strong. Bullish Wedge Breakout Risk Return Ratio is healthy. And Rising from Double Bottom Pattern to Flag Pattern forming. If you like my work KINDLY LIKE SHARE & FOLLOW this page for free Stock Recommendations. With 💚 from Rachit Sethia

Long AUROPHARMA for a multi-year bull-runLong AUROPHARMA at current levels 400-410 for long term returns over longer time frames; Targets 750-925-1300. NSE:AUROPHARMA

{AUROPHARMA}:{HIGH RETURN TRADE }
Price is retracing into a Daily Demand and there is a 1H Demand coincided with the Daily Demand which makes this 1H Demand a Special Demand

Long in AUROPHARMAAfter Aug 2021 this stocks again start trading upper side of 200EMA.
First Target : 730
Second Target : 906


Aurobindo pharma 1hrAurobindo pharama is looking good for tomorrow price breaked the range and made retest
if price breaks the crucial support and sustain hoping that price will give good bullish moment
Have a profitable trade
Thank you

AUROPHARMA : flag pattern in 1HAUROPHARMA given breakout of Flag pattern in 1 hour chart. good R:R even best if we get retest and then bull candle can be best choice to enter in trade
#AUROPHARMA
Levels are marked on chart for intraday. Follow price action and become Price action chart Specialist.
Like, Share, Comment for regular updates.
Disclaimer
I am not sebi registered analyst
My studies are Educational purpose only
Please consult with your Financial advisor before trading or investing
I may be 100% wrong as its my personal trade.
First Learn and then remove "L"

#DIVISLAB #TORNTPHARM #ALKEM #AUROPHARMA #BIOCON #LUPIN #CIPLA #DIVISLAB
NSE: DIVISLAB
CMP: 3498
TP: 4200
SL: 3300
TF: <6m
RR > ~3.4 times
Return > 20%
THYROCARE CNXPHARMA LUPIN SUNPHARMA SPARC DIVISLAB DRREDDY AUROPHARMA BALPHARMA GLENMARK SANOFI PFIZER BPLPHARMA MARKSANS BIOCON GRANULES IPCALAB LAURUSLABS NATCOPHARM GLAND ALKEM ZYDUSLIFE APOLLOHOSP FORTIS AARTIDRUGS ZYDUSWELL MAXHEALTH BAJAJHCARE
Factors:
BULLISH WEDGE BREAKOUT
Trend Following
Rising Volume with rising Prices.
Flag pattern breakout.
Pennant Pattern Breakout with Bullish Candle.
Retest Successful.
Higher Highs & Higher Lows.
Broken above RESISTANCE levels
Trading at SUPPORT levels
Earnings are strong.
Bullish Wedge Breakout
Risk Return Ratio is healthy.
And
Rising from Double Bottom Pattern to Flag Pattern forming.
If you like my work KINDLY LIKE SHARE & FOLLOW this page for free Stock Recommendations.
With 💚 from Rachit Sethia

#BIOCON #LUPIN #DIVISLAB #ALKEM #IPCALAB #GRANULES #AUROPHARMA#BIOCON
NSE: BIOCON
CMP: 267
TP: 320
SL: 250
TF: <6m
RR > 4 times
Return > 20%
THYROCARE CNXPHARMA LUPIN NSE:CIPLA SUNPHARMA SPARC DIVISLAB DRREDDY AUROPHARMA BALPHARMA GLENMARK SANOFI PFIZER BPLPHARMA MARKSANS BIOCON GRANULES IPCALAB LAURUSLABS NATCOPHARM GLAND ALKEM ZYDUSLIFE
Factors:
BULLISH WEDGE BREAKOUT
Trend Following
Rising Volume with rising Prices.
Flag pattern breakout.
Pennant Pattern Breakout with Bullish Candle.
Retest Successful.
Higher Highs & Higher Lows.
Broken above RESISTANCE levels
Trading at SUPPORT levels
Earnings are strong.
Bullish Wedge Breakout
Risk Return Ratio is healthy.
And
Rising from Double Bottom Pattern to Flag Pattern forming.
If you like my work KINDLY LIKE SHARE & FOLLOW this page for free Stock Recommendations.
With 💚 from Rachit Sethia
