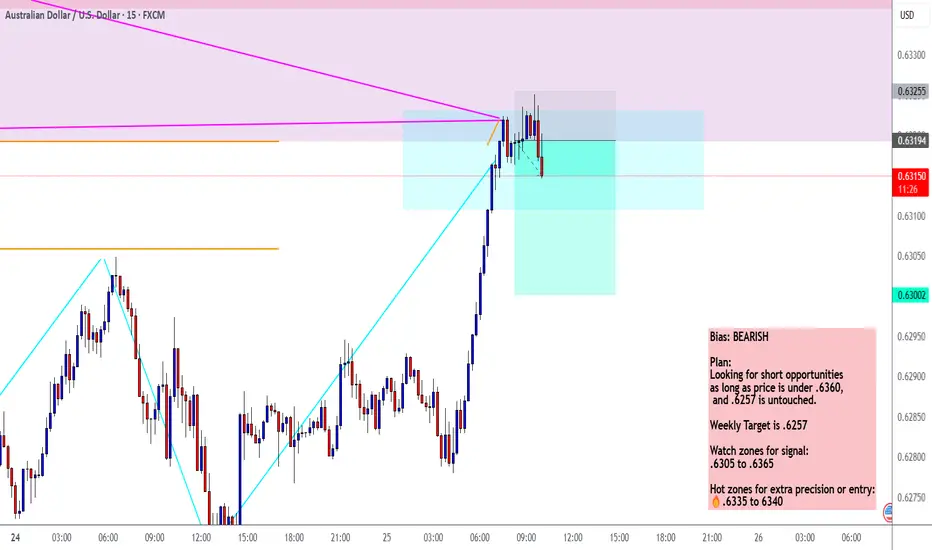
Bearish divergence, bigger number not always better for housingFull disclosure I got Ai to compose this because I'm dyslexic and a scatter brain.
and this is a duplicate because I tried to delete it once I found out it scaled bad on mobile, and trading views delete function MIA! ( within the cool down ) go figure.
I definitely have a bias to btc and maybe a long position on the JPY. Have a read have a look.
I have loosely marked some economic data on here showing Policy might not be working well enough because wages didn't keep up with CPI causing a real value losses after 2022.
I have supplied the ratio chart for gold as a indicator at the top.
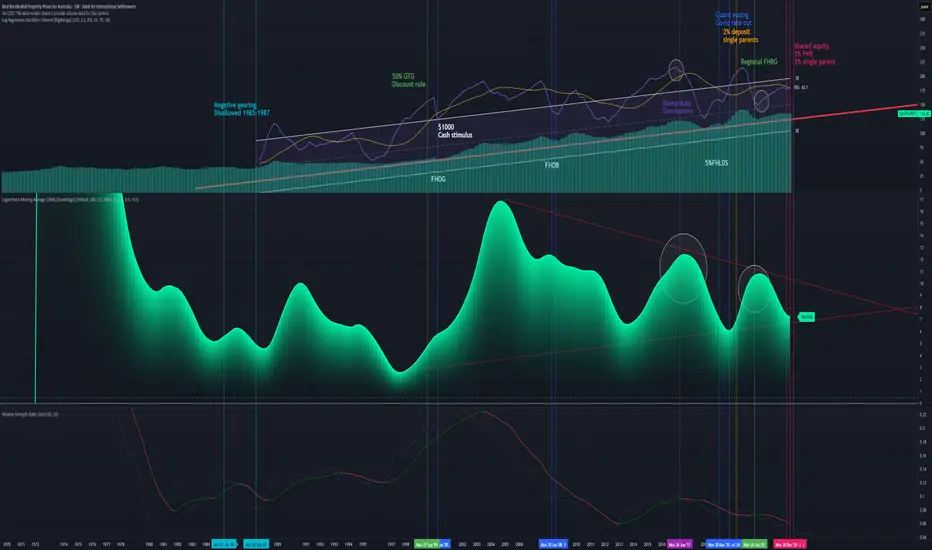
Structural Policy Drivers (The Cause of the Bull Trend)
These points explain why the long-term trend line (the logarithmic regression) slopes upward:
1. The Foundation of Investment (1999): The introduction of the 50% Capital Gains Tax (CGT) Discount in September 1999 was the single most powerful structural stimulus. It transformed property investment (combined with Negative Gearing) into the primary wealth-creation strategy, ensuring sustained investor demand.
2. GFC Policy Proof (2008-2009): The market's low point during the GFC was immediately arrested by the First Home Owners Boost (FHOB) and broad cash payments (October 2008). This showed that the government would deploy massive, rapid stimulus to prevent a structural price fall, reinforcing investor confidence.
3. The Liquidity Flood (March 2020): The RBA's emergency COVID Rate Cuts and Quantitative Easing (QE) injected unprecedented liquidity, creating the conditions for the most recent Nominal Higher High.
II. The Bearish Divergence Signal (The Warning)
These points explain why the recent peak is weak and unsustainable:
4. Technical Exhaustion: The Bearish Divergence observed between the Nominal HPI Price (making a \text{Higher High} in 2022) and the RSI/Momentum (making a \text{Lower High}) signals that the momentum required to sustain the uptrend is exhausted.
5. The Illusion of Value: The Nominal Higher High is highly misleading. When adjusted:
Purchasing Value: The Price-to-Income Ratio reached a \text{record high} (\sim 8.0 times income), meaning the price peak was actually a Lower Low in affordability.
Real Value: When measured in Ounces of Gold, the HPI peaked at a massive Lower Low (\sim 206 ounces in 2024 vs. \sim 874 ounces in 2004), demonstrating the fragility of AUD-denominated property wealth.
III. The Policy Constraint (The System Strain)
These points explain the high risk and fragility of the current market:
6. Diminishing Returns: The market required the extreme, combined stimulus of near-zero rates (RBA) and low-deposit guarantees (5% FHB schemes}) to reach its 2022 peak. The Bearish Divergence confirms this level of effort produced a historically weak momentum result, indicating policy inefficiency.
7. The Investor Exit Trigger: The current high interest rates and the {Lower Low in Purchasing Value} are highly likely to encourage a rotation of capital. A sell-off of just 5\% of investment equity (\approx \$104 Billion) could overwhelm {FHB} demand and force a Nominal Price Correction a {Lower Low}) by late 2026 / mid-2027.
8. The "Double Whammy" Risk: Recent low-deposit buyers face extreme risk: their equity is thin (vulnerable to price drops) while their debt servicing remains stretched, as large wage increases are structurally unlikely (due to the RBA's mandate to curb inflation).
🛑 INVESTMENT PROPERTY HEDGE: The Exit Strategy
This strategy is for owners of non-owner-occupied property facing the convergence of the {AU} Housing {Bearish Divergence} and the Global {JPY} Unwind.
✅ Core Hedges: Replacing Inefficient Investment Equity
The goal is to move capital from a low-momentum, illiquid, highly-taxed, AUD-denominated asset (investment property) into a high-liquidity, real-value store.
1. Physical Gold & Silver (The Devaluation Defense):
WHY: Gold is the essential hedge against the currency risk. Our analysis shows that your property's value has collapsed when measured in Gold {Lower Low} on the {House Price-to-Gold Ratio}). Converting illiquid property equity into physical metals protects wealth from the {AUD} devaluation caused by both domestic policy strain and global policy shocks.
Investment Action: This should be prioritized for preserving the real wealth that may be lost if Nominal {QAUR628BIS} corrects.
2. Defensive Japanese Yen {JPY}) Exposure:
WHY: This is the most direct hedge against the global liquidity shock. The {JPY} is the "funding currency" for the global risk trade. When the carry trade unwinds, investors must buy {JPY} to repay their debt, causing a sharp appreciation. This {JPY} strength would directly offset losses incurred by the domestic housing slowdown.
Investment Action: Provides protection against the {2026-2027} global market crash that the {JPY} unwind is predicted to trigger.
3. Bitcoin (The Non-Sovereign Liquidity Drain):
WHY: Bitcoin provides the fastest, most tax-efficient (long-term {CGT} relief applies) exit route for capital leaving a strained domestic financial system. It is the perfect liquid asset to absorb the {\$104B} of equity that a 5\% investor sell-off would create.
Investment Action: A strategic allocation here hedges against both {AUD} devaluation and the systemic policy risks you've identified.
❌ Liabilities to AVOID: The System's Vulnerabilities
1. Australian Bank Stocks {CBA, Westpac, etc.}):
WHY NOT: Their fate is tied to your property's mortgage risk. The {Bearish Divergence} on the (QAUR628BIS) directly increases their credit risk. The {JPY} unwind will also hurt them by disrupting global financial stability and reducing lending capacity. They are a concentrated liability.
2. Leveraged US Stock Indices {S\&P 500/Nasdaq}):
WHY NOT: The {US} market is a primary target of the {JPY} carry trade unwind. Leveraged investors will be forced to sell these high-performing assets to close their debt positions, leading to a non-fundamental, sharp correction. The risk of sudden {JPY}-driven liquidation is too high.
Thanks for reading I made this for my Father who recently had to ( forced hand) purchase another home (above what he lived for "reasons") convinced cash and the property are safe and cannot afford to lose more money.
Leave a comment for him.
Or add to the conversation share your own views.
Aussiedollar
Is Morgan Stanley right about NZD?With the RBNZ set to deliver its Monetary Policy Statement this week, Morgan Stanley sees the New Zealand dollar recovering as growth stabilises. Technically, NZD/USD is sitting right on the edge of its potential correction zone, holding above the recent 0.5485 low. A bounce into 0.5650–0.5700 is on the table if buyers protect this level. A clean break under 0.5485 could reopen downside risk.
AUD/NZD remains firmly in an uptrend. Price is consolidating above the 1.14 breakout, and the Fib circle projections from the chart point toward an extension into the 1.1650–1.1700 region if momentum builds. Morgan Stanely expects the Australian dollar to keep outperforming. Stronger Australian data and higher migration flows continue to widen the gap between the two economies, favouring further gains in AUD/NZD.

Could this week’s RBNZ cut mark the peak in AUD/NZD? Is it too early to call the Aussie dollar peaking against the New Zealand dollar? Several analysts suggesting the AUD/NZD rally is losing momentum ahead of this week’s Reserve Bank of New Zealand decision.
Markets expect the RBNZ to deliver a 25-basis-point cut, taking the Official Cash Rate to 2.25%.
Strategists at Bank of New Zealand and National Australia Bank say the currency pair, which recently traded near decade-high levels, may start to retreat toward 1.14 if the RBNZ indicates it is close to ending its easing cycle.
Technical signals could be reinforcing the idea that AUD/NZD may be nearing a turning point. A bearish candlestick resembling a shooting star formed on 13 November, a pattern often associated with reversals after extended uptrends.
Still, not all factors favour the kiwi. Australia maintains a sizable rate advantage over New Zealand

+80...The Aussie Dollar hasn't fulfilled bearish objectives yetAUDUSD hasn't taken that strong draw on liquidity which is the H4 Iow that shows many rejections candles. Until that happens, I'm still bearish on the Aussie Dollar.
Our first setup gave us 80 pips but hopefully, this new setup goes straight to TP.

Can The Yen Fight Inflation While Rates Stay Low?The AUD/JPY currency pair's surge above 101.00 is a direct result of two opposite forces. The Australian Dollar (AUD) is strong because inflation is unexpectedly high, forcing the RBA to keep its interest rate at 3.60%. This high rate attracts global investment, as traders move money to Australia for better returns. Meanwhile, the Japanese Yen (JPY) is weak because the BoJ maintains an extremely low interest rate, near zero, to boost its economy. This wide gap in rates makes the AUD/JPY a favorite for the "Carry Trade," where investors earn the difference, pushing the pair higher.
Beyond just interest rates, geopolitics is playing a crucial role. The recent US-China trade deal, which saw a truce on certain tariffs and export controls on rare earth minerals, strongly benefits the commodity-linked AUD. Australia is a major exporter of these minerals. This trade calm reduces global risk and boosts demand for Australian goods. Conversely, the JPY suffers from political choices, as Japan's new government plans aggressive spending. This combination of low rates and high spending ensures the JPY remains weak, reinforcing the strong case for continued AUD/JPY strength.

MASTERCLASS: INTRADAY & SWING TRADE AUDUSD 🦘 AUDUSD (0.66112) - COMPREHENSIVE TECHNICAL MASTERCLASS: INTRADAY & SWING TRADE BLUEPRINT 🦘
October 27-31, 2025 | Advanced Multi-Timeframe Trading Forecast
🎯 MARKET OVERVIEW & ANALYSIS SCOPE 🎯
Current Spot Price: 0.66112 | Analysis Date: Oct 25, 2025 | Timeframes: 5M-1D Complete Spectrum | Trading Style: Intraday Scalp + Swing Trade | Conviction: Medium-High
━━━━━━━━━━━━━━━━━━━━━━━━━━━━━━━━━
📊 1. MULTI-TIMEFRAME TREND STRUCTURE & DOW THEORY VALIDATION 📊
🔍 Daily (1D) Timeframe - Primary Market Direction
The 1D chart exhibits mixed consolidation with bearish undertone . Dow Theory framework shows LOWER HIGHS pattern emerging (0.6640 → 0.6620 → 0.6615), signaling potential downtrend initiation. Elliott Wave structure suggests completion of 5-wave impulse (up) targeting reversal near 0.6580-0.6600 levels. RSI reading 48-52 (neutral zone, showing weakness as bearish bias forms). VWAP at 0.6605 acting as temporary support with breach implications downward.
⏰ 4H Timeframe - Swing Trade Risk Structure
Four-hourly demonstrates bearish flag formation with downside target potential . Price consolidating below 0.6625 resistance after failed breakout attempts. Bollinger Bands tightening (squeeze pattern)—volatility expansion imminent. RSI declining from 55 to 48 range (bearish momentum deterioration). Ichimoku Cloud configuration: price trapped between Kijun-sen (resistance) & Senkou Span B (dynamic support)—indecision zone. Downside target: 0.6580-0.6560.
🔥 1H to 5M Intraday Setup - Micro Timeframe Dynamics
One-hour shows head-and-shoulders pattern developing with neckline at 0.6610. Left shoulder complete (0.6625), head forming (0.6620), right shoulder declining (0.6618). Harmonic pattern: Bearish Bat identified at 0.6595 (D-point) suggesting short entry opportunity. 30M timeframe displays EMA50 crossing below EMA200 (bearish crossover just initiated). Volume declining on attempted rallies = selling pressure dominance. 5M shows bear trap formation near 0.6625—trapping bullish retailers before reversal.
━━━━━━━━━━━━━━━━━━━━━━━━━━━━━━━━━
🎯 2. ENTRY & EXIT PROTOCOL + WYCKOFF DISTRIBUTION PHASE 🎯
SWING TRADE SHORT ENTRIES (4H/1D): Sell breakdown below 0.6610 (H&S neckline) with stop @ 0.6635 (Risk:Reward 1:3 minimum). Wyckoff Distribution phase activated—institutional selling pressure accumulating. Target: 0.6560-0.6540 (swing trade 3-5 days hold).
INTRADAY SHORT SCALPS (5M/15M/30M): Multiple entry opportunities: (1) Head-and-shoulders neckline break = 0.6610 entry | (2) Bearish Bat PRZ completion = 0.6595-0.6590 aggressive short | (3) EMA crossover rejection on 30M = 0.6615-0.6620 pullback short entry.
PRIMARY PROFIT TARGETS: 1D: 0.6560 | 4H: 0.6575 | 1H: 0.6600 | 30M: 0.6610 (quick 15-20 pip scalp gains) | Extended: 0.6540 (major support level).
STOP LOSS PLACEMENT STRATEGY: Swing shorts: 0.6640 (above H&S left shoulder) | Intraday: 0.6625 (tight 15-20 pip stops) | Trail stops below Bollinger Band upper band as price descends.
💡 Pro Trading Tip: Use Ichimoku Kijun-sen (26-period) as dynamic resistance/stop level. Lock profits at each support zone identified via Gann angles.
━━━━━━━━━━━━━━━━━━━━━━━━━━━━━━━━━
⚡ 3. REVERSAL SIGNALS & JAPANESE CANDLESTICK PATTERN ANALYSIS ⚡
✅ BEARISH REVERSAL CONFIRMATIONS:
Engulfing pattern visible on 30M chart—red candle engulfing previous green (seller dominance confirmed). Shooting star candlestick near 0.6625 (failed rally rejection). Dark cloud cover pattern on 1H signals seller takeover at highs. Head-and-shoulders neckline (0.6610) acts as critical reversal zone. Ichimoku Chikou Span trading BELOW price action = confirmed bearish structure. Stochastic showing bearish divergence (lower highs on RSI/price higher highs).
⛔ BULLISH REVERSAL WARNINGS & BULL TRAP IDENTIFICATION:
Bull trap currently IN PROGRESS near 0.6625 resistance—retailers buying resistance, institutions distributing. If price breaks above 0.6630 with declining volume, false breakout confirmed. Morning Star pattern absent—no reversal higher probability. VWAP rejection combined with closing below 0.6610 = strong bearish confirmation. Gann resistance at 0.6640 acts as major distribution zone where selling accelerates.
⚠️ CRITICAL LEVEL: 0.6610 (H&S neckline) = REVERSAL THRESHOLD. Break below = Bearish Continuation | Hold above with volume = Bull trap intact
━━━━━━━━━━━━━━━━━━━━━━━━━━━━━━━━━
🔴 4. BREAKDOWN DYNAMICS & BEARISH PATTERN FORMATIONS 🔴
✅ PRIMARY BEARISH BREAKDOWN SCENARIO (65% PROBABILITY):
Head-and-shoulders breakdown below 0.6610 neckline on 1H timeframe with volume confirmation (need 20%+ volume spike below average). Elliott Wave target: 0.6540-0.6500 (5th wave decline in new downtrend cycle). Bollinger Band lower band at 0.6560 = natural extension target. Measured move from pattern: H&S height (0.6625-0.6610 = 15 pips) projected downward = 0.6595 target.
🔷 HARMONIC PATTERN PRECISION DOWNSIDE TARGETS:
Bearish Bat pattern (XA:BC 0.618) D-point entry: 0.6595 with target 0.6540 (161.8% extension downward). Bearish Butterfly on 4H suggesting potential extended move to 0.6480 (extreme scenario). Crab pattern confluence identifies 0.6570 as intermediate support-bounce zone.
⚠️ BULLISH PATTERN - FALLING WEDGE (BULL TRAP) (35% PROBABILITY):
If price holds above 0.6610, 4H chart displays falling wedge formation that could breakout bullishly to 0.6650+. Stochastic confluence on 1H indicates potential bounce setup. However, volume analysis suggests limited upside conviction. Bear trap possible if institutions accumulate after distribution climax. Watch for climactic volume spike—wedge collapse likely either direction.
━━━━━━━━━━━━━━━━━━━━━━━━━━━━━━━━━
📉 5. VOLATILITY METRICS & PRICE ACTION COMPRESSION 📉
🌊 Bollinger Bands - Critical Squeeze Signal:
Band width compressing to 180 pips on 1D (lowest in 12 days)—explosive volatility breakout imminent within 36-48 hours. Intraday Bollinger Bands (5M/15M/30M) showing initial expansion toward lower band—bearish volatility thesis strengthening. Price approaching lower Bollinger Band (0.6580) = oversold setup potential or trend continuation signal depending on volume.
📍 SUPPORT & RESISTANCE ARCHITECTURE:
MAJOR RESISTANCE ZONES: 0.6630 (Bull trap distribution level) | 0.6625 (Recent swing high) | 0.6640 (Gann angle resistance) | 0.6650 (Weekly pivot)
CRITICAL SUPPORT LEVELS: 0.6610 (H&S neckline/VWAP area) | 0.6595 (Harmonic D-point) | 0.6575 (4H support) | 0.6560 (Bollinger lower band) | 0.6540 (Major support)
VWAP PROFILE: Daily VWAP: 0.6605 (trending downward) | Weekly VWAP: 0.6615 (secondary resistance)
📊 Moving Average Divergence - Bearish Alignment:
EMA 50 below EMA 200 on 1H/4H (bearish structure forming). SMA 20 crossing below SMA 50 on 30M = momentum deterioration signal. 5M chart: EMA50 recently crossed below EMA200—intraday downtrend initiation confirmed. Price trading BELOW all major moving averages = weakness confirmed. Wyckoff Distribution phase in progress—institutional selling continuing.
🎯 OVERBOUGHT/OVERSOLD CONDITIONS & MOMENTUM EXHAUSTION:
RSI Status: 48-52 range (neutral sliding toward oversold)—RSI approaching 40 = potential for capitulation move lower. Stochastic on 15M: Declining from 55 toward 30 zone = bearish momentum acceleration. Ichimoku RSI below midline transitioning lower—downside potential significant. CCI on 5M declining below zero (strong bearish momentum without extreme oversold exhaustion). Fast Stochastic declining toward 20 level—room for extended downside run.
━━━━━━━━━━━━━━━━━━━━━━━━━━━━━━━━━
🎓 6. ADVANCED TECHNICAL THEORY INTEGRATION & FRAMEWORKS 🎓
⭐ ELLIOTT WAVE STRUCTURE: 5-wave impulse (up) completed near 0.6625 | Wave A (down) declining toward 0.6595-0.6540 | Correction target: 50% retracement = 0.6575 | Extended target: 161.8% extension = 0.6480 maximum (9-12 trading days)
⭐ GANN THEORY APPLICATION: 45-degree angle resistance @ 0.6640 (broken support becomes resistance) | Square of Nine support @ 0.6540 | Time-Price intersection: 6-8 trading days for major swing completion | Gann fan support @ 0.6560
⭐ WYCKOFF METHODOLOGY - DISTRIBUTION PHASE: Spring pattern failed (no spring reversal) = Distribution confirmation | Markup phase ended, Distribution phase INITIATED | Test & Decline pattern active = institutional distribution continuing | Expected breakdown: 0.6595-0.6540 over 5-7 trading days | Climax alert: Watch for volume spike + wide range candle = distribution completion
⭐ DOW THEORY BEARISH CONFIRMATION: Lower highs: 0.6640 → 0.6625 → 0.6620 | Lower lows: 0.6590 → 0.6585 | Volume declining on rallies = downtrend validation | Trend now firmly bearish-biased
━━━━━━━━━━━━━━━━━━━━━━━━━━━━━━━━━
✨ COMPLETE TRADING ACTION PLAN ✨
🔴 PRIMARY BEARISH SCENARIO (65% Probability):
Entry Zone: 0.6610 (H&S breakdown) or 0.6615-0.6620 (pullback short)
Stop Loss: 0.6640 | Target 1: 0.6595 | Target 2: 0.6575 | Target 3: 0.6560
Risk/Reward: 1:3+ | Hold Duration: Swing (3-5 days) + Intraday scalp (1-3 hours)
Conviction Level: 65% | Setup Quality: Premium Bearish | Volume: Confirming
🟢 SECONDARY BULLISH SCENARIO (35% Probability - Contingency):
Trigger: Hold above 0.6625 + Stochastic bounce + Volume expansion upward
Entry: 0.6630 long | Stop: 0.6610 | Target: 0.6650 (bounce setup only)
Probability: 35% (Lower conviction bull trap risk) | Pattern: Falling wedge breakout
⏱️ TIMEFRAME STRATEGY HIERARCHY: 1D (macro structure) + 4H (swing foundation) + 1H (entry confirmation) + 15M/5M (execution precision)
💰 POSITION SIZING & RISK RULES: Risk max 1-2% portfolio per trade | Scale shorts on 50% pullbacks toward 0.6625 | Trail stops above Bollinger upper band
🔔 PRICE ALERT SYSTEM: Sell signal @ 0.6610 (neckline break) | Stop loss alarm @ 0.6640 | Take profit 1 @ 0.6595 | Full target @ 0.6560 | Extended @ 0.6540
📱 EXECUTION BLUEPRINT: Aggressive breakdown entries (30% position) + Patient pullback shorts (70% position) = risk-balanced approach | Scale out profits at each support zone
⚠️ RISK MANAGEMENT: Bull trap alert at 0.6625-0.6630 | Volume confirmation mandatory on entry | Trail stops religiously | Close to breakeven if volume fails
━━━━━━━━━━━━━━━━━━━━━━━━━━━━━━━━━
⚖️ COMPLIANCE DISCLAIMER: This analysis provided for educational & information purposes ONLY. NOT financial/investment advice. All trading carries substantial risk of loss. Trade only with capital you can afford to lose. Always implement proper risk management. Consult qualified financial advisors before trading. Past performance ≠ future results. Markets unpredictable.

BEARFlAG Aussie Against the Pound Hey Guys,
The Aussie seems to have broken the Bear flag against the British pound providing a good short entry with a .90 stoploss and a over 10% take profit target great risk to reward. that stop loss is supported by the confluence of the trendline becoming resistance, the 100sma and the previous high. This is also a continuation of the larger decline against the pound that broke out December last year
see picture below
Do your own research

AUD/USD Longer term OutlookHey Guys,
This is a follow up the the Short Term outlook I posted to show you the bigger picture of what happening. If you haven't checked out that short term thesis I suggest you do to understand why i think in the near term why there will be a decline possibly down to .50.
As I'm sure most people are aware there is abit of fear on the longer term of the debasement of the USD, as we have massive debts and deficits which are highly unlikely to get any better soon. This is ultimately lead to its decline relative to other assets think current rise in GOLD. If we have a recession from slower growth from tariffs, regional banks and private credit going bad and the consumer becoming too squeezed then this budget with get much worse as they will try and stimulate the economy to ease some of these pressure. But as a consequence this will lead to inflation and more debasement just like the 60s - 80s period. Each time they try and rein in inflation growth will slow so they will simulate resulting in the cycle continuing.
Now if the "debasement" continues this doesn't mean the USD will die get replace but it does mean other assets and currencies that aren't having this systemic problem will rise relative to the dollar again just like the 1960s-1980s. Australia has had long running fiscal conservative budgets and most definitely no debasing its currency. Our debt to Nominal GDP peak during covid and unlike most other economies has decreased since. Although we are projected to runn a deficit of A$10 billion our growth will more then out weigh this and this is such a small fraction to out A$1.752 trillion economy is a non factor really.
looking at some technicals on the charts we can see we have been in a falling wedge since the last "debasement" of the USD happened after the GFC. This will breakout sometime over the next two years as its running out of room. we have gaining strength on the RSI creating a divergence on the monthly also point to a breakout to the upside. we have clear outlined targets to hit on the way up and looking back again at previous debasement events by 2011 we were at $1.10 and by the 1975 we were at $1.49 so a return to these levels isn't without precedence.
I have shown with the green line the general direction of where i think it will be please dont take that as an exact model. This will take years to fully play out but if you understand even the most basic supply and demand , technical analyst and fundamental problem America is facing then it should keep you true.
Please check out the shorter outlook to gain a full picture and do you own research
here are some links to data used
www.ceicdata.com
data.worldbank.org

USD/AUD Short Term OutlookHey guys, This is a thesis I've had for quite some time but seems to be unfolding of late. With the talks and worries about the regional banks in America and the private credit companies loan books not looking good as the consumer is being squeezed from tariffs, higher interest rates, unemployment slowly ticking up and student debts having to be paid back again after credit growth soared after covid i feel we could see a recession hit the US sometime over the next year. I doubt it will be a collapse anything like 2008 or anything but even a slow down on growth and a pull back on spending could lead to big declines from these AI bubble fueled highs as P/E have risen way out of hand. Something like the 2000s seems more accurate to current conditions.
IF this thesis is right you will see marked declines in the AUD against the USD and i have laid out my first target of .60 as it fits the technical pattern and we have a confluence of support there. We have also recently rejected off the resistance lines, broken the rising wedge (RED Lines), slipped back under the 100SMA. This provides a great enter point with a tight stop loss and a clear take profit.
I will be posting my future outlook for the AUD so please check it out to get the bigger picture
Also do your own research

"AUD/USD Breakout | Bullish Robbery to Overbought Resistance"🚨💰🦘 AUD/USD "The Aussie" Forex Bank Heist 💰🚨
Oi mates & fellow market robbers! 🏴☠️💵
This is your Thief Trader breaking into the Aussie vault — and this time, the loot is in pips, not gold bars. 😎
💥 MISSION PLAN: Bullish raid with layered limit orders — stacking like a pro safecracker. No hesitation, no mercy. Entry? Any price the vault door swings open. 📈🔓
📍 ENTRY:
🎯 Slip in at ANY level, but a true thief knows how to wait for the pullback sweet spots. Layer the buys like bricks in a getaway tunnel.
🛑 STOP LOSS:
🚔 Park it at 0.64900 — our last escape hatch before the police sirens get too close.
🎯 TARGET:
💣 0.66200 — POLICE BARRICADE RESISTANCE ZONE 🚧🔥 Overbought territory where the getaway chopper is waiting.
📊 Why the Aussie vault is ripe for robbery:
Bullish momentum is loading up like a cash van before payday. 💵
Big players pushing price higher — we just tailgate the convoy. 🚚💨
Layering entries means more bags filled if the price dips before liftoff. 🛍️
⚠ Robbery Rules:
Avoid news time unless you love chaos. 📢
Keep SL tight and respect the plan — greedy thieves get caught.
Trailing stop = locking loot while the ride continues.
💖 Boost this heist plan if you’re rolling with the crew! 🚀💰 The more likes, the louder the sirens, the bigger the thrill.
🏆 Stay sharp, stay sneaky, and let’s rob the Aussie bank together! 🐱👤💸

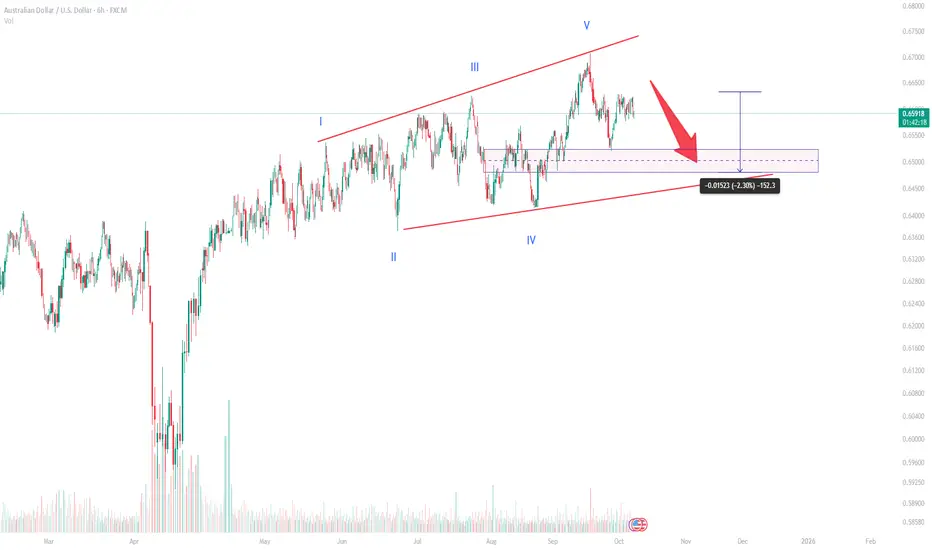
Rising Diagonal Pattern Near CompletionAUD/USD Elliott Wave Analysis – Rising Diagonal Pattern Near Completion
Overview
The AUD/USD pair has formed a clear ending diagonal pattern, signaling potential exhaustion of the current bullish trend. This structure, often seen at the final stage of an impulse wave, suggests that a corrective phase may soon follow. The diagonal appears complete with all five internal waves labeled (I-V), indicating that the market might be preparing for a deeper pullback.
Technical Analysis
According to the Elliott Wave structure visible on the 6-hour chart, AUD/USD completed its fifth and final wave near the 0.67 region. The wedge pattern is now narrowing, with bearish divergence hinting at weakening bullish momentum.
Wave Structure:
Wave I started the diagonal formation, initiating the rising trend.
Waves II and IV acted as corrections, forming higher lows.
Wave V extended slightly but failed to make a strong breakout, suggesting exhaustion.
The price currently trades near 0.6560, with a potential retracement zone between 0.6450 and 0.6500. This range coincides with a strong demand zone and the lower boundary of the diagonal pattern. A pullback into this area could complete the corrective (A)-(B)-(C) structure before the next major directional move.
Key Levels
Support Zone: 0.6450 – 0.6500
Immediate Resistance: 0.6650 – 0.6680
Breakout Confirmation: A sustained break below 0.6450 could confirm the end of the diagonal and open the door toward 0.63 in the medium term.
Invalidation: A breakout above 0.67 would invalidate the bearish correction scenario.
Market Outlook
The diagonal’s completion suggests that the pair may enter a short-term correction phase. However, traders should monitor price action near the support area before confirming the next trend direction. If buyers defend the 0.6450 zone, a rebound toward 0.6650 is likely. Conversely, a clear break below the wedge would strengthen bearish momentum.
Given the overall wave count, the market is likely in transition between an impulsive and a corrective phase. Patience is crucial at this stage, as the next few sessions will determine whether the larger uptrend resumes or a deeper retracement unfolds.
AUUDSD: Sells? Wait For It... Wait For It...!Sept 17 marked the Swing High, taking out buy side liquidity. We've been in retracement since then. The structure looks to be turning bearish. Combine that with the strength of the US Dollar versus the current weakness in the AUD... look for an opportunity to sell, my people.
Enjoy!
May profits be upon you.
Leave any questions or comments in the comment section.
I appreciate any feedback from my viewers!
Like and/or subscribe if you want more accurate analysis.
Thank you so much!
Disclaimer:
I do not provide personal investment advice and I am not a qualified licensed investment advisor.
All information found here, including any ideas, opinions, views, predictions, forecasts, commentaries, suggestions, expressed or implied herein, are for informational, entertainment or educational purposes only and should not be construed as personal investment advice. While the information provided is believed to be accurate, it may include errors or inaccuracies.
I will not and cannot be held liable for any actions you take as a result of anything you read here.
Conduct your own due diligence, or consult a licensed financial advisor or broker before making any and all investment decisions. Any investments, trades, speculations, or decisions made on the basis of any information found on this channel, expressed or implied herein, are committed at your own risk, financial or otherwise.

AUD/USD Rally Attempts, Will Buyers Stay in Charge?Market Analysis: AUD/USD Rally Attempts, Will Buyers Stay in Charge?
AUD/USD started a decent increase above 0.6580.
Important Takeaways for AUD USD Analysis Today
- The Aussie Dollar started a decent increase above 0.6545 against the US Dollar.
- There was a break above a contracting triangle with resistance at 0.6530 on the hourly chart of AUD/USD.
AUD/USD Technical Analysis
On the hourly chart of AUD/USD at FXOpen, the pair started a fresh increase from 0.6500. The Aussie Dollar was able to clear 0.6520 to move into a positive zone against the US Dollar.
The bulls cleared a contracting triangle with resistance at 0.6530. There was a close above the 0.6550 resistance and the 50-hour simple moving average. Finally, the pair tested 0.6585. A high was formed near 0.6588 and the pair recently started a consolidation phase.
There was a move below the 23.6% Fib retracement level of the upward move from the 0.6501 swing low to the 0.6588 high. On the upside, the AUD/USD chart indicates that the pair is now facing resistance near 0.6585.
An upside break above 0.6585 might send the pair further higher. The next stop is near 0.6640. Any more gains could clear the path for a move toward the 0.6700 handle.
On the downside, initial support is near the 50% Fib retracement at 0.6545. The next area of interest could be near the 50-hour simple moving average at 0.6535.
If there is a downside break below 0.6535, the pair could extend its decline toward the 0.6500 zone. Any more losses might signal a move toward 0.6485.
This article represents the opinion of the Companies operating under the FXOpen brand only. It is not to be construed as an offer, solicitation, or recommendation with respect to products and services provided by the Companies operating under the FXOpen brand, nor is it to be considered financial advice.

AUD eyes yield advantage over USD UBS strategists view the Australian dollar as a compelling long opportunity at current levels, supported by expectations that the Reserve Bank of Australia will ease policy more gradually than the U.S. Federal Reserve.
The bank forecasts 75 basis points of rate cuts from the RBA through Q1 2026, compared to 100 basis points from the Fed—helping to preserve a relative yield advantage for the Aussie.
On the daily chart, AUD/USD remains within a well-defined ascending channel that began in late 2024. The pair recently bounced off the lower boundary of the channel near 0.6450, with long lower wicks potentially indicating dip-buying interest.
Immediate resistance could sit at 0.6600, followed by a major zone near 0.6670. A break above these levels could confirm bullish continuation.

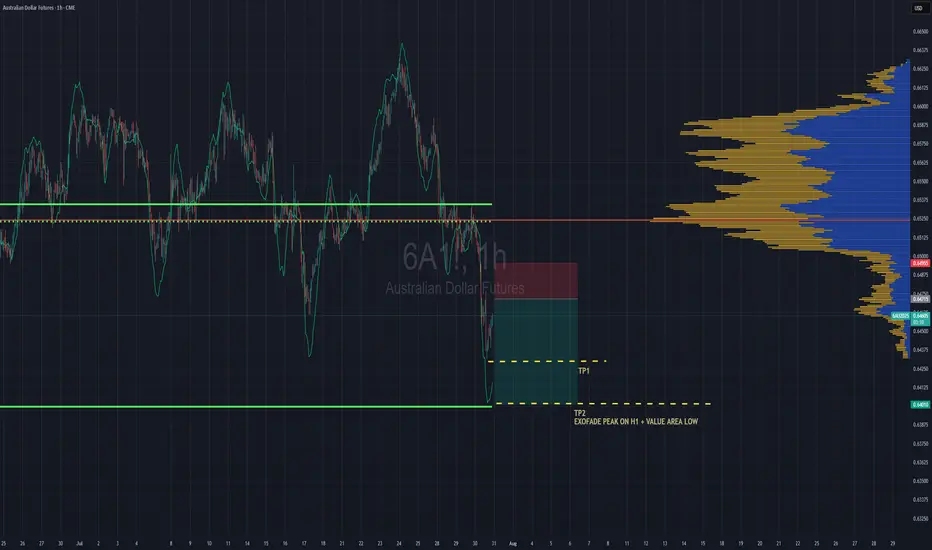
Aussie Shorts Looks Promising This is a pullback trend trade anticipating trend continuation. Entry is based on LVN (low volume node) for entry. Also looking on the footprint chart there is a high volume node with -ve delta that was traded at 0.64715.
If the sellers return to defend that price then this pullback should give some strong rejection once we pierce the entry zone and send bulls packing.
TP1 - First swing low
TP2 - Value area low of the range, which also is in confluence with the ExoFade peak on the 1HR timeframe. ExoFade peaks always gets taken out in a strong trend, that's why i love using them as price targets for exits. ExoFade is free on Tradingview for those curious about it. Just search for it.
AUDUSD: Dropping To the Weekly FVG, As Expected!In this video, we will analyze the following FX market for July 31 - Aug 1st.
AUDUSD
Been waiting and watching for this move, and we've tracked it for weeks! It's happening now!
Look for it to continue until we reach the +FVG!
Enjoy!
May profits be upon you.
Leave any questions or comments in the comment section.
I appreciate any feedback from my viewers!
Like and/or subscribe if you want more accurate analysis.
Thank you so much!
Disclaimer:
I do not provide personal investment advice and I am not a qualified licensed investment advisor.
All information found here, including any ideas, opinions, views, predictions, forecasts, commentaries, suggestions, expressed or implied herein, are for informational, entertainment or educational purposes only and should not be construed as personal investment advice. While the information provided is believed to be accurate, it may include errors or inaccuracies.
I will not and cannot be held liable for any actions you take as a result of anything you read here.
Conduct your own due diligence, or consult a licensed financial advisor or broker before making any and all investment decisions. Any investments, trades, speculations, or decisions made on the basis of any information found on this channel, expressed or implied herein, are committed at your own risk, financial or otherwise.

AUDUSD: Sell The Rip!Welcome back to the Weekly Forex Forecast for the week of July 21-25th.
In this video, we will analyze the following FX market:
AUDUSD
AUDUSD has been difficult to trade, as it chops its slow grind upwards. Last week it gave a bearish close. With the USD expected to continue to gain strength, look for sells directed to the liquidity lows in AUDUSD.
Enjoy!
May profits be upon you.
Leave any questions or comments in the comment section.
I appreciate any feedback from my viewers!
Like and/or subscribe if you want more accurate analysis.
Thank you so much!
Disclaimer:
I do not provide personal investment advice and I am not a qualified licensed investment advisor.
All information found here, including any ideas, opinions, views, predictions, forecasts, commentaries, suggestions, expressed or implied herein, are for informational, entertainment or educational purposes only and should not be construed as personal investment advice. While the information provided is believed to be accurate, it may include errors or inaccuracies.
I will not and cannot be held liable for any actions you take as a result of anything you read here.
Conduct your own due diligence, or consult a licensed financial advisor or broker before making any and all investment decisions. Any investments, trades, speculations, or decisions made on the basis of any information found on this channel, expressed or implied herein, are committed at your own risk, financial or otherwise.

AUDUSD Cautiously Bullish As US PI Data Looms This is the Weekly FOREX Forecast for the week of July 14 - 18th.
In this video, we will analyze the following FX market: AUDUSD
The AUDUSD has been grinding higher for weeks. Only Friday closed with a hint of a pullback starting. The RBA is looking for the US CPI Data to post. If the inflation numbers are a bit hot, this will strengthen the USD against the AUD. A soft CPI should see the market pricing back in higher chances of a third cut by year-end and weigh on the US dollar.
We'll see how the market reacts on Tuesday.
Enjoy!
May profits be upon you.
Leave any questions or comments in the comment section.
I appreciate any feedback from my viewers!
Like and/or subscribe if you want more accurate analysis.
Thank you so much!
Disclaimer:
I do not provide personal investment advice and I am not a qualified licensed investment advisor.
All information found here, including any ideas, opinions, views, predictions, forecasts, commentaries, suggestions, expressed or implied herein, are for informational, entertainment or educational purposes only and should not be construed as personal investment advice. While the information provided is believed to be accurate, it may include errors or inaccuracies.
I will not and cannot be held liable for any actions you take as a result of anything you read here.
Conduct your own due diligence, or consult a licensed financial advisor or broker before making any and all investment decisions. Any investments, trades, speculations, or decisions made on the basis of any information found on this channel, expressed or implied herein, are committed at your own risk, financial or otherwise.

AUSSIE BANK ROBBERY: AUD/USD Bullish Breakout Confirmed!🔥 AUD/USD BANK HEIST: The Ultimate Bullish Robbery Plan (Thief Trading Style) 🔥
🌟 ATTENTION, MONEY MAKERS & MARKET ROBBERS! 🌟
💸 MISSION BRIEF:
Based on Thief Trading Style (technical + fundamental analysis), we’re executing a bullish heist on AUD/USD ("The Aussie")—time to steal those pips like a pro!
📈 ENTRY STRATEGY (The Heist Begins!)
Long Entry Trigger: Wait for Dynamic Resistance MA crossover + candle close above 0.65300 (bullish confirmation).
Pro Tip: Use Buy Stop orders above MA or Buy Limit orders on pullbacks (15m/30m timeframe).
🔔 SET AN ALERT! Don’t miss the breakout—alert up, gloves on!
🛑 STOP LOSS (Protect Your Loot!)
"Yo, rookie! 🗣️ If you’re entering on breakout, DO NOT set SL before confirmation!
📍 Thief SL Placement: Nearest 4H swing low (0.64800)—adjust based on your risk, lot size, & trade multiples.
⚠️ Warning: Deviate at your own peril—your risk, your rules!
🎯 TARGET (Cash Out & Run!)
Take Profit Zone: 0.65800
Scalpers: Long-only plays! Use trailing SL to lock profits.
Swing Traders: Ride the wave—big money moves require patience!
📰 FUNDAMENTAL BACKUP (Know Why We Robbin’!)
Bullish momentum fueled by macro trends, COT data, sentiment shifts.
🚨 Breaking News Alert: Avoid high-impact news spikes—trail SL or stay out!
💥 BOOST THE HEIST!
Hit 👍 LIKE, 🔄 SHARE & 🚀 BOOST—strengthen the robbery squad! More heists = more profits!
🤑 NEXT HEIST COMING SOON… STAY TUNED! 🐱👤

AUDUSD – Bearish Breakdown Below EMA Support🚀👆 Boost it if you like it...👆🚀
Price has broken decisively below the EMA cluster after consolidating in a tight range. The strong bearish candle suggests momentum toward lower support levels.
Trade Plan:
✅ Entry:
Current price ~0.65545
✅ Stop Loss:
Above 0.657722 (last minor swing high)
✅ Target:
0.65340 – 0.6500 area (previous demand and round number support)
Context:
• EMA confluence failure
• Clear bearish momentum candle
• Clean risk-to-reward setup
Risk Management:
Risk per trade: 1%
Hashtags:
#AUDUSD #ForexSignals #PriceAction #Breakdown #MJTrading #TradingIdea #Forex

AUDUSD - Resistance Test Points to Imminent Price CorrectionThe AUD/USD pair has shown impressive upside momentum in recent days, recovering sharply from its early April lows near 0.5900 to now testing the key resistance zone highlighted in blue around 0.6400. After such a substantial rally of approximately 500 pips, technical indicators suggest the pair is becoming overextended in the short term. We anticipate a corrective pullback as price encounters this significant resistance level, which previously acted as support in mid-March. This correction would be a healthy development within the broader market structure, potentially setting up better entry opportunities for those still bullish on the Australian dollar in the medium term.
Disclosure: I am part of Trade Nation's Influencer program and receive a monthly fee for using their TradingView charts in my analysis.

AUDUSD 110 buy setup!!The current market structure shows a strong alignment for a potential upward movement, forming a double bottom at a significant support level. This pattern respects both the structural levels and Fibonacci retracement levels. With important news scheduled for release today at 8 PM, particularly positive developments for the dollar could influence market direction. Given the risk-to-reward ratio, it appears favorable to consider positioning for an upward trend.
follow me for more breakdown

Short Idea - AUDUSDTrade entered. Entry rules met.
Confluences:
✅ Bearish overall bias
✅ Bearish demand zone
✅ Bearish ABCD extension pattern
✅ Bearish divergence
✅ Bearish break of structure
✅ Entering London close zone
✅ Price is in entry zone
✅ Required risk:reward met
⭐ I shared this watch zone in my weekly forex outlook this week, you can subscribe by clicking the link in my bio.