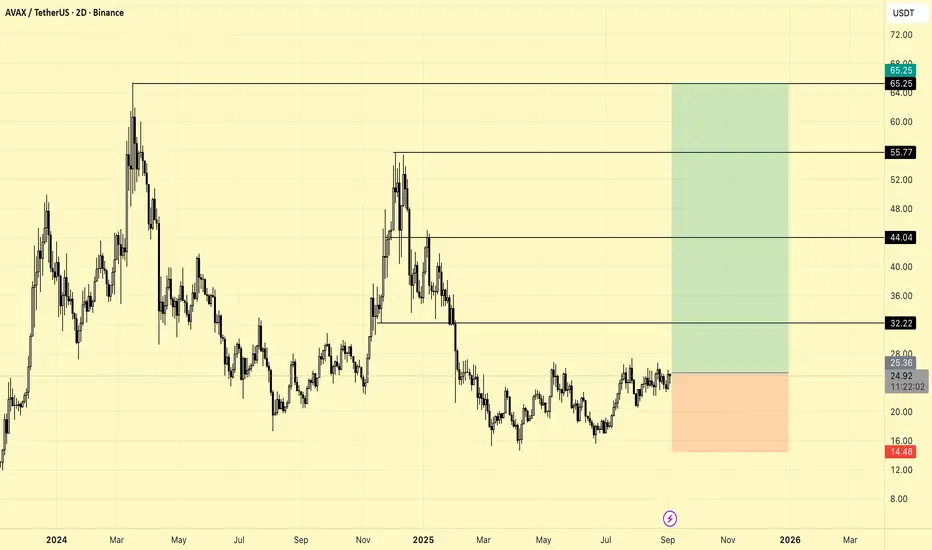
AVAX MID TERM TRADE IDEAKey Features and Explanation
Main support zone is marked at 14.48 USDT, indicating the stop-loss level for the setup.
Major resistance zones are drawn at 32.22, 44.04, 55.77, and 65.25 USDT as potential upside targets.
The green zone shows the reward/risk area for a bullish scenario, while the red zone visualizes the risk if price drops below support.
Current price is around 24.95 USDT, in a sideways consolidation near local resistance.
Trade Setup Summary
The chart captures a medium-term opportunity favoring a move up from the current range, aiming for the outlined resistance targets with managed stop-loss.
Level markings help define clear entries, exits, and targets for risk management.
Overall, this chart offers a structured technical outlook for AVAXUSDT, combining price levels with visual risk/reward parameters for effective trading assessment.
AVAXBTC
AVAXUSDT UPDATE#AVAX
Update
AVAX Technical Setup
Pattern: Falling Wedge Pattern
Current Price: $25.21
Target Price: $55.78
Target % Gain: 120%
Technical Analysis: AVAX has broken out of a falling wedge on the 1D chart, signaling strong bullish momentum. The breakout above resistance with solid structure confirms upside potential, pointing toward the $55.78 target area.
Time Frame: 1D
Risk Management Tip: Always use proper risk management.

AVAX Analysis (1D)From the point where we placed the red arrow on the chart, it seems a correction has begun.
This correction appears to be a Diametric pattern, and wave E does not seem to be complete yet. It's expected that wave E will finish within the green zone.
The target could be the red box area.
A daily candle closing below the invalidation level would invalidate this analysis.
invalidation level: 10.90$
For risk management, please don't forget stop loss and capital management
When we reach the first target, save some profit and then change the stop to entry
Comment if you have any questions
Thank You

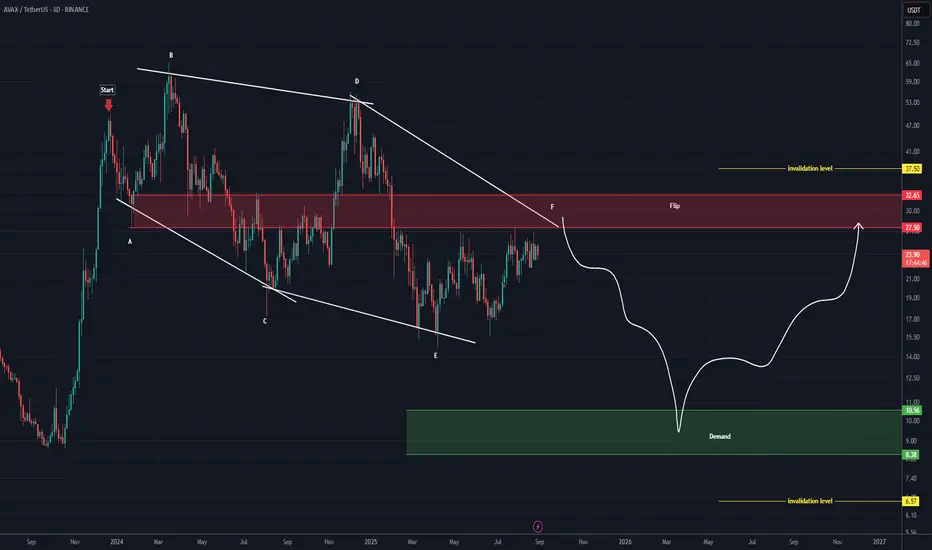
AVAX Analysis (3D)This analysis is an update of the analysis you see in the "Related publications" section
Before anything else, pay attention to the timeframe: it’s the 3-day timeframe.
The structure that AVAX is following is a large diametric, where wave F of this diametric is expected to end within the red-marked zone. After that, the price is anticipated to enter the bearish G wave.
Wave G could extend down to the main order block, which is the green-marked zone.
For both the bearish and bullish scenarios, the invalidation levels are marked on the chart. A daily candle closing above or below these levels will invalidate the respective outlook.
For risk management, please don't forget stop loss and capital management
Comment if you have any questions
Thank You
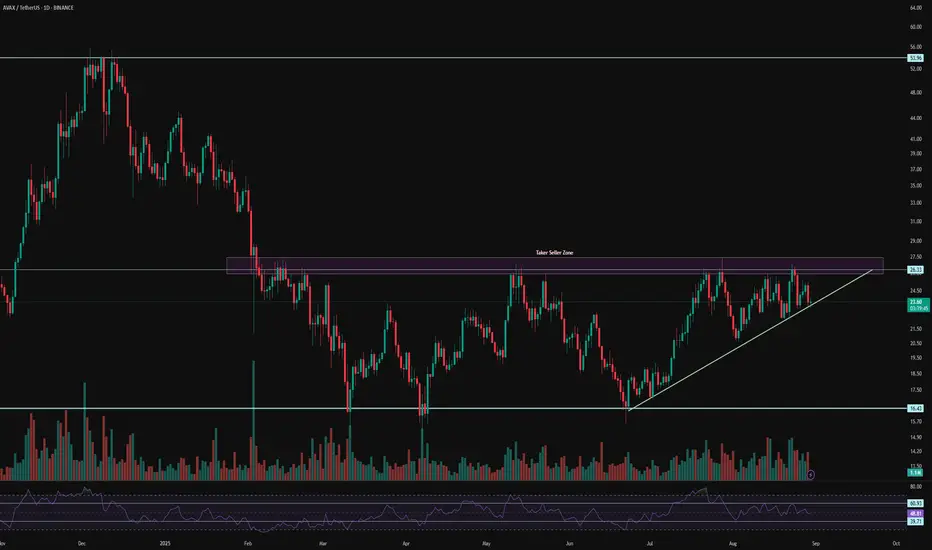
AVAX 1D Analysis – Key Triggers Ahead💀 Hey , how's it going ? Come over here — Satoshi got something for you !
⏰ We’re analyzing AVAX on the 1-Day timeframe timeframe.
👀 In the daily timeframe of AVAX, after the drop it experienced, AVAX entered a box with a long-term range. The ceiling and floor of this box are in the area of $16 and $26. The time range of this box or its length is almost 170 days. At the ceiling of this box, there are strong seller tickers that get their sell orders activated every time the price reaches this area. To break this zone and for a good rise of AVAX, we need a very strong and high-volume momentum that causes a price jump and fills the sell orders.
💰 In the daily timeframe of AVAXBTC we can see a relatively good compression formed in this area, and with the breakout of the Bitcoin ceiling, more Bitcoin will be converted into AVAX and it can be a good confirmation for a long position and some spot buying. The area considered for the alarm zone is 0.0002286.
⚙️ Two key areas for RSI have been considered. Passing the swing limits of 61 and 40 can bring good volatility to AVAX and help it break out of this RSI compression that is seen as a box.
🕯 The area considered as the seller ticker is a strong one, and every time the price reached this area, we faced selling pressure. The size of the green candles is also larger compared to the red candles, and each time the compression area became smaller and the price is ready for a breakout and reaction (not today but next week).
🔔 The area we considered as the alarm zone for AVAX is $26, and with the breakout of this area, AVAX can move towards higher price levels. Price behavior at $26 can give us complete awareness for trading.
❤️ Disclaimer : This analysis is purely based on my personal opinion and I only trade if the stated triggers are activated .
AVAXUSDT BINANCE:AVAXUSDT is ranging near 23.50, with support at 23.10 and resistance at 26.53. Momentum leans bearish, and losing 23.10 could target 21.20, while holding it may trigger a bounce.

AVAX: GOOD PRICE!!!Hello friends
Given the arrival of buyers and the good price growth, now that we are in a price correction, there is a good opportunity to buy in steps in the specified areas with risk and capital management and move towards the specified goals.
*Trade safely with us*

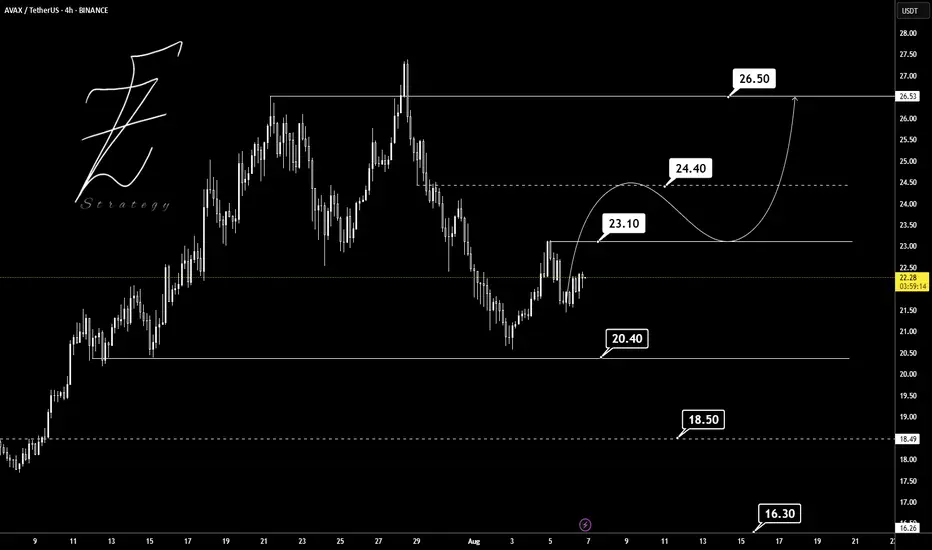
AVAXUSDT The overall trend of BINANCE:AVAXUSDT on the 4H timeframe shows signs of a potential bullish reversal, as a higher low has formed around the 20.40 support level after a strong downtrend. Currently, the price is ranging between the key support at 20.40 and the resistance at 23.10. A breakout above 23.10 could push the price toward the next major resistance at 24.40, which is a critical decision zone for the market. If buyers maintain momentum and break above 24.40, the next bullish target will be around 26.50 ✅ However, if the 20.40 support fails to hold, lower supports at 18.50 and 16.30 may come into play. The momentum currently leans slightly bullish, but price behavior between 23.10 and 24.40 will determine the next strong move. 📊
Key Support & Resistance Levels:
Supports: 20.40 – 18.50 – 16.30
Resistances: 23.10 – 24.40 – 26.50
Always remember to manage and control your risk properly. 🔒
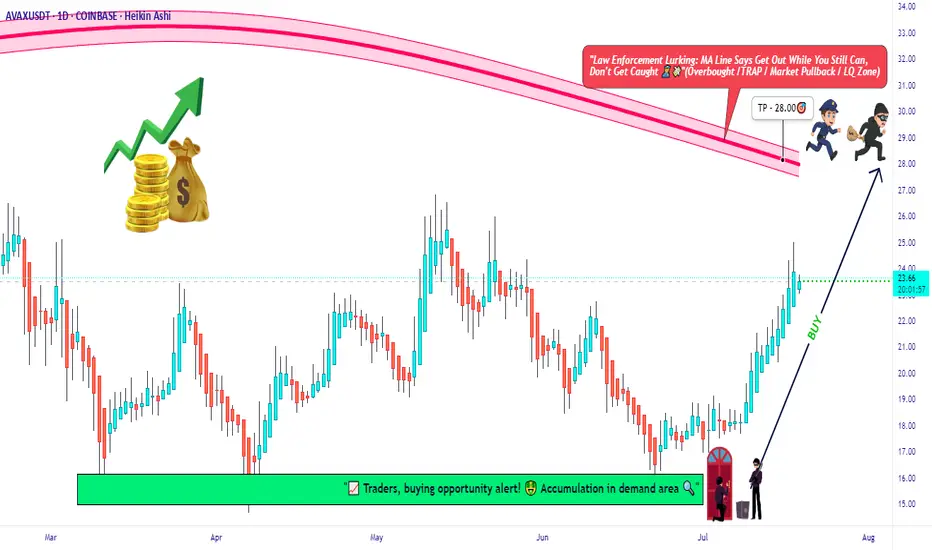
AVAX Long Only | Moving Average Trap Heist in Action🧨“Avalanche Crypto Vault Break-In 💣 | Thief Trader’s Long Playbook”⚔️💸🚀
(AVAX/USDT Crypto Heist Plan – Swing/Day Trade Blueprint)
🌍 Hi! Hola! Ola! Bonjour! Hallo! Marhaba! 🌟
Welcome, Money Makers, Market Pirates, and Chart Snipers! 🤑💰💼✈️
This ain’t just another setup — this is a strategic crypto ambush on AVAX/USDT, cooked up with the 🔥 Thief Trading Playbook 🔥. We're planning a clean, no-fingerprint heist into the Red Moving Average Zone. That’s the liquidity vault, and yes — the police (market makers) are watching 👮♂️🚨... but so are we. Stay sharp. 💼🔦
💥 Mission Objectives:
🎯 Entry Point (The Infiltration Point)
"The vault's wide open! Swipe the Bullish loot at any decent price" 📈
Smart thieves wait for pullbacks on the 15m or 30m chart to plant their limit orders near swing lows/highs. Use layered orders (DCA style) to scale in like a pro. 💣🔁
🛑 Stop Loss (Your Getaway Exit)
Secure your trade. SL at the nearest wick low/high on the 1D timeframe (around 21:00 candle).
Your SL = your personal risk code. Choose it based on lot size & how deep you're inside the vault. 🎭🚫
🏴☠️ Take Profit Target (The Treasure Room)
🎯 Target: 28.00 USDT
...or escape early if the heat (volatility) gets too intense. Protect the bag. 💼💰
⚡ Special Note for Scalpers:
🧲Only operate on the Long Side.
If you’ve got deep pockets, smash in directly. Otherwise, ride with swing bandits. Use trailing SL to secure stolen profits. 🧨📉📈
🔍 Market Heat Map & Rationale:
The AVAX/USDT setup is flashing bullish strength, backed by:
🧠 On-Chain Metrics 📊
💡 Market Sentiment
📰 Macro Catalysts
🌐 Intermarket Synchronicity
📡 Go grab the full breakdown on:
⚠️ Red Alert: News Zones Ahead! 📰🚫
Avoid fresh trades during high-volatility news releases.
Lock in gains with trailing SL. Risk management is not optional — it’s the escape vehicle. 🚗💨
📝 Legal Talk (Don’t Skip):
This isn’t investment advice. Just a well-planned blueprint from a market thief.
You're responsible for your own loot and losses. 🎭📉📈
❤️ Boost the Brotherhood 💥
Smash the 🔥BOOST BUTTON🔥 if you found value.
Every boost powers our Thief Trading Gang’s next big score. 🚀💸
Stay tuned for the next heist plan. I’ll be back with more charts, more loot, and less mercy. 🐱👤📊💥
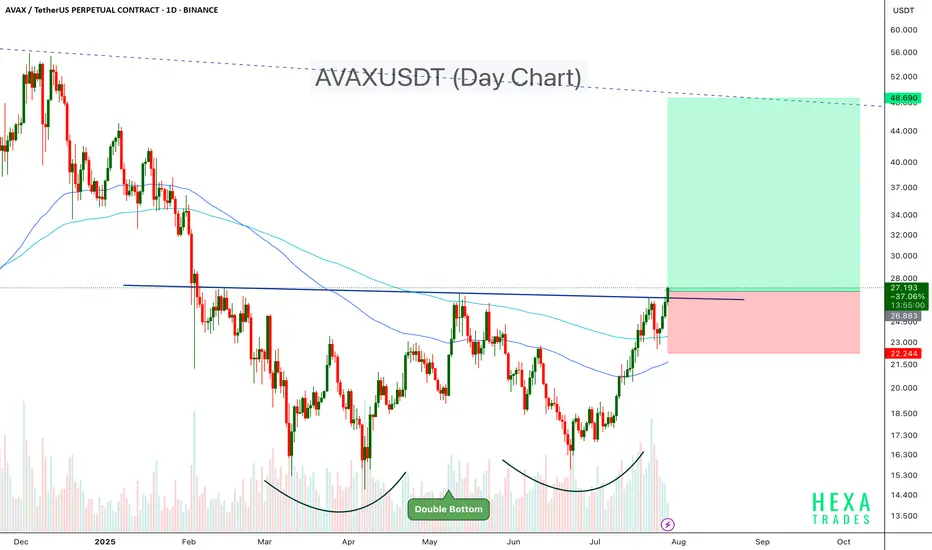
AVAXUSDT Double Bottom Confirmation.AVAX has formed a textbook double bottom pattern on the daily chart, signaling a potential reversal after months of downtrend. The neckline around the $27 zone has been broken decisively, confirming the bullish breakout.
Key Points:
- Double Bottom Structure: A strong bullish reversal pattern with a clean neckline breakout.
- Breakout Level: $27, which was acting as resistance for the past several weeks.
- Volume Surge: Noticeable increase in volume during the breakout, adding strength to the move.
- Target: $48–$50 region. ( Channel resistance)
-Stop-Loss Idea: Below $22.0
AVAX appears ready to trend higher as momentum builds. If bulls hold above the breakout zone, the rally may accelerate in the coming weeks.
Cheers
Hexa
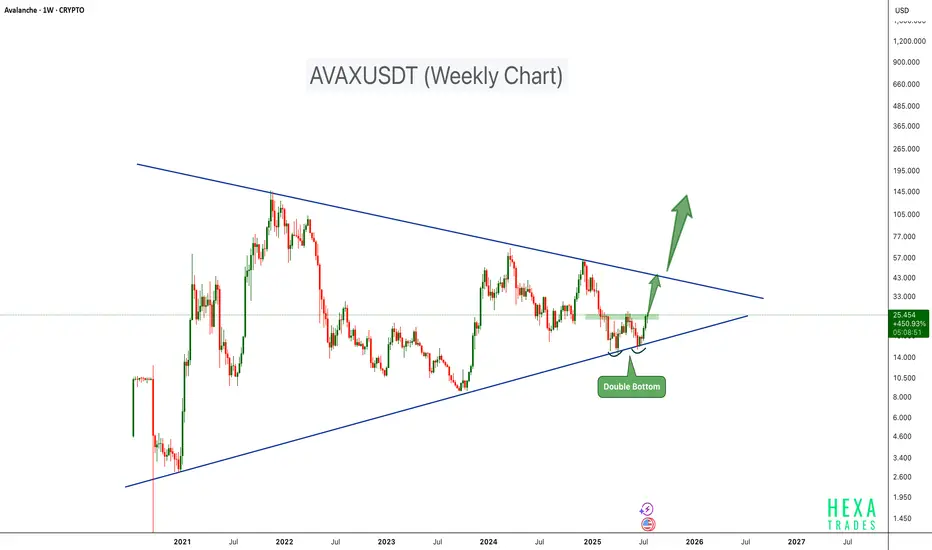
AVAX Bull Run Loading!AVAX is showing signs of a strong bullish setup on the weekly chart, forming a double bottom pattern right at the lower support trendline of a long-term symmetrical triangle. This technical formation often indicates a potential trend reversal when confirmed with breakout and volume support.
Key Points:
-Double Bottom Support around $12–$14 with bullish momentum.
-Symmetrical Triangle structure compressing price for breakout.
-Breakout Zone near $27, a close above this level may trigger strong upside.
-Upside Target: Short-term Target- $45; Long Term Target - $125
Invalidation: A Break below $15 support could negate the setup.
Cheers
Hexa
CRYPTOCAP:AVAX BINANCE:AVAXUSDT
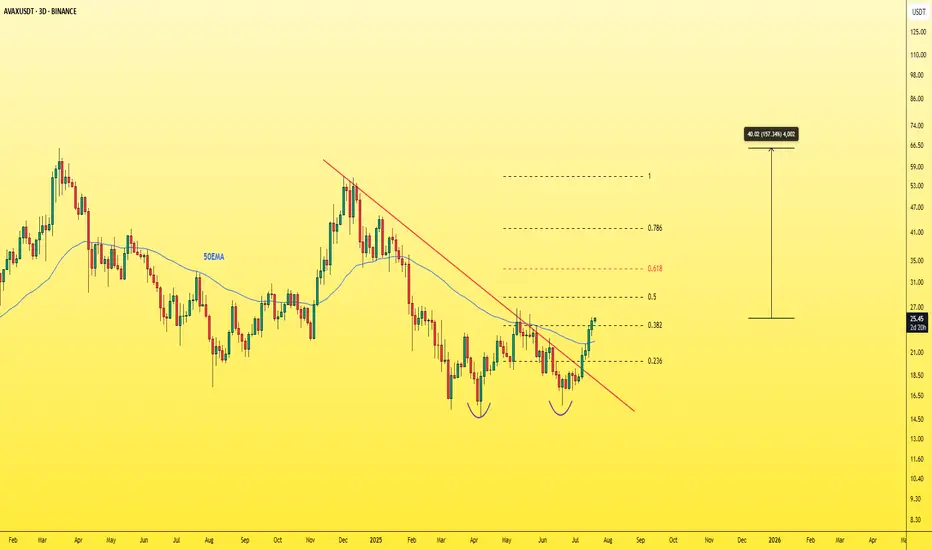
AVAXUSDT - THE real treasure must be hunted!Let's not forget about CRYPTOCAP:AVAX — it's one of the must-have assets in any crypto portfolio.
Currently trading at a discounted price after dropping from its previous top at $55, AVAX now shows strong bullish potential with plenty of upside ahead.
🚀 Key bullish signs:
-Successfully broke through multiple resistance levels, including the 0.382 Fibonacci retracement, 50 EMA, and the main descending trendline.
-A daily close above the 26$ level is a very positive signal.
With a solid project, reliable fundamentals, and low risk compared to potential reward, this could be a highly profitable opportunity.
Don’t sleep on it.🎯
AVAXUSDTWe are bear-trend but wait for break trendline and pollback to 18.50$.
BINANCE:AVAXUSDT
Support: 16.90
Resistance: 18.50 - 21.30 - 25.50
⚠️Control money management.

#AVAX/USDT#AVAX
The price is moving within a descending channel on the 1-hour frame and is expected to break and continue upward.
We have a trend to stabilize above the 100 moving average once again.
We have a downtrend on the RSI indicator that supports the upward move with a breakout.
We have a support area at the lower limit of the channel at 17.22, acting as strong support from which the price can rebound.
Entry price: 17.54
First target: 17.92
Second target: 18.22
Third target: 18.62

AVAX About to Nuke Longs Before Pumping to $30?Yello Paradisers — are you prepared for the next major #AVAX move, or will you once again fall into the trap smart money is setting right now? The chart is screaming probable bullish continuation, but not before one final trick to flush out weak hands. We warned you before — and now the game is unfolding exactly as expected.
💎#AVAXUSDT has clearly broken market structure by forming a higher high, confirming a potential trend shift. However, price failed to close above the 25.82–26.93 resistance zone, leaving the bullish breakout unconfirmed. This hesitation right at a critical level increases the probability of a fakeout or liquidity sweep before any continuation.
💎Right now, we are hovering just above the ascending trendline, and based on current structure, the most probable scenario is a sweep of that trendline liquidity, grabbing stops from impatient longs before the market forms a clean higher low and reverses aggressively to the upside.
💎The green zone around 22.00–23.00, which previously acted as resistance, has now flipped to support. As long as price holds above this level, the bullish probability remains dominant. However, if we see a temporary dip below the trendline toward the 19.08 region, where support lies, that would likely be a classic liquidity hunt — designed to trigger fear, force early exits, and then reverse powerfully into the next leg.
💎And while both scenarios favor upside, it is the path of maximum frustration — likely a wick into 19.00 — that has historically proven most probable before larger breakouts.
💎A sustained move above the 26.93 level, especially on a daily candle close, would significantly increase the probability of continuation toward the major resistance between 30.00 and 30.74. This zone remains the main upside target in the short to mid-term.
💎On the other hand, if price closes below 16.67, that would invalidate this bullish outlook and open the door to deeper downside. Until then, structure remains bullish, and the higher-probability outcome still favors upside after a potential short-term shakeout.
This is the point where the weak hands get shaken out and smart money reloads, Paradisers. If you're aiming for long-term success, wait for high-probability setups and protect your capital. Strive for consistency, not quick profits. Treat the market as a businessman, not as a gambler.
MyCryptoParadise
iFeel the success🌴

AVAXUSDT Forming Bullish reversalsAVAXUSDT is currently positioned at a major demand zone that has acted as strong support multiple times in the past. This area between $17 and $20 has historically triggered bullish reversals, and recent price action shows a potential bottoming pattern forming within this zone. The market has responded positively with a slight uptick in volume, indicating renewed buying interest from both retail and institutional investors. This setup could be the beginning of a sharp bullish rally, especially if the price holds above the support and breaks the near-term resistance levels.
Avalanche (AVAX) continues to attract investor attention due to its rapidly growing ecosystem and increasing adoption across DeFi, NFTs, and Web3 projects. As blockchain infrastructure becomes more critical, AVAX stands out with its high throughput and low-cost transactions, making it a competitive choice for developers and users. The network has seen consistent upgrades and ecosystem expansion, which boosts long-term investor confidence. From a technical standpoint, the current structure resembles a classic accumulation range with a breakout potential pointing toward a 90% to 100% gain in the coming weeks.
If AVAX can reclaim and hold above the $22–$23 level, it would likely trigger a strong impulsive move toward the $42–$45 target range. The risk-reward ratio remains highly favorable for swing traders and position traders aiming to capitalize on this potential reversal. The expected upside is clearly illustrated on the chart, and with broader market sentiment slowly shifting bullish again, AVAX could be one of the top performers in this cycle.
With confluence from strong technical support, solid fundamentals, and increasing investor interest, AVAXUSDT is setting up for what could be a major bullish leg. Traders should keep a close eye on breakout confirmation and volume expansion for entry signals.
✅ Show your support by hitting the like button and
✅ Leaving a comment below! (What is You opinion about this Coin)
Your feedback and engagement keep me inspired to share more insightful market analysis with you!

$AVAX Update – Breakout Retest Play!!CRYPTOCAP:AVAX is respecting the ascending trendline beautifully after a clean retest of the breakout zone.
The price is holding above the trendline, and the 200 EMA is in the 4H timeframe.
Multiple confluences align around the $22.5–$23 zone – a critical support area now flipped from resistance.
Targets are set at:
• 26.81
• 29.47
• 33.40
As long as we hold this support, the upside potential remains strong.

AVAXUSDT 📊 BINANCE:AVAXUSDT Chart Analysis
AVAX price, after breaking the key resistance at 22.20, is showing a strong upward move 📈 toward the next resistance at the end of the second leg at 30.00 USD. The 22.00 level could act as a pullback and provide strong support 🔄. If it consolidates above 30.00, the uptrend may continue to 37.00 🚀.
Support and Resistance Levels:
Supports:
• 22.20 🛡️
• 20.00 🛡️
• 17.50 🛡️
Resistances :
• 30.00 🚧
• 37.00 🚧

AVAX Weekly Outlook – A Potential 558% Move Ahead?CRYPTOCAP:AVAX is coiling inside a massive multi-year symmetrical triangle on the weekly chart. This is a textbook structure where volatility contracts before an explosive move, and the setup looks nearly complete!
🔹 Entry Zone: Highlighted accumulation zone around CMP- $17
🔹 Breakout Target: If AVAX breaks out, we could see a move toward $147 (a whopping +550%)
🔹 Resistance to Watch: $45-$50 range – historical supply zone
🔹 Support: The Ascending trendline from 2021 continues to act as a strong base
Fundamentals Behind the Chart:
Avalanche (AVAX) is one of the fastest smart contract platforms in terms of time-to-finality. It supports Subnets (custom blockchains), which are gaining traction for scalable enterprise and gaming solutions. With growing DeFi and NFT adoption on Avalanche, fundamentals are aligning with this technical setup.
If this breakout holds, AVAX might become one of the best large-cap performers in the next cycle.

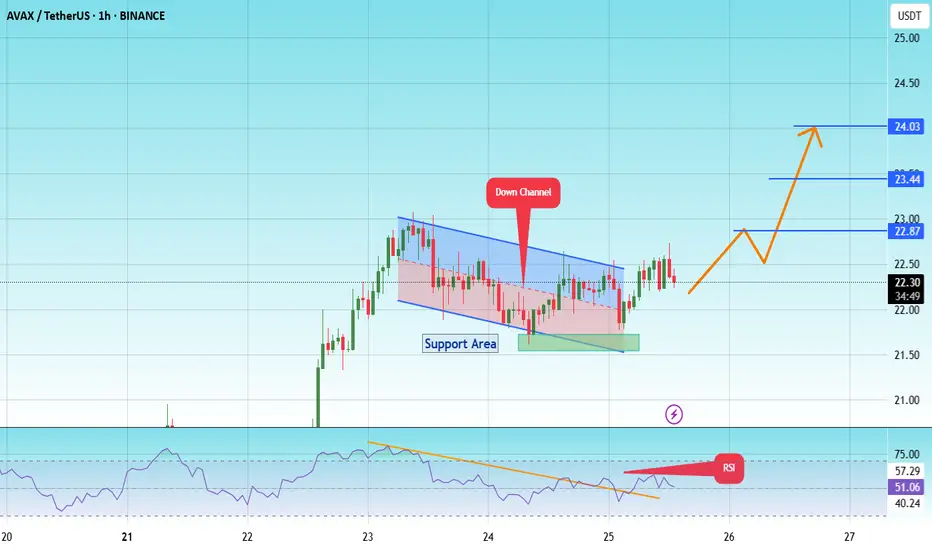
#AVAX/USDT#AVAX
The price is moving within a descending channel on the 1-hour frame and is expected to break and continue upward.
We have a trend to stabilize above the 100 moving average once again.
We have a downtrend on the RSI indicator that supports the upward move with a breakout.
We have a support area at the lower boundary of the channel at 21.50, which acts as strong support from which the price can rebound.
Entry price: 22.28
First target: 22.87
Second target: 23.44
Third target: 24.00
AVAX/USDT:BUYHello friends
Due to the price correction, we can buy in two designated areas in a stepwise manner. Elite with capital and risk management.
*Trade safely with us*
AVAXUSDT – %180 VOLUME SPIKE! Major Resistance Ahead 📊 What’s Happening?
✅ Volume is exploding (+180%) – This means big money is moving, but in which direction?
✅ Blue Box = A HUGE Resistance Zone – This is where sellers may step in aggressively.
✅ Breakout vs. Rejection? – We’re at a critical decision point.
💡 How I’m Trading This:
📌 Scenario 1: Rejection – If price stalls at the blue box, I’ll watch for LTF breakdowns + CDV confirmation for a high-R short.
📌 Scenario 2: Breakout & Retest – If price pushes above with strong volume, I’ll wait for a clean retest before considering a long.
🔑 Pro Trading Mindset:
I don’t marry my bias. If price shifts structure, I shift with it. No guessing. No hoping. Just data-driven execution.
Follow me for real-time, high-probability trade setups. Smart traders adapt, amateurs gamble.🔥
✅I keep my charts clean and simple because I believe clarity leads to better decisions.
✅My approach is built on years of experience and a solid track record. I don’t claim to know it all but I’m confident in my ability to spot high-probability setups.
✅If you would like to learn how to use the heatmap, cumulative volume delta and volume footprint techniques that I use below to determine very accurate demand regions, you can send me a private message. I help anyone who wants it completely free of charge.
🔑I have a long list of my proven technique below:
🎯 ZENUSDT.P: Patience & Profitability | %230 Reaction from the Sniper Entry
🐶 DOGEUSDT.P: Next Move
🎨 RENDERUSDT.P: Opportunity of the Month
💎 ETHUSDT.P: Where to Retrace
🟢 BNBUSDT.P: Potential Surge
📊 BTC Dominance: Reaction Zone
🌊 WAVESUSDT.P: Demand Zone Potential
🟣 UNIUSDT.P: Long-Term Trade
🔵 XRPUSDT.P: Entry Zones
🔗 LINKUSDT.P: Follow The River
📈 BTCUSDT.P: Two Key Demand Zones
🟩 POLUSDT: Bullish Momentum
🌟 PENDLEUSDT.P: Where Opportunity Meets Precision
🔥 BTCUSDT.P: Liquidation of Highly Leveraged Longs
🌊 SOLUSDT.P: SOL's Dip - Your Opportunity
🐸 1000PEPEUSDT.P: Prime Bounce Zone Unlocked
🚀 ETHUSDT.P: Set to Explode - Don't Miss This Game Changer
🤖 IQUSDT: Smart Plan
⚡️ PONDUSDT: A Trade Not Taken Is Better Than a Losing One
💼 STMXUSDT: 2 Buying Areas
🐢 TURBOUSDT: Buy Zones and Buyer Presence
🌍 ICPUSDT.P: Massive Upside Potential | Check the Trade Update For Seeing Results
🟠 IDEXUSDT: Spot Buy Area | %26 Profit if You Trade with MSB
📌 USUALUSDT: Buyers Are Active + %70 Profit in Total
🌟 FORTHUSDT: Sniper Entry +%26 Reaction
🐳 QKCUSDT: Sniper Entry +%57 Reaction
📊 BTC.D: Retest of Key Area Highly Likely
📊 XNOUSDT %80 Reaction with a Simple Blue Box!
I stopped adding to the list because it's kinda tiring to add 5-10 charts in every move but you can check my profile and see that it goes on..

AVAXUSDT Ready to Explode? Avalanche ( BINANCE:AVAXUSDT ) has successfully retested its previous support zone, showing strong signs of a potential upward move. This retest confirms the level as a solid base, and the price action is hinting at a shift in momentum. Currently undervalued and flying under the radar, Entering the trade at this level offers a favorable risk-reward ratio, with the previous swing low acting as a logical stop-loss point. Once the market gains momentum, we could see explosive moves from $AVAX. As always, manage your risk wisely and never trade without a stop-loss. This could be the calm before the storm — don’t miss out on the next big wave!
BINANCE:AVAXUSDT Currently trading at $19
Buy level : Above $18.7
Stop loss : Below $17.5
Target : $25
Max leverage 3x
Always keep stop loss
Follow Our Tradingview Account for More Technical Analysis Updates, | Like, Share and Comment Your thoughts
