BCH Sell/Short Signal (1H)Add this symbol to your watchlist and enter the position once it reaches the entry zone.
Considering that BCH is in a bearish structure on the hourly timeframes, we are looking for sell/short opportunities at order blocks and origin zones.
We have identified two targets. At the first target, secure partial profits and then move the position to break-even.
Do not enter the position without capital management and stop setting
Comment if you have any questions
thank you
Bchusdt

BCHUSD Potential path ways - {15/12/2025}Educational Analysis says that BCHUSD (Crypto Pair) may give trend Trading opportunities from this range, according to my technical analysis.
Broker - Bitstamp
So, my analysis is based on a top-down approach from weekly to trend range to internal trend range.
So my analysis comprises of two structures: 1) Break of structure on weekly range and 2) Trading Range to fill the remaining fair value gap
Let's see what this Crypto Pair brings to the table for us in the future.
DISCLAIMER:-
This is not an entry signal. THIS IS FOR EDUCATIONAL PURPOSES ONLY.
I HAVE NO CONCERNS WITH YOUR PROFITS OR LOSS,
Happy Trading,
FX Pairs & Crypto Curreny Trade Analysis.
My Analysis is:-
Short term trend may be go to the external demand zone.
Long term trend breaks the new high after going from discount zone.

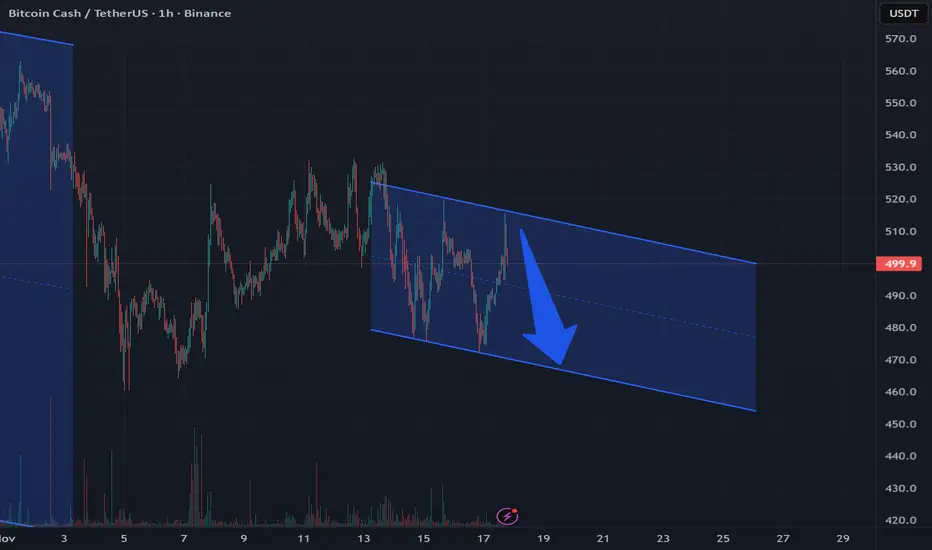
Is BCH/USDT Setting Up a Downside Swing? Structure Explained🔻 BCH/USDT – Crypto Market Opportunity Blueprint (Swing Trade)
“Bitcoin Cash vs Tether: Bearish Structure in Focus”
📉 Trade Outlook
The bearish plan has been confirmed following a decisive weighted moving average dynamic-support breakdown, signaling potential downside momentum.
📌 Entry
You may enter at any price level that aligns with your trading framework and confirmation signals.
🛑 Stop-Loss (SL)
This setup uses a reference SL @ 520.0.
Dear Ladies & Gentleman (Thief OG’s), adjust your stop-loss according to your strategy, your confirmation, and your risk appetite.
Place the SL only after the breakout confirmation.
Note: This SL is not a recommendation. Manage your trade independently and execute based on your own risk tolerance.
🎯 Target (TP)
The moving average currently acts as a strong resistance zone, combined with overbought conditions + a potential trap setup.
Our reference target stands at 460.0 — lock in profits if the structure moves in your favor.
Note: This TP is also not mandatory. Choose your own exit based on your analysis and risk preferences.
📚 Market Structure Breakdown
Dynamic support has clearly failed → signals bearish momentum
Price retesting lower MA zones indicates weak bullish pressure
Volume profile confirming seller strength
Structure favors downside continuation if resistance holds
🔍 Related Pairs to Watch (Correlation Insights)
1. BITSTAMP:BTCUSD (Bitcoin)
BCH often mirrors BTC’s broader trend.
If BTC breaks key support levels, it can amplify downside on BCH.
Watch for MA rejections or liquidity grab zones.
2. BITSTAMP:ETHUSD (Ethereum)
ETH weakness frequently leads to crypto-wide risk-off sentiment.
ETH/BTC ratio drop usually pressures altcoins, including BCH.
3. COINBASE:LTCUSD (Litecoin)
A close competitor to BCH with similar structure behavior.
If LTC forms bearish MA crossovers or loses trendline support, BCH weakness can follow.
4. BINANCE:BNBUSDT (Binance Coin)
BNB drives exchange-based flows.
Increased selling in BNB can trigger broader altcoin corrections, hinting at BCH continuation.
5. BINANCE:BCHBTC (Bitcoin Cash vs Bitcoin)
Direct correlation indicator.
A falling BCHBTC pair signals relative weakness, strengthening the bearish case.
📌 Final Notes
This blueprint provides a structured guide for your analysis — but execution, SL, TP, and risk remain your personal decision.
Trade safe, stay disciplined, and follow your confirmation signals.

BCHUSDT Bulls Beware? Price Just Triggered a Classic TrapYello Paradisers! have you noticed how BCHUSDT just tapped into a key resistance right after sweeping liquidity above previous highs? This could be the perfect bull trap, and what comes next might catch many traders off guard if they’re not prepared.
💎BCHUSDT has just taken inducement and is now reacting from a strong resistance zone. Price is currently moving within an ascending channel while also showing clear bearish divergence, a combination that increases the probability of a bearish move. This setup suggests that momentum is weakening despite higher price action, often a red flag for trend continuation.
💎Aggressive traders may already be looking to enter short from current levels. However, the more strategic and safer approach is to wait for another reaction from the resistance zone, ideally accompanied by a clear bearish candlestick pattern. That will give us a much higher probability entry with a more defined invalidation level. If this confirmation comes, we can then look to target the liquidity pools and support zones lying below.
💎That said, if BCHUSDT manages to break and close above the resistance zone with strength, it would completely invalidate our bearish scenario. In that case, it’s best to stay on the sidelines and wait for fresh price action to develop before taking any new trades. Chasing trades without structure is where most traders lose.
🎖Strive for consistency, not quick profits. Treat the market as a businessman, not as a gambler. Stay patient, disciplined, and focused only on high-probability setups, this is the only way you’ll make it long-term in this market.
MyCryptoParadise
iFeel the success🌴

Monday Market overview: BTC,BNB,BCH,GBPUSD 10:13 12/08/25Looking for tasty long entries on GBP/USD and BNB/USDT for this week. I am making sure to manage my positions correctly so that even if they loose I still make money. My main focus is BCH I think this has potential to go up to the prior ATH of around 4k. I don't think the crypto bull market is over I reckon we will have a crazy December, early Jan to around the 13th. There's a chance we go on until around march but we will just react to what the market is telling us.
I briefly looked over Gold and US indices, they are not my trading focus at the moment....
DISCLAIMER: I am not a financial adviser. Investing and trading is risky, and you can lose your money. The information in this video should not be used to make any investment decisions. You should contact a licensed financial adviser prior to making any investment decisions. Any affiliate links in the description of these videos may provide a commission if you decide to purchase their products. I appreciate any and all support of my channel, and without you, I wouldn't be here. Thank you.

BCH/USD Breakout Opportunity! MA Compression Signals Expansion📈 BCH/USD — BITCOIN CASH vs USD | Crypto Market Profit Pathway (Swing Trade)
🧭 PLAN (Bullish Setup)
BCH is showing a triangular moving-average breakout, confirming bullish momentum on swing-trade structure.
For this setup, the Thief Layering Entry Strategy is applied — stacking limit orders to capture premium entries during volatility.
🎯 ENTRY (Layering Method)
Thief layer entries placed at:
👉 $510 | $520 | $530 | $540
(Traders may increase layers based on their own liquidity distribution and volatility tolerance.)
This layered approach helps reduce timing pressure while averaging into strength — a classic “build position while the market sleeps” tactic.
🛑 STOP-LOSS (Risk Layer)
Thief SL: $480
Dear Ladies & Gentlemen (Thief OG’s), you are free to adjust your SL according to:
✔ Your risk model
✔ Account size
✔ Market volatility
I’m NOT recommending you rely only on my SL — operate at your own comfort level.
🎯 TARGET (Exit & Escape Plan)
Market shows overbought confluence + resistance trap zone + correlation alerts.
Police are waiting at our resistance zone, so escape with profits at:
👉 TP: $620
Again, dear Thief OG’s — take profit at your own discretion. Extract money and run at your own risk management.
🔍 RELATED PAIRS TO WATCH (Correlation Guide)
1️⃣ BITSTAMP:BTCUSD — Bitcoin
BCH often follows BTC directional momentum.
A strong BTC breakout continues boosting BCH liquidity flows.
If BTC stalls at resistance, BCH upside momentum may slow.
2️⃣ BITSTAMP:ETHUSD — Ethereum
ETH strength normally increases altcoin confidence.
When ETH volatility expands, BCH tends to attract short-term speculative inflows.
3️⃣ COINBASE:LTCUSD — Litecoin
LTC and BCH share similar “digital payment” narratives.
High correlation in mid-cap crypto momentum cycles.
4️⃣ BINANCE:BNBUSD — Binance Coin
Strong BNB rallies usually signal broader altcoin rotation.
Useful to confirm if altcoin capital is expanding or contracting.
5️⃣ BINANCE:BCHBTC — Relative Strength Chart
Key chart to gauge whether BCH is outperforming Bitcoin or simply following.
Breakout in BCH/BTC = higher conviction for BCH/USD long positions.
🧠 WHY THESE CORRELATIONS MATTER
✔ Bitcoin sets overall market tone
✔ Ethereum influences altcoin confidence
✔ Mid-cap correlations confirm sector strength
✔ BCH/BTC ratio reveals relative performance
✔ Cross-asset rotation helps anticipate reversals early
This gives you a multi-angle confirmation structure — not just trading BCH, but understanding the flow behind the move.

$BCH is building bullish momentum on the weekly basis CRYPTOCAP:BCH is building bullish momentum on the weekly basis 🚀
Chart structure looks solid. I'm seeing an ascending consolidation / flag structure forming on the weekly timeframe.
A breakout above the main trendline + confirmation above 620$ would likely trigger a push towardthe 980 - $1,000 key resistance zone.
Key level to be maintained: 440$.
Adoption is in the pipeline! 🚀
More data & key levels in my charts.

BCH Market Structure Review With Global W Pattern FlagA W-pattern has formed on BCH, but the current breakout is accompanied by a bullish flag with a long flagpole. Key liquidity zones remain below the price, so a pullback and a possible false breakout before the rally are likely.
The prolonged accumulation since October 2025 increases the upside potential. If there is no reaction in the coming days, a retest of the 0.5 level of the sideways trend, coinciding with the boundary of the global flag, is possible, the current breakout could be false.
Long-term upside potential remains until the upper liquidity zones.
Full breakdown on website
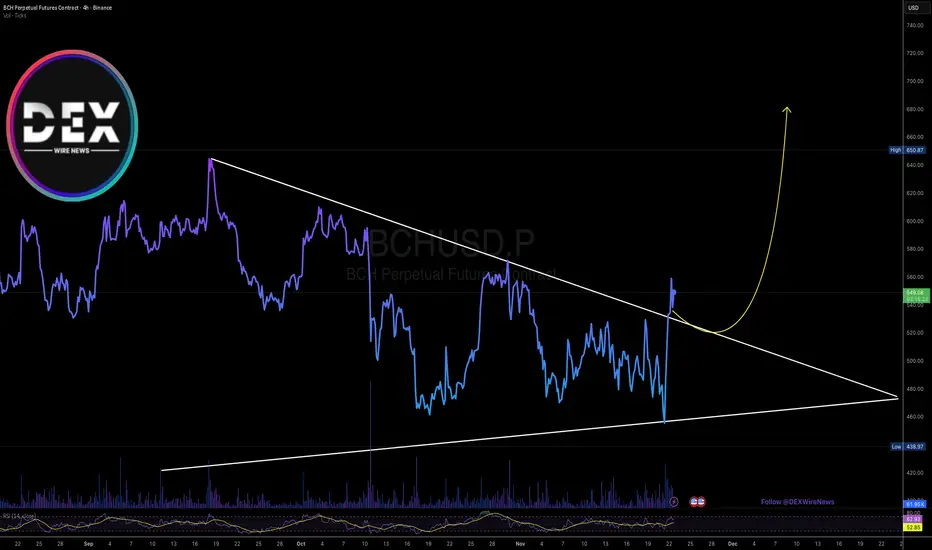
BCHUSD Breaks a 2 months Downtrend — What's next?When a pair breaks clean out of a 2 months downtrend, this kind of structure is often the first signal of a major trend shift. That happens while BTC has been in a massive selling and extreme fear phase.
Price has pushed above the descending trendline that has been capping BCH for 2 months now.
This breakout shows buyers interest of pushing the price higher.
If BCH holds above this grey block, it confirms the breakout and adds a strong belief into a bullish continuation. As of right now, price is hovering around this zone and im expecting a retest soon.
OBV is usually an underrated indicator. It shows you where accumulation starts to happen and when volume starts to rise even if price is -still- not following. Its a great forecasting indicator.
I'm very bullish on BCH and here are my targets.
• TP1: $610
• TP2: $710
• TP3: $804
• TP4: $+1000
• SL: Daily close below $433
Good Luck!

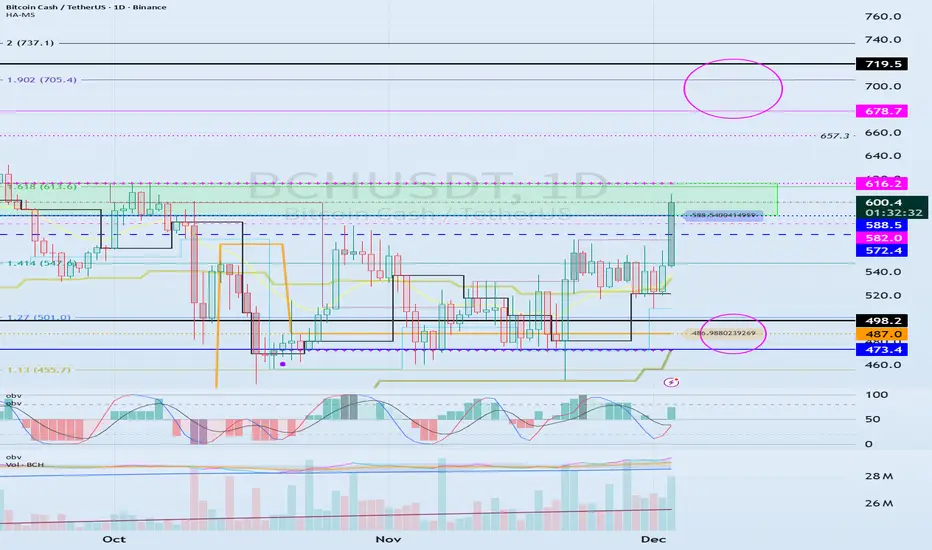
The key is whether it can break above 588.5-616.2
Hello, traders!
Follow us to get the latest information quickly.
Have a great day.
-------------------------------------
(BCHUSDT 1D chart)
The 1D chart is rising towards the HA-High ~ DOM (60) range, raising expectations for a bullish trend.
Accordingly, the key question is whether the 588.5-616.2 range can be supported and the price can rise.
If it rises, we should examine whether it can break above the 678.7-719.5 range, which is the range formed by the DOM (60) indicator on the 1M chart and the previous high.
To continue the uptrend by breaking above key points or ranges, the StochRSI, TC, and OBV indicators must show upward trends.
If possible,
- The StochRSI indicator should not have entered an overbought zone.
- The TC indicator should remain above zero.
- The OBV indicator should remain above the High Line.
Therefore, we should examine the movements of the StochRSI, TC, and OBV indicators when the price rises above the DOM (60) indicator.
If the StochRSI falls below 80, it's considered a stop loss, as further declines are likely.
-
Thank you for reading.
We wish you successful trading.
--------------------------------------------------
FireHoseReel | BCH: Ready to Shock the Market ?🔥 Welcome To FireHoseReel !
Let's dive into the BCH ( BitcoinCash ) 4H analysis .
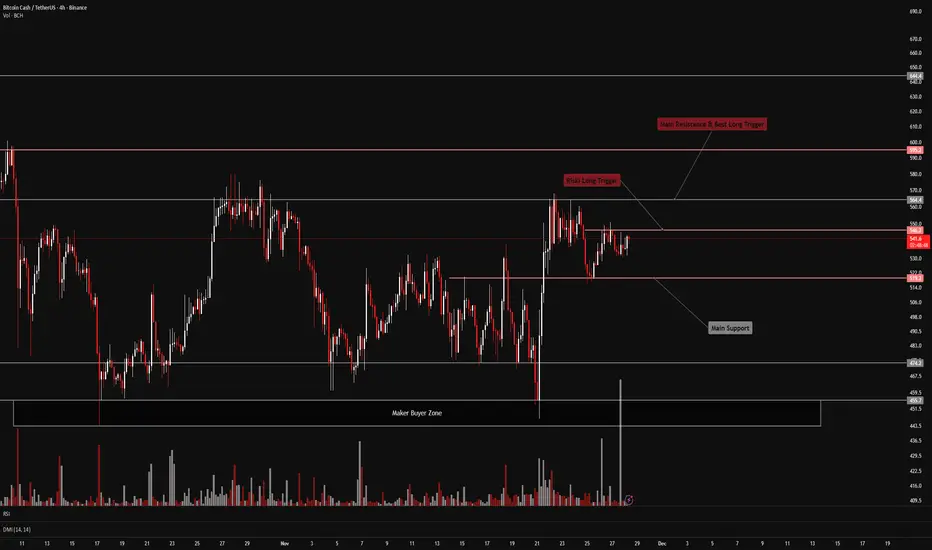
👀 Bitcoin Cash (BCH) – Market Structure Overview
After reacting strongly from the major buyer zone, Bitcoin Cash pushed higher and attacked the $564 resistance directly.
Price then faced rejection at this level and entered a multi-timeframe corrective phase. During this correction, sell volume declined, and in the most recent 4-hour candles, buy volume has increased noticeably.
BCH has now formed an early long trigger around $546.
If this level breaks with multi-timeframe confirmation, we can look for early long positions, anticipating a future breakout above $564.
📊 Volume Is the Key Signal
Pay close attention to BCH volume — volume is more important than price here.
Right now, after price reached the $546 resistance zone, we’re seeing a strong surge in buy volume that hasn’t appeared for several days.
This behavior can be an early signal of a trend shift and the potential start of another bullish rally.
✔️ BCH/BTC Additional Market Perspective Looking at the BCH/BTC pair, price has moved upward very smoothly and is currently in a corrective phase.
The support and resistance levels that generate entry triggers are clearly defined — and these levels align perfectly with the BCH/USDT pair.
Early trigger: 0.005961
Safer trigger: 0.0062
These levels can be used for multi-pair confirmation.
📌 Trading Scenarios for Bitcoin Cash
You can review the following scenarios alongside your own strategy:
🟢 Long Scenario
A breakout above the $546 high, supported by rising buy volume, can offer a solid early long setup.
This setup is mainly for front-running the main breakout with lower initial risk.
If BCH later breaks and confirms above the stronger resistance at $564, we can safely add more size to existing long positions.
🔴 Short Scenario
Since the BCH/BTC pair is currently in a strong bullish structure, I do not expect a deep correction for Bitcoin Cash at this stage.
Therefore, short setups are not preferred in the current market context.
🛞 Risk Management & Disclaimer
Please remember to always use proper risk management and position sizing. Nothing in this analysis is financial advice. The market can change quickly, so always trade based on your own strategy, research, and risk tolerance. You are fully responsible for your own trades.
BCHUSDT LongBitcoin cash H4 chart, consolidation between 433.5 _ 474 levels. Now price is at support level, if we find any buy signal on lower timeframe we can buy. Let's see!

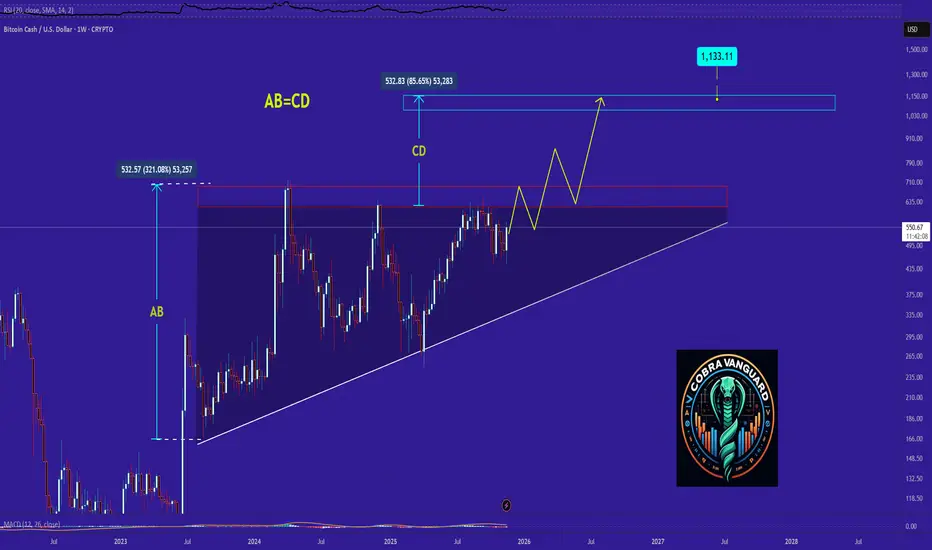
BCH - Time to buy again!BCH’s price on the 1-hour timeframe is forming an ascending triangle pattern.
If this pattern breaks to the upside, there’s hope that the AB leg will equal the CD leg, potentially pushing the price up to around $1100.
However, since crypto often disappoints expectations, it might let us down once again—so stay cautious.
Bitcoin Cash ($BCH) is Up 12% Today, Albeit Market Dip The price of Bitcoin Cash ( CRYPTOCAP:BCH ) saw a notewhorthy uptick of 12% albeit market turmoil. the altcoin is oscillating within a tight symmetrical triangle pattern gearing for a bullish continuoution pattern.
As of the time of writing, CRYPTOCAP:BCH is up 2.58% gearing for a bullish spike. With the RSI at 62, CRYPTOCAP:BCH is more than able to make a mov to the $700 resistance point.
What Is Bitcoin Cash (BCH)?
Bitcoin Cash (BCH) is a peer-to-peer electronic cash system that aims to become sound global money with fast payments, micro fees, privacy and larger block size. As a permissionless, decentralized cryptocurrency, Bitcoin Cash requires no trusted third parties.
Bitcoin Cash Price Data
The Bitcoin Cash price today is $545.45 USD with a 24-hour trading volume of $1,049,904,696 USD. Bitcoin Cash is up 11.57% in the last 24 hours. The current CoinMarketCap ranking is #11, with a market cap of $10,885,408,966 USD. It has a circulating supply of 19,956,897 BCH coins and a max. supply of 21,000,000 BCH coins.
BCH Update🚨📊 BCH Update
BCH has also formed a new resistance zone in red 🔴.
This level is now acting as a strong ceiling,
and price must break out above this red resistance
to show any real bullish momentum again.
Until that breakout happens,
sellers remain in control and upside stays limited.

BCH movement inside a descending corridorBCH is forming a local descending corridor, within which the movement is most likely to continue
We clearly see a rebound from both the upper and lower boundaries. It is also noticeable that each subsequent peak is lower than the previous one, indicating movement within the pattern
Current price: $504
Approximate contact zone at the lower boundary
If the upper boundary is broken momentarily, the pattern will be temporarily broken
More detailed analysis, additional charts, and key levels to watch are available on our site
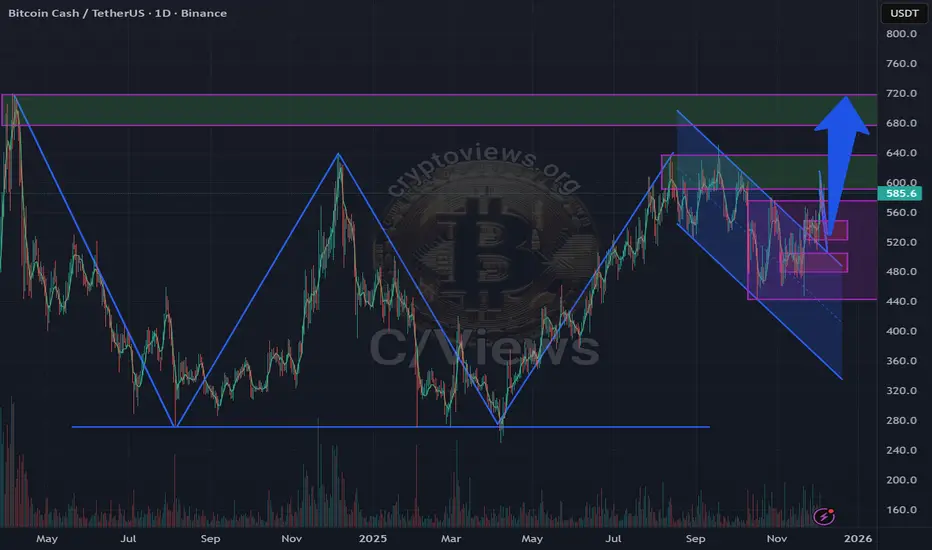
BCH BITCOINCASH 1D - 1W TFWe can clearly see a large triangle formation along with a well-defined channel, which together outline the structure the price is likely to follow in the near future.
Based on this setup, the price is expected to move toward the highlighted targets as long as it respects the channel and continues developing within this broader triangle pattern.
There is also a possibility that the price may drop to the bottom of the channel — the blue zone — before moving upward.
This would still remain within the overall market structure and would not invalidate the bullish scenario as long as the channel holds.

BCH Short ideaCurrent BINANCE:BCHUSDT Market Status
The current BCH market status is as follows:
We previously had a strong bullish trendline that drove the price from $250 to $650. However, this structure has been broken, and it appears we have entered a ranging phase between $650 and $500, with the price oscillating between these two points multiple times.
What's interesting is the old Fair Value Gap (FVG) at $500 to $525. It acted as a resistance multiple times, and after being broken, it has turned into a strong support. This strength can likely be attributed to the high number of attempts and retests it took to break through that initial resistance.
Regarding a Short Position
There are several reasons to consider a short position, at least down to the $500 level. These include the price ranging box, the market's inability to decisively break the $640 resistance, and other factors that are clearly visible on the chart.
Please Note:
This is not financial advice. Do your own research and only invest what you can afford to lose.

BCHUSDT- Bears Taking Control? Massive Downside Move Loading!Yello Paradisers, BCHUSDT is showing signs of a potential bearish move as it has displayed a bearish CHoCH with bearish divergence on MACD histogram after an accumulation and manipulation phase, which increases the probability of a downside move.
💎 For entries, we can expect a rejection from the FVG zone and target the liquidity levels below. Safe traders can wait for a bearish candlestick pattern confirmation around the FVG area before entering to ensure a higher probability setup.
💎 However, if the price breaks out and closes a candle above the invalidation level, it will invalidate our entire bearish idea.
💎In that case, it would be better to wait for more favorable price action to form before taking any positions.
🎖Strive for consistency, not quick profits. Treat the market as a businessman, not as a gambler.
MyCryptoParadise
iFeel the success🌴

TradeCityPro | BCHUSDT Next Major Rally or a Sharp Correction?👋 Welcome to TradeCityPro Channel!
💨 Let’s take a deep dive into the BCHUSDT (Bitcoin Cash) chart on the daily timeframe, where the market is showing some very intriguing behavior that could signal the next major move — either a powerful bullish continuation or a short-term bearish pullback.
📊 Over the past several weeks, BCH has maintained a generally bullish structure, moving in sync with broader market sentiment. However, the recent rejection from the $623.4 resistance zone has created a bit of uncertainty. This level is extremely important because it aligns with a major supply zone visible on both the daily and weekly charts, marking a strong area where sellers have historically entered the market.
📈 If BCH manages to break and close above $623.4 with strong volume, that would likely confirm a continuation of the bullish trend, potentially targeting the next psychological zones around $700 and $745. This move could also attract more traders and liquidity into BCH, reinforcing the bullish momentum.
📉 On the other hand, the $451 support has been a critical demand zone where buyers have consistently stepped in to prevent deeper declines. If the price loses this level and closes below it, it could trigger a short-term bearish phase, potentially leading to a retest of the $390–$400 range. Such a move would likely flush out weak long positions before the next major leg upward.
🧠 From a trader’s perspective, patience is key right now. For long entries, we should wait for a confirmed trend reversal on lower timeframes (4H or 1H) — ideally after a clean breakout and retest of the $623.4 resistance. However, for short setups, a breakdown below $451 would provide a much safer and more high-probability entry, especially if accompanied by strong volume and bearish momentum.
⚖️ In conclusion, BCH is currently in a decision-making zone — the market is consolidating between two major levels that will define its next big trend. Whether we see a massive bullish rally above $623.4 or a temporary bearish correction below $451, both opportunities can be highly profitable if timed correctly.
Key Levels to Watch:
🟩 Bullish Trigger: Break and retest above $623.4
🟥 Bearish Trigger: Breakdown and close below $451
📝 Final Thoughts
Stay calm, trade wisely, and let's capture the market's best opportunities!
This analysis reflects our opinions and is not financial advice.

Bitcoin cash to all time highIt’s one of the dino’s that actually doing well , sitting right on the support and if what I haf in mind goes as plan we’ll see Ath soon and probably beyond that .

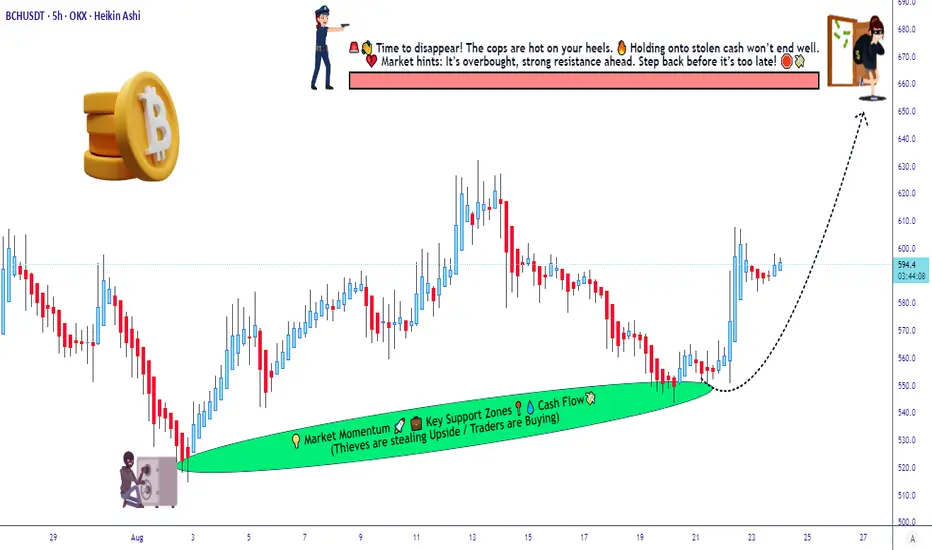
Ready To Loot With This BCH Bullish Strategy? 🏴☠️ BCH/USDT HEIST BLUEPRINT - BULLISH LOOT IN PROGRESS! 🏴☠️
Attention all Thief Crew Members! 👋 Ladies & Gentleman of the Robbery Elite! 🎩🤵♀️
The vault for BINANCE:BCHUSDT is WIDE OPEN! 🔓 Time to execute our master plan and fill our bags! 💰🤑
📜 THE MASTER HEIST PLAN (BULLISH) 📜
🎯 TITLE: LAYERED LIMIT ORDER ASSAULT!
📍 ASSET: Bitcoin Cash vs Tether (BCH/USDT)
⏰ TIMEFRAME: Day / Swing Trade Heist
📈 BIAS: BULLISH LOOTING! 🐂
🚪 ENTRY: THE LAYERED APPROACH (THIEF STYLE) 🚪
This is a MULTI-LAYER LIMIT ORDER HEIST! We are not entering all at once. We are sneaky thieves! 🐱👤
Place your BUY LIMIT ORDERS at these precise levels to average your entry like a true OG:
LAYER 1: 600.0 👉 Swipe the first bag!
LAYER 2: 590.0 👉 Double the loot!
LAYER 3: 580.0 👉 Loading up...
LAYER 4: 570.0 👉 Max capacity! 💼
(You can increase your layers based on your capital, you clever thief!)
🛑 STOP LOSS: THE ESCAPE ROPE 🛑
This is the Thief's Official SL: 540.0
Dear Crew, adjust your escape plan based on YOUR risk appetite and how many layers you used! Protect your capital! 🧨⚠️
🎯 TARGET: THE GREAT ESCAPE 🎯
The POLICE BARRICADE is forming at 670.0! 🚔🚧
WE ESCAPE WITH THE STOLEN MONEY AT: 660.0 🏃♂️💨
DO NOT GET GREEDY! Exit before the cops arrive! Take the profit and treat yourself to something nice! You've earned it! 🍾🥂
⚡ SCALPERS' NOTE: ⚡
Scalping Crew! 👀 Only quick, sharp long scalps allowed on this heist. If you're rich, go all in. If not, stick with the swing crew and execute the layered plan! Use a trailing stop to protect your mini-loot! 🔪
📝 Why This Heist? 🤔
💹 Bullish Vibes: BCH/USDT showing strong upward momentum on the charts. 📈
🔍 Do Your Homework: Check fundamentals, COT reports, on-chain data, and sentiment analysis for the full picture. 🧩
⚠️ Stay Woke: Markets move fast—keep up with real-time data and adjust your plan! ⏰
⚠️THIEF'S DISCLAIMER:⚠️
This is not financial advice! This is a robbery plan! 🎭 Manage your own risk, do your own research, and only steal... I mean, trade... with what you can afford to lose! The markets can be a trap! 🕳️
💖 SUPPORT THE CREW! 💖
SMASH THAT LIKE & BOOST BUTTON! 👉 💚🔔
It fuels our next heist and strengthens our robbery team! Let's make stealing money look easy! 🚀🤝
I'll see you at the target, crew! Stay tuned for the next heist! 🤑✨
#THIEFTRADER #BCH #USDT #CRYPTO #HEIST #LAYEREDENTRY #BULLISH #SWINGTRADE
Bitcoin Cash eyes 12% rebound, targeting strong $615 resistance Hello✌️
Let’s analyze Bitcoin Cash’s price action both technically and fundamentally 📈.
🔍Fundamental analysis:
Bitcoin Cash (BCH) rolled out the Velma hard fork in May 2025, adding VM Limits and BigInt for more advanced smart contracts.
With sub-60 second transactions and fees under $0.01, BCH is positioning itself as a fast, low-cost chain.
📊Technical analysis:
BINANCE:BCHUSDT is trading inside a parallel channel and is now testing the lower boundary, which acts as a strong support; if this zone holds, the setup suggests a potential rebound of about 12% toward the 615 level 📊💹
📈Using My Analysis to Open Your Position:
You can use my fundamental and technical insights along with the chart. The red and green arrows on the left help you set entry, take-profit, and stop-loss levels, serving as clear signals for your trades.⚡️ Also, please review the TradingView disclaimer carefully.🛡
✨We put love into every post!
Your support inspires us 💛 Drop a comment we’d love to hear from you! Thanks, Mad Whale
