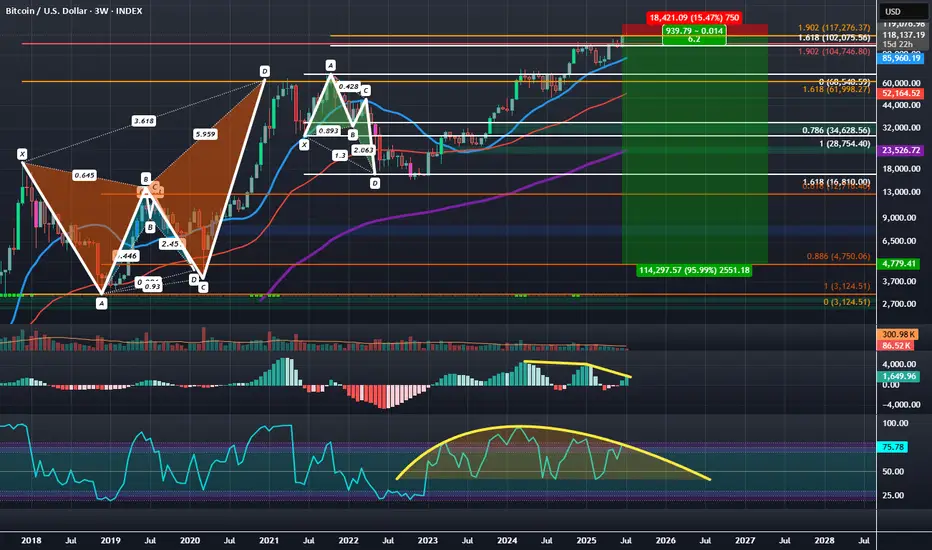
BTCUSD: Bearish Logscale Butterfly with Bearish RSI DivergenceBitcoin has been setting up at the log adjusted 1.902 HOP for a Type 2 retest of the Logscale Bearish Butterfly for the last few months but recently pushed a bit above it and appears to be settling at the linear 1.902 HOP of the local price around the $118,000 area. Between $104,000 and $118,000 is a zone of linear of logscale Fibonacci confluence pointing towards the being the area to look for a more major downside reaction than we got off the initial Type 1 Reaction 1.618 PCZ reversal in 2021.
The most recent push to the linear 1.902 seems to have allowed the structure of the RSI to develop a more Bearishly Distributive and Divergent curve, while the MACD is in the process of developing a 2nd layer of Bearish Divergence. Ultimately at these highs we'd like to see the RSI weaken further as price begins to settle back within the 1.902 bearish zone of confluence before being more sure of downside.
Additionally, during the push higher, longer dated bearish call interest came in around the 123-125k levels which to me signals a newly formed hard resistance that will be hard to gap over and will make failure here more likely. I think if we do see failure we can of course fill the CME gap down at 91.8k, but ultimately the true first target is down at 30k with max targets down near the 0.886 around $4.8k and the 100 percent retrace down at around $3,123.51 over the coming quarters.
Taking into account the wide range in downside exposure I think the best and safest way to speculate on this downside would be through the buying of the March, 27th, 2026 Puts at the $95,000 strike or the closest IBIT equivalent March, 20th, 2026 Puts at the 58 strike this will give plenty of time, as well as plenty of range for the puts to appreciate 10's of thousands of dollars in value as BTC trades down into the targeted zones below it.
Bearishrsidivergence
Educational: AB=CD pattern w/ BTC exampleOne fairly easy and useful pattern for determining reversals is the AB=CD pattern.
The pattern simply looks for two rising or falling legs up or down respectively. Then one simply measures the retracement level from point B followed by the projection from C (luckily tradingview has a tool to assist with this). If these values equal a 0.618 or 0.786 retracement followed by a 1.272 or 1.618 projection respectively, the pattern is likely to indicate a reversal of the current trend. For example, above we can clearly see the pattern almost perfectly matched the required levels of 0.618 and 1.272.
However, no pattern is guaranteed, so it is always recommended to seek out confirmation. As we can see in the above example, there is bearish reversal divergence that can be seen on both RSI and MACD (dotted green lines), whereby price is rising while oscillators are falling, indicating an even greater likelihood for a reversal.
Upon confirmation of a reversal, one can then target Fibonacci retracement levels as key points of interest as can be seen above.
A nice part about this pattern is how simple it is to spot and draw out particularly with tools available on tradingview.
Hopefully you are able to use this pattern as another useful tool in your arsenal!

Link USD trading idea and Getting out of trading slump tipspHello everyone. We are back with another cryptocurrency, technical analysis, this one featuring Link. If you can tell by my lack of blog posts, I haven't been in the "Zone" recently. I have been looking at charts, completely unsure of what is happening. There are so many possible wave counts that start flowing through my head, and I lose track of everything around me. Fun fact, this whole day, I have been crippled by my inability to figure out what is happening in the S&P500 and with bitcoin. After forcing myself away from the computer for a couple hours, and coming back later in the day, I realized that when I am confused, I just have to count the waves as precisely as I can. I got so used to clear and clean wave counts, that now, when things don't seem so clear, I am confused. I am confident now, that if I stick looking at the exact waves, I'll have a better time understanding why certain moves are happening. So this is hope for all of you out there. If you ever feel lost, just go back to the basics and the rules of what you know.
Anyway, enough with the pep talk, let's get into the analysis.
Elliottwave analysis:
What are we seeing? On the 2 hour time frame, we are able to get a good bird's eye view of the past couple of days. We can see that we have completed an impulsive wave to the upside, and we are about to start the wave c down to the 0.5 area. I think that we have finished the wave B, because we have bounced off of the 0.618 retracement of the wave A, which is a good target for the end of the wave B, and we have also completed all three waves for wave B, with the A and C matching almost exactly 1:1. The reason I am targeting the 0.5 retracement of the larger wave, is because it is the wave 4 low and will provide a strong support for us.
The stop loss I have set is the 11.4247 range.
Other confounding factors include a very bullishly diverging macd.( we can see that the wave 3 and 5 have had much higher highs on the price action, and much lower highs on the RSI. In addition to this, the macd is looking QUITE bearish, showing us two lower peaks, and a histogram that is getting higher highs on the downside.
All in all, I hope you can find some information and some profits from this trade.
Until next time, happy trading, and enjoy the rest of your week.

KRTX gap fill lower targets b/t $19-$32A strong bearish RSI divergence showing here with a gap down in the 19-32 level, buy orders would be set nicely there or short into that level.

SNAP - Is it?We have a clear double top with declining volume on the second top. While this is happening we have a bearish divergence with the RSI indicator. Even with being conservative & stating that the neckline was broken around $15 we still get a minimum price target of $11.49 which I moved up slightly to $11.60 where there are some previous support/resistance levels.
I should note that SNAP just had earnings & received a couple of upgrades today from JP Morgan & Needham. Not to mention they had an upgrade a few days ago, prior to earnings, from Bank of America/Merrill Lynch. Always risky with earnings/upgrades but the pattern is the pattern.

Bearish Divergence on 4H chart - Going down?Bearish divergence formed on 4H chart.
Keeping an eye on this one. Possible shorting.

Bitcoin is due for a dropDear all, this is my first post on Bitcoin but probably won't be the last. This will be a short simple take on the recent past and future of BTC. It has been evident since June 24th that a drop is coming for the coin. This was evident because negative RSI divergence of a bullish, or in this case bearish nature is a clear indicator of the strength of a move up or down. We can see from a orange upward sloping trend line in the chart that price was moving up while another orange downward sloping trend line in the RSI rectangle showed us that the strength of the move was weak- bearish divergence. Based on Fibonacci levels derived from the recent run-up the current A-B-C correction we are in may terminate with BTC reaching 6800 USD before resuming upside.

NEO Bearish DivergenceOn the 4 hour Neo is looking overbought with a regular bearish divergence. it also shows on multiple timeframes

EURGBP - Head & Shoulders with bearish RSI divergenceRight shoulder presented off the back of the Draghi news.
Aggressive entry taken.

RSI divergence with a 4H inside bar formationI'm almost expecting this to creep higher to trap the buyers into the market.
