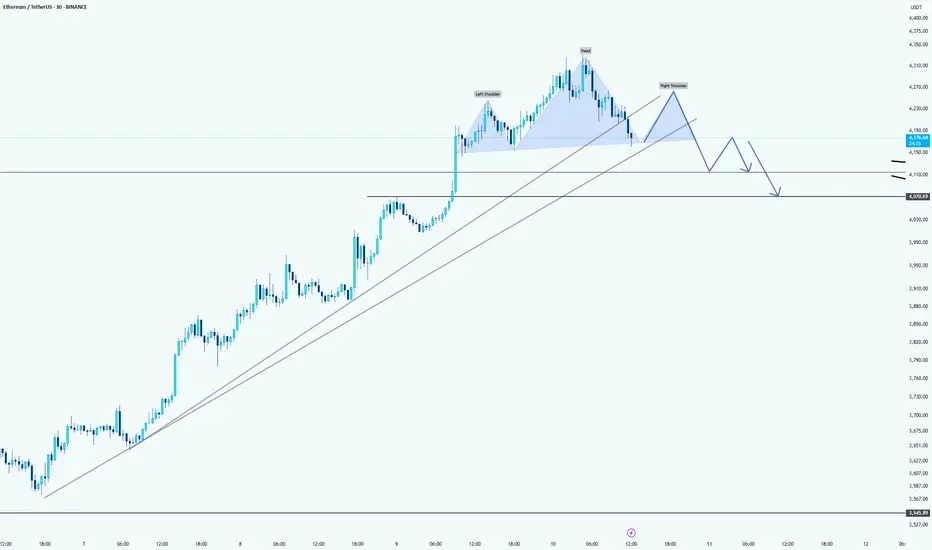
Ethereum: just a little bit correction hereHello guys!
Chart Pattern: Head and Shoulders
The chart shows a Head and Shoulders pattern forming on the Ethereum price action. The trendline drawn across the neckline of the pattern is a crucial support level to monitor.
Potential Breakdown:
If Ethereum fails to hold above the neckline (around $4,130), we might see a pullback and potentially a breakdown from the pattern. This suggests a bearish outlook for ETH in the short term.
Target:
A possible target for this bearish move could be around th e $4,050 - $4,100 range , where the price could find support from the upward trendline (in light gray). The price may retrace towards these levels before deciding whether it will continue higher or confirm further downside.
Uptrend Support:
Ethereum remains in an overall uptrend, as indicated by the sloping upward trendline beneath the price action. If the price pulls back to this trendline and holds, there could still be bullish potential.
Beyond Technical Analysis
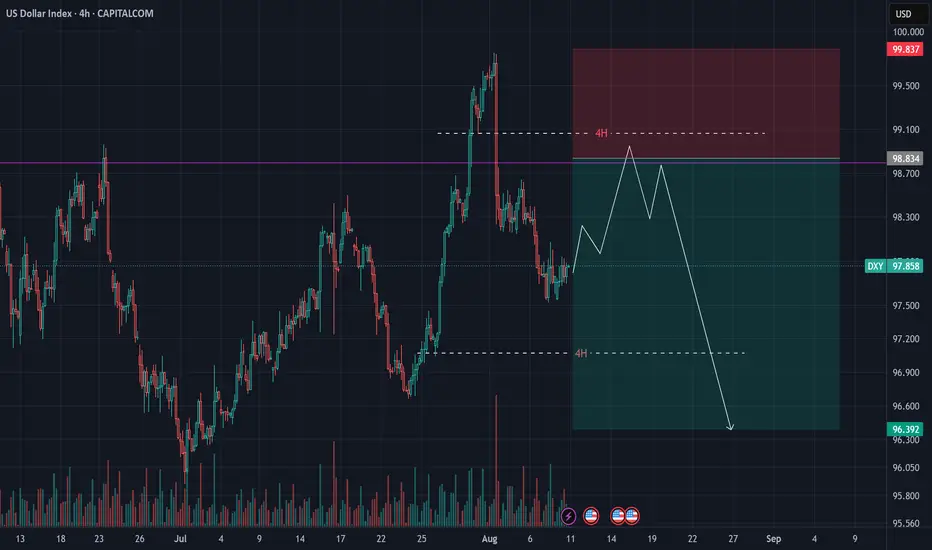
DXY Analysis – August 10, 2025
After the prolonged downtrend in the US Dollar Index that started back in January,
recent political developments seem to have had a short-term impact on its trajectory.
I believe we could soon see a short-term correction in the dollar.
However, after months of decline, this recovery won’t be straightforward —
expect stop hunts targeting buyers before any sustained move higher.
For this week, a short-term sell setup could be considered
— with proper risk management — before the broader bullish trend resumes.
EUR/USD Analysis – August 10, 2025
EUR followed our previous scenario to the letter.
After hitting our take-profit level, price retraced right into our anticipated zone.
With the current sideways price action and compression,
I expect high volatility in the coming week.
Bias remains bearish – I anticipate another break to the downside,
with a likely move back to the previous swing low.

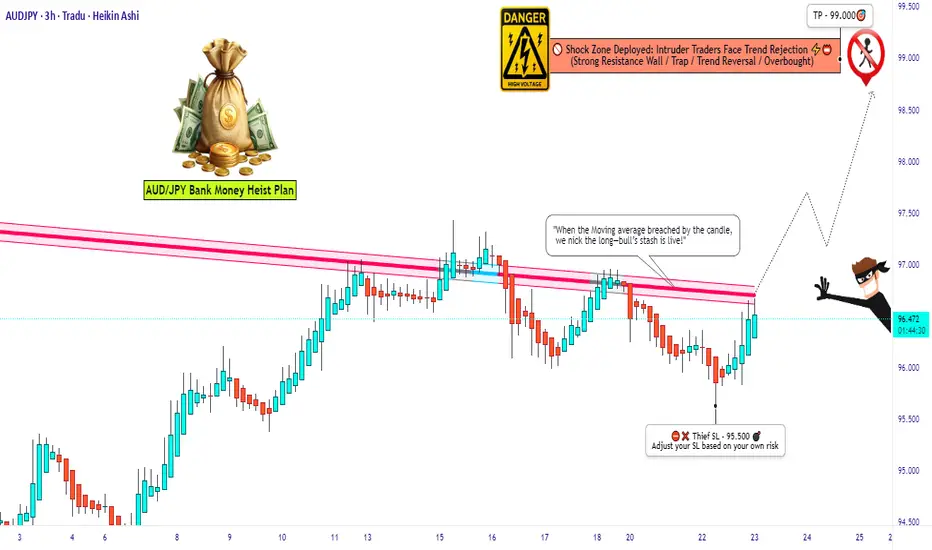
Aussie vs Yen: Setup for a Clean Long Robbery💣AUD/JPY Forex Heist: Aussie vs Yen 🔥Master Robbery Plan Unfolded!
🌟Hi! Hola! Ola! Bonjour! Hallo! Marhaba!🌟
Dear Money Makers, Bandits & Chart Pirates 🤑💰💸✈️
It's time to reload your gear and lock in the blueprint. Based on our 🔥Thief Trader Technical + Fundamental Intelligence🔥, we’re all set to ambush the AUD/JPY "Aussie vs Yen" battlefield. This ain’t no casual walk—it’s a full-scale market operation targeting the High Voltage Reversal Trap Zone⚡. The pressure is real: Overbought, Tricky Consolidation, and Bears camping at resistance. Your job? Steal profits before they smell the breakout! 🏆💪💵
🎯 Entry Point — "Let the Heist Begin"
🗝 Entry Level: Wait for the Breakout @ 94.500. When price shatters the Moving Average ceiling—that's your greenlight!
🚀 Execution Choices:
Place Buy Stop above the breakout point
Or, use Buy Limit Orders near recent swing highs/lows on the 15/30-min chart using Layering/DCA tactics (that’s how the real thieves sneak in 🕶️).
🔔 Set an alert to stay sharp—don’t miss the vault crackin’ open!
🛑 Stop Loss — “Cover Your Escape”
🎯 SL Level: Just under the recent swing low on the 3H timeframe (around 95.500)
🚫 Never place the SL before the breakout confirms! Let the move prove itself first.
🧠 SL sizing depends on your capital, lot size, and number of entries stacked. You control the risk, not the other way around!
🎯 Target — "Cash Out or Vanish"
💎 First Take-Profit: 99.000
🚪Optional Escape: Secure the bag early if momentum fades. Better leave rich than be late!
👀 For Scalpers & Swing Robbers Alike
🔍 Scalpers: Only ride the Long wave.
💼 Big pockets? Hit straight entry.
👟 Small capital? Tag in with swing trades and trail that SL like a pro.
🎣 Use a Trailing SL to lock profits as price sprints toward resistance.
📰 The Bigger Picture: Why AUD/JPY?
The pair is pumped by:
📈 Macro Economics
📊 Quant Analysis
📰 COT Reports
📉 Intermarket Correlations
🧠 Sentiment Heatmaps
🔥 Future Price Dynamics
Don’t pull the trigger blind. Read the battlefield before charging in.
⚠️ Thief’s Caution Zone: News Traps Ahead
🛎 News = chaos.
📌 Avoid entering fresh trades during major data drops.
🔐 Use Trailing SLs to protect ongoing plays.
📉 Let the market dance, but you control the music.
💥Hit the Boost Button!💥
If this heist plan pumps your portfolio, smash that boost. That’s how we fund more blueprints, fuel the Thief Gang’s vault, and keep the robbery cycle alive.
🤑💵 Together, let’s rob this market clean—Thief Style.
New plan drops soon. Stay locked. Stay sharp. Stay profitable.
🧠💰🏴☠️
— Thief Trader Out 🐱👤🔓🚀
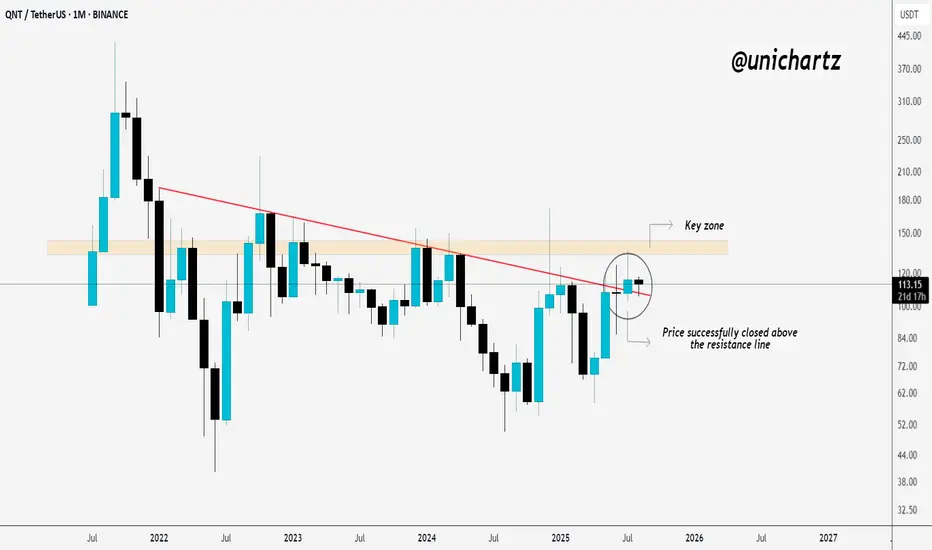
QNT at Breakout Point — Could This Be the Start of a $200+ RallyOn the monthly timeframe, GETTEX:QNT is looking strong. Price recently broke and closed above the long-term resistance trendline and is now sitting just below a key resistance zone.
If bulls push it through this zone and we get a confirmed close above, the path toward $200, $250, and beyond opens up.
I’m keeping this on my watchlist and monitoring closely for a breakout confirmation.
Do you think QNT will break this level on its first attempt, or will we see a pullback before the next leg up?
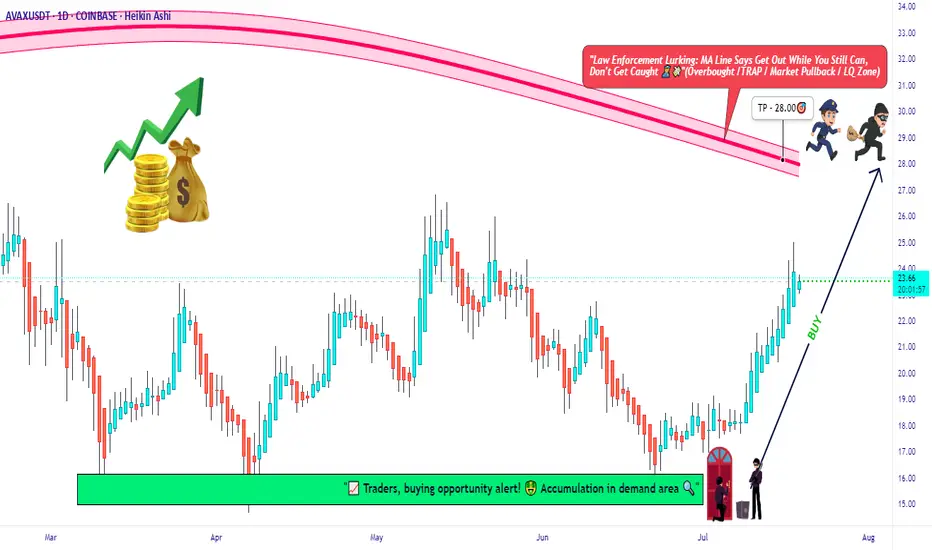
AVAX Long Only | Moving Average Trap Heist in Action🧨“Avalanche Crypto Vault Break-In 💣 | Thief Trader’s Long Playbook”⚔️💸🚀
(AVAX/USDT Crypto Heist Plan – Swing/Day Trade Blueprint)
🌍 Hi! Hola! Ola! Bonjour! Hallo! Marhaba! 🌟
Welcome, Money Makers, Market Pirates, and Chart Snipers! 🤑💰💼✈️
This ain’t just another setup — this is a strategic crypto ambush on AVAX/USDT, cooked up with the 🔥 Thief Trading Playbook 🔥. We're planning a clean, no-fingerprint heist into the Red Moving Average Zone. That’s the liquidity vault, and yes — the police (market makers) are watching 👮♂️🚨... but so are we. Stay sharp. 💼🔦
💥 Mission Objectives:
🎯 Entry Point (The Infiltration Point)
"The vault's wide open! Swipe the Bullish loot at any decent price" 📈
Smart thieves wait for pullbacks on the 15m or 30m chart to plant their limit orders near swing lows/highs. Use layered orders (DCA style) to scale in like a pro. 💣🔁
🛑 Stop Loss (Your Getaway Exit)
Secure your trade. SL at the nearest wick low/high on the 1D timeframe (around 21:00 candle).
Your SL = your personal risk code. Choose it based on lot size & how deep you're inside the vault. 🎭🚫
🏴☠️ Take Profit Target (The Treasure Room)
🎯 Target: 28.00 USDT
...or escape early if the heat (volatility) gets too intense. Protect the bag. 💼💰
⚡ Special Note for Scalpers:
🧲Only operate on the Long Side.
If you’ve got deep pockets, smash in directly. Otherwise, ride with swing bandits. Use trailing SL to secure stolen profits. 🧨📉📈
🔍 Market Heat Map & Rationale:
The AVAX/USDT setup is flashing bullish strength, backed by:
🧠 On-Chain Metrics 📊
💡 Market Sentiment
📰 Macro Catalysts
🌐 Intermarket Synchronicity
📡 Go grab the full breakdown on:
⚠️ Red Alert: News Zones Ahead! 📰🚫
Avoid fresh trades during high-volatility news releases.
Lock in gains with trailing SL. Risk management is not optional — it’s the escape vehicle. 🚗💨
📝 Legal Talk (Don’t Skip):
This isn’t investment advice. Just a well-planned blueprint from a market thief.
You're responsible for your own loot and losses. 🎭📉📈
❤️ Boost the Brotherhood 💥
Smash the 🔥BOOST BUTTON🔥 if you found value.
Every boost powers our Thief Trading Gang’s next big score. 🚀💸
Stay tuned for the next heist plan. I’ll be back with more charts, more loot, and less mercy. 🐱👤📊💥
"SOL/USD BULLISH HEIST! Steal Profits Like a Pro"🏆 "SOLANA HEIST ALERT! 🚨 Bullish Loot Ahead – Thief Trading Style (SOL/USD)" 🏆
💸 Steal Profits Like a Pro – Day/Swing Trade Plan 💸
🌟 Greetings, Market Pirates & Profit Raiders! 🌟
Hola! Bonjour! Hallo! Marhaba! 🤑 Dear Thieves & Trend Snipers, the SOL/USD vault is WIDE OPEN! Time to execute the heist with precision.
🔥 THIEF TRADING MASTER PLAN 🔥
🎯 Mission: LONG SOLANA (Escape Near Blue ATR Line)
⚠️ Danger Zone: Overbought | Consolidation | Bear Trap Ahead
🏆 Rule: "Take Profit & Treat Yourself – You’ve Earned It!" 💪💰
📈 ENTRY STRATEGY (The Heist Begins!)
"SWIPE THE BULLISH LOOT!" – Enter at any price, but smart thieves use:
Buy Limit Orders (15-30min timeframe)
Swing Low/High Pullbacks for optimal entry
DCA/Layering Strategy (Multiple limit orders for max loot)
🛑 STOP-LOSS (Escape Plan)
📍 Thief SL: Below nearest low (Daily MA @ $160.00)
⚠️ Adjust SL based on: Risk tolerance, lot size, & DCA layers.
Pro Tip: Tighten SL if market flips bearish!
🎯 TARGETS (Profit Escape Routes)
🎯 Main Take-Profit: $220.00 (or exit earlier if momentum fades)
🧲 Scalpers: Only LONG! Use trailing SL to lock gains.
💰 Big Bank Thieves: Go all-in. Smaller Raiders: Join swing traders.
📰 WHY SOLANA? (Fundamental Boosters)
Bullish Momentum (Tech + Sentiment Driving Price)
Macro Trends, On-Chain Signals 👉 Check Liinkss 🔗
Intermarket Analysis: Crypto & equities syncing for gains!
⚠️ TRADING ALERTS (News & Risk Control)
🚨 News = VOLATILITY! Avoid new trades during major releases.
🔒 Protect Running Trades: Use trailing stops to secure profits.
💥 SUPPORT THE HEIST! (Boost & Win Together) 💥
🔥 Hit the "LIKE" & "BOOST" button to strengthen our Thief Trading Squad!
🚀 More Heist Plans Coming Soon – Stay Tuned! 🤑🎉
📌 Reminder: This is NOT financial advice – DYOR & manage risk!

“COFFEE CFD Smash-and-Grab: Thieves’ Swing Trade Blueprint!"🚨☕ The Great "COFFEE" Market Heist 🚨💰
🌟Hi! Hola! Ola! Bonjour! Hallo! Marhaba!🌟
⚔️Dear Money Makers & Robbers, 🤑💸✈️
Get ready for the ultimate COFFEE Commodities CFD Market Heist! Based on our 🔥Thief Trading Style combining technical and fundamental analysis, here’s our master plan to snatch profits from the market vault.
💥 The Master Plan:
📉 Entry:
“The vault is wide open! Swipe the bearish loot at any price—our heist is on!”
💸 Use sell limit orders on the 15- or 30-minute timeframe, at the nearest swing high or low levels to lock in the perfect robbery spot. Thief (I"AM) using multiple limit orders (DCA / layering strategy style method of entries).
🛑 Stop Loss:
📌 Set your Thief SL at the nearest or swing high level of candle wick on the 4H timeframe (~313.00) to keep your loot safe.
📌 Adjust SL based on your trade risk, lot size, and multiple entry plan—don’t let the cops catch you!
🎯 Target:
Aim for 260.00 or escape before the target—take the loot and run!
👀 Scalpers’ Tip:
Only scalp on the Short Side! If you’ve got deep pockets, jump in big; otherwise, join swing traders to ride the heist. Use trailing SL to protect your loot.
💣 Market Vibes:
The “COFFEE” CFD market is trapped in bearish territory, fueled by:
🔎 Risky levels
🔎 Oversold zones
🔎 Consolidation
🔎 Trend reversal
🔎 Traps near levels where bullish robbers get strong.
📰🗞️ The Big Picture:
Check out the Fundamentals, Macro, COT Report, Quantitative Analysis, Sentimental Outlook, Intermarket Analysis, and Future Trend Targets to stay one step ahead! 👉👉👉
⚠️ Trading Alert:
News releases can rock the market vault!
🚨 Avoid new trades during big news
🚨 Use trailing SL to lock profits and guard your loot.
💥 Hit the Boost Button!
Supporting our Robbery Plan helps us all steal money with ease! 💰💵 Boost our robbery team’s strength, and trade with the Thief Trading Style to cash in every day. 💪🏆🤝🚀🎉
Stay tuned for our next heist plan—until then, keep those profits safe and stay sharp! 🤑🐱👤🤩

"NATURAL GAS PRICE THEFT IN PROGRESS – JOIN THE HEIST!"🔥 XNG/USD HEIST – BEARISH LOOT AWAITS! SWIPE & ESCAPE BEFORE THE COPS ARRIVE! 🔥
🌍 Greetings, Fellow Market Robbers! (Hola! Oi! Bonjour! Hallo! Marhaba!) 🚔💸
🚨 Mission Briefing:
Based on 🔥Thief Trading Intelligence™🔥, we’ve identified a prime robbery opportunity in the XNG/USD (Natural Gas) Energy Market. Our Bearish Heist Plan is locked & loaded—long entries are a trap, and the real loot lies in the downside escape.
🎯 Heist Strategy:
Entry (Swipe the Loot!) 🏦
"The vault is cracked! Bears are distracted—time to steal!"
Sell Limit Orders preferred (15m-30m pullback entries).
DCA/Layering Strategy for maximum loot efficiency.
Stop Loss (Escape Route) 🚨
SL at nearest swing high (4H basis) – 3.480 (Day/Swing Trade)
Adjust based on risk tolerance, lot size, & number of orders.
Target (Police Evasion Zone) 🎯 2.900 (or earlier if cops close in!)
🔪 Scalpers’ Quick Heist:
Short-side scalp ONLY!
Big money? Go direct. Small stack? Join the swing robbers.
Trailing SL = Your Getaway Car! 🚗💨
⚡ Why This Heist? (Bearish Forces at Play)
Fundamentals: Oversupply, weak demand, storage glut.
Technicals: Overbought, trend exhaustion, reversal signals.
Sentiment: Bulls are overconfident—perfect trap setup!
📰 Breaking News Alert (Stay Sharp!)
High-impact news = Volatility spikes!
Avoid new trades during releases.
Trailing SL = Your Shield. (Lock profits before the cops raid!)
💥 BOOST THIS HEIST!
👉 Hit LIKE & FOLLOW to fuel our next robbery! More loot = More strategies! 🚀💰
⚠️ WARNING (Legal Escape Plan):
Not financial advice!
Your risk, your loot.
Markets change—adapt or get caught!
🤑 NEXT HEIST COMING SOON… STAY TUNED, ROBBERS! 🐱👤🔥

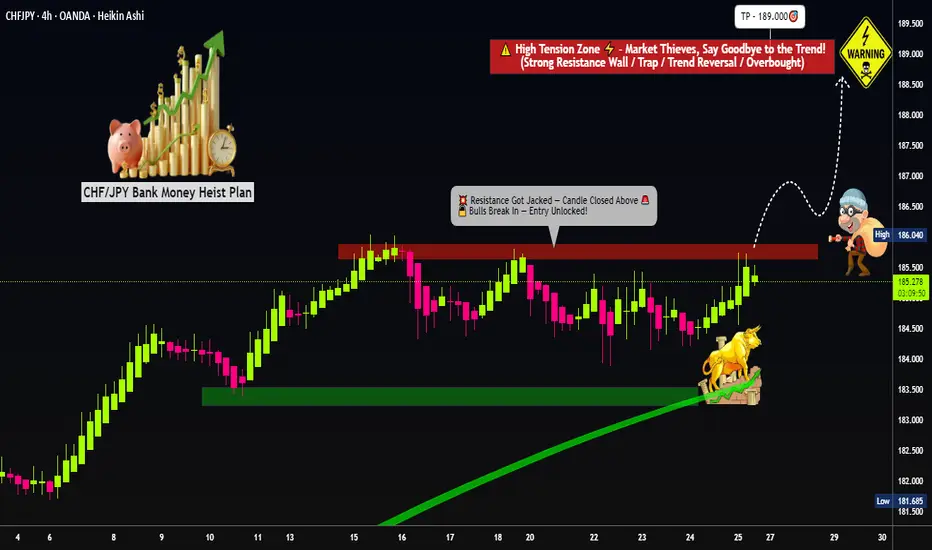
"Master Plan to Rob CHF/JPY – Breakout Trading Idea"💣CHF/JPY Forex Heist: Swiss vs Yen 🔥Master Robbery Plan Unfolded!
🌟Hi! Hola! Ola! Bonjour! Hallo! Marhaba!🌟
Dear Money Makers, Bandits & Chart Pirates 🤑💰💸✈️
It's time to reload your gear and lock in the blueprint. Based on our 🔥Thief Trader Technical + Fundamental Intelligence🔥, we’re all set to ambush the CHF/JPY "Swiss vs Yen" battlefield. This ain’t no casual walk—it’s a full-scale market operation targeting the High Voltage Reversal Trap Zone⚡. The pressure is real: Overbought, Tricky Consolidation, and Bears camping at resistance. Your job? Steal profits before they smell the breakout! 🏆💪💵
🎯 Entry Point — "Let the Heist Begin"
🗝 Entry Level: Wait for the Breakout @ 186.000. When price shatters the Moving Average ceiling—that's your greenlight!
🚀 Execution Choices:
Place Buy Stop above the breakout point
Or, use Buy Limit Orders near recent swing highs/lows on the 15/30-min chart using Layering/DCA tactics (that’s how the real thieves sneak in 🕶️).
🔔 Set an alert to stay sharp—don’t miss the vault crackin’ open!
🛑 Stop Loss — “Cover Your Escape”
🎯 SL Level: Just under the recent swing low on the 4H timeframe (around 184.000)
🚫 Never place the SL before the breakout confirms! Let the move prove itself first.
🧠 SL sizing depends on your capital, lot size, and number of entries stacked. You control the risk, not the other way around!
🎯 Target — "Cash Out or Vanish"
💎 First Take-Profit: 189.000
🚪Optional Escape: Secure the bag early if momentum fades. Better leave rich than be late!
👀 For Scalpers & Swing Robbers Alike
🔍 Scalpers: Only ride the Long wave.
💼 Big pockets? Hit straight entry.
👟 Small capital? Tag in with swing trades and trail that SL like a pro.
🎣 Use a Trailing SL to lock profits as price sprints toward resistance.
📰 The Bigger Picture: Why CHF/JPY?
The pair is pumped by:
📈 Macro Economics
📊 Quant Analysis
📰 COT Reports
📉 Intermarket Correlations
🧠 Sentiment Heatmaps
🔥 Future Price Dynamics
Don’t pull the trigger blind. Read the battlefield before charging in.
⚠️ Thief’s Caution Zone: News Traps Ahead
🛎 News = chaos.
📌 Avoid entering fresh trades during major data drops.
🔐 Use Trailing SLs to protect ongoing plays.
📉 Let the market dance, but you control the music.
💥Hit the Boost Button!💥
If this heist plan pumps your portfolio, smash that boost. That’s how we fund more blueprints, fuel the Thief Gang’s vault, and keep the robbery cycle alive.
🤑💵 Together, let’s rob this market clean—Thief Style.
New plan drops soon. Stay locked. Stay sharp. Stay profitable.
🧠💰🏴☠️
— Thief Trader Out 🐱👤🔓🚀
High-Stakes GBP/AUD Short Plan – Grab the Bag & Escape Early!💥🔥GBP/AUD HEIST OPERATION: The Pound vs Aussie Bear Trap Masterplan 🔥💥
(Thief Trader Exclusive TradingView Drop – Smash Boost If You’re Ready To Rob The Market!)
🌍 Hi! Hola! Ola! Bonjour! Hallo! Marhaba! 🌍
Welcome, Money Makers & Market Robbers! 🤑💰✈️
This isn't just analysis — it's a high-stakes forex heist, engineered using Thief Trading Style's elite blend of technical, macro, sentiment, and quantitative insights. We're cracking the GBP/AUD vault with sharp bearish setups targeting a major liquidity zone — aka the Police Barricade Support Area! 🚨🔫
📉 Plan of Attack – Short Entry Setup
This isn’t your typical chart — this is blueprint-grade precision. Here's the GBP/AUD short strategy for Day & Swing Traders:
🚪 ENTRY ZONE
Initiate bearish positions at or near recent highs (wick level).
Use limit orders stacked (layering/DCA style) on the 15m or 30m retest zones for sniper entries.
Look for wicks with rejection — that’s where the fake bullish robbers get trapped!
🛑 STOP LOSS
Place SL just above recent 4H swing highs (2.06100 as a reference).
Adjust according to position size and the number of orders you’re layering.
🎯 TARGET ZONE
Aim for 2.02500, or book partial profits earlier if the heist gets heat.
Escape before the alarms ring! Secure the bag and vanish like a pro.
🔍Fundamental & Sentiment Heist Intel 📚
This bearish pressure on GBP/AUD isn’t random — it’s triggered by a perfect storm:
COT Positioning flips 📊
Aussie strength from commodities & RBA commentary 📈
GBP uncertainty from macro tightening & economic data ⚖️
Sentiment exhaustion at highs + false bullish trap 📉
Consolidation zone breakdown = smart money move! 💼
Wanna go deep? 🧠
Tap into COT, Macro Trends, Intermarket Analysis & Thief’s proprietary scoreboardsss 📡🔗
⚠️ News & Position Management Alert 🚧
📰 Avoid entry around key news drops
🔒 Lock in profits with trailing SL
💼 Secure capital > Chase greed
🔥 SHOW SOME LOVE 🔥
💖 Smash that ❤️ BOOST button — it powers our next big heist!
Together, we rob the market with style, skill, and precision.
See you on the next breakout robbery mission, legends!
Stay dangerous. Stay profitable. Stay Thief. 🐱👤💵🚀

"NZD/CAD Reversal Play – Ride the Bullish Wave!🦹♂️💰 "THE KIWI-LOONIE HEIST: High-Voltage Forex Robbery Plan (NZD/CAD)" 💰🦹♂️
🌍 Attention all Market Pirates, Thieves & Profit Bandits! 🌍
🔥 Thief Trading Alert – NZD/CAD Bullish Heist Setup! 🔥
The "Kiwi vs Loonie" is setting up for a high-risk, high-reward robbery—and we’re locking in the master plan. Long entry is the play, but this ain’t for the weak hands. Overbought? Consolidation? Reversal trap? Perfect. That’s where we strike.
🎯 THE HEIST BLUEPRINT
🔑 ENTRY ZONE (Breakout & Retest Strategy)
"Wait for the 4H candle to CLOSE ABOVE 0.82600 (MA Breakout + Retest)."
Option 1: Place a BUY STOP above the MA (momentum confirmation).
Option 2: BUY LIMIT near recent swing lows (15M/30M precision).
🚨 Set an ALERT! Don’t miss the breakout—timing is everything.
🛑 STOP LOSS (Escape Route)
SL at 0.82000 (near swing low wick on 4H).
⚠️ Golden Rule: NO ORDERS BEFORE BREAKOUT! Wait for confirmation.
Adjust SL based on your risk, lot size, and multi-order strategy.
🎯 TARGETS (Profit Escape Plan)
Take Profit 1: 0.83300 (First resistance).
Or… Exit Early if the market turns shaky.
Scalpers: Long-only scalp plays! Use trailing SL to lock in gains.
⚡ THIEF TRADER PRO TIPS
✅ Fundamental Backing: Check COT reports, macro trends, intermarket signals.
✅ News Alert: Avoid new trades during high-impact news—protect open positions with trailing stops.
✅ Risk Management: Small lots, multiple entries = smarter heist.
💥 BOOST THE HEIST! (Let’s Get Rich Together) 💥
👉 Smash that 👍 LIKE button to fuel our next robbery plan!
👉 Follow for daily high-voltage setups.
👉 Comment "🚀" if you’re joining the heist!
🤑 NEXT HEIST COMING SOON… STAY TUNED, BANDITS! 🤑
🔥 WHY THIS TRADE? (Thief’s Edge)
Bullish momentum but trapped bears = perfect robbery setup.
Institutional levels + retail traps = our opportunity.
Not financial advice—just a well-planned theft. 😉
⚠️ Warning: Trading = Risk. Only play with funds you can afford to lose.

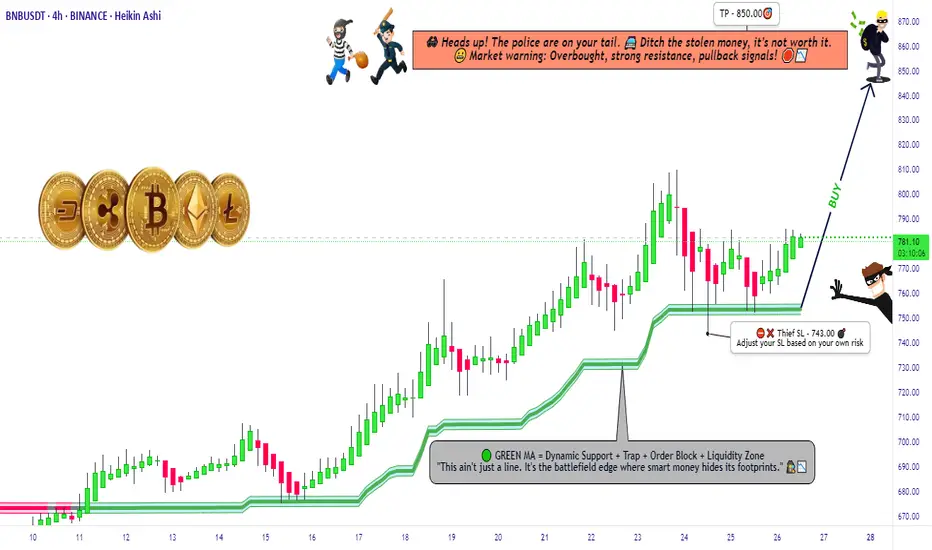
"BNB Primed for a Pump – Thief Trading Mode Activated!"🚨 BNB/USDT HEIST PLAN – SWIPE THE BULLISH LOOT BEFORE COPS ARRIVE! 🚨
🌟 Attention, Money Makers & Market Robbers! 🌟
(Hola! Oi! Bonjour! Hallo! Marhaba!)
The BNB/USDT vault is CRACKED OPEN—time to execute the ultimate heist! 🏦💰 Based on 🔥Thief Trading Style Analysis🔥, here’s your lucrative robbery blueprint for the Binance Coin vs. Tether market.
🔐 MASTER PLAN: LONG ENTRY HEIST (HIGH-RISK, HIGH-REWARD)
🎯 TARGET: 850.00 (or escape before the cops show up!)
🚨 POLICE TRAP ZONE: Overbought + Strong Resistance – Bears & cops are lurking!
💎 TAKE PROFIT EARLY & TREAT YOURSELF! (You’ve earned it, outlaw!)
⚔️ ENTRY STRATEGY: SWIPE FAST OR WAIT FOR THE PULLBACK!
🤑 VAULT IS OPEN! Enter any price if you’re bold (instant long).
🕵️♂️ SMART THIEVES: Use buy limit orders near 15M/30M swing lows/highs for a safer heist.
🛑 STOP-LOSS (ESCAPE ROUTE)
Thief SL: 743.00 (4H candle wick – adjust based on your risk tolerance!)
⚠️ WARNING: If the cops (bears) break in, DON’T HESITATE—RUN!
🎯 TARGETS & ESCAPE PATHS
Scalpers: Trail your SL & escape with quick loot! (Only long-side allowed!)
Swing Bandits: Hold strong but watch for police traps!
📡 MARKET INTEL (WHY THIS HEIST WILL WORK)
Bullish momentum in play! (But stay sharp—consolidation & reversals possible.)
Fundamentals, COT Reports, On-Chain Data, & Sentiment all hint at more upside!
🚨 TRADING ALERTS – DON’T GET CAUGHT!
📰 NEWS = VOLATILITY! Avoid new trades during major releases.
🔒 LOCK PROFITS! Use trailing stops to protect your stolen gains.
💥 BOOST THIS HEIST – STRENGTHEN THE SQUAD! 💥
🔥 Hit the LIKE & FOLLOW to support the robbery team!
🚀 More heists coming soon—STAY TUNED, OUTLAWS! 🚀
🎯 Trade Smart. Steal Big. Escape Faster. 🏴☠️


Swing & Positional Trading - RSI - Monthly & DailyThis trading guide outlines a simple and effective setup for both positional and swing trades, focused on high beta, highly liquid stocks. Follow the rules strictly for better consistency and profitability.
🔹 Positional Trade Setup
• Open the Monthly Chart of the stock.
• Add the RSI (Relative Strength Index) indicator.
• Uncheck all levels (30, 50, 70) and only keep one level at 60.
• Edit the level from 70 to 60 and highlight it in green.
Entry Criteria:
• Stock must cross the 60 RSI level on the monthly chart.
• Entry is only triggered if the price breaks the previous month’s high.
Stop Loss:
• Place the initial stop loss below the previous month’s low.
Trailing Stop Loss:
• Trail the stop loss to the current month’s low, but only after the monthly candle closes.
• Continue trailing the stop loss every month using this method until exit.
Exit Rule:
• Exit the positional trade only if the current month’s candle closes below the previous month’s low.
⚡ Note: The RSI 60+ setup is a powerful momentum strategy with high reward probability.
🔹 Swing Trade Setup
• Precondition:
• Monthly RSI must cross above the 60 level.
• Switch to the Daily Chart
Entry Criteria:
• Identify the current swing high on the daily chart ( Current High Price Level)
• Entry is triggered only when the stock breaks the swing high.
Stop Loss:
• Place the stop loss below the current swing low.
• If unsure how to mark swing low, then use a daily close below RSI 60 as your stop.
Trailing Stop Loss:
• If the trade moves in your favor, trail the stop loss to each day’s low.
Exit Rule:
• Exit the swing trade only if RSI crosses back below 60 with a daily candle close.
📝 Conclusion
This is the final and simplified setup designed for traders looking for clarity and consistency in trading. No complicated indicators or confusing rules—just clean chart action with momentum logic.
🔥 Stock Options Trading Strategy – Built on Core Swing/Positional Principles
I’m now sharing a Stock Options Trading Concept that follows the same core principles but is tailored specifically for liquid stock options.
You’ve already been provided with a list of 75+ high-beta, liquid stocks. For this strategy, you will strictly focus only on those stocks.
✅ Strategy Setup
🔹 Timeframe Filters:
• Monthly RSI > 60 (RSI has crossed and is holding above 60)
• Daily RSI: RSI must be crossing 60 or on the verge of crossing
Now, on the Daily Chart, mark the current swing high and swing low.
📌 Two Entry Approaches:
Approach 1: Breakout Entry
• Entry: When swing high is broken.
• Stop Loss (SL): Swing low or previous week’s low.
Approach 2: Pullback Entry
• Wait for a retracement from swing high (should not exceed 50% retracement).
• Confirmation of pullback weakness: Volume bars should be shrinking/decreasing.
• Entry: On breakout of the last candle high of the pullback.
• Stop Loss: Swing low or previous week’s low.
Once in the trade, trail your stop loss to cost after 3 consecutive bullish candles.
📤 Exit Rules
• Exit the Stock Options position only if the Daily RSI close below 60.
⚠️ Important Guidelines for Stock Options
• 💡 Trade with only 1 lot. Never exceed your lot size.
• 📅 Enter after 2 days of the monthly expiry and exit before 2 days of next monthly expiry to avoid smart money manipulation.
• 🎯 Choose strike prices in multiples of 25, 50, 75, or 100 for better liquidity.
• Example: If stock is at 1564, choose 1550 ITM or 1575 ATM.
• ⏱️ For quick exits, always place exit orders at round numbers like 5 or 10 levels.
• Example: If you entered at ₹70 and the option is at ₹144, place an exit at ₹140 or ₹145—not any random price.
For PE buying-
Monthly RSI < 40
Weekly RSI < 40
Daily RSi crossing 40 or below
Same process for PE with 2 approach as you like but in reverse form.
📊 75 High-Beta, Highly Liquid NSE Stocks
These stocks are liquid, fundamentally strong, and mostly traded in the F&O segment — giving you both flexibility and depth.
🚗 Auto
• Bajaj Auto
• Bosch Ltd
• Eicher Motors
• Hero Motocorp
• Maruti Suzuki
• TVS Motors
• Tata Motors
🏦 Banking & Financial Services
• Bank of Baroda
• Kotak Mahindra Bank
• Axis Bank
• ICICI Bank
• HDFC Bank
• IndusInd Bank
• Bajaj Finserv
• Bajaj Finance
• SBI
🧪 Chemicals
• Aarti Industries
• Atul Ltd
• Navin Fluorine
• UPL
• Tata Chemicals
🍫 FMCG
• Britannia Industries
• Godrej Consumer
• Tata Consumer
• DMart
• Hindustan Unilever
• Dabur
💊 Pharma & Healthcare
• Apollo Hospitals
• Alkem Labs
• Biocon
• Divis Labs
• Dr. Reddy’s
• IPCA Labs
• Laurus Labs
• Lupin
• Aurobindo Pharma
• Sun Pharma
• Cipla
💻 IT Sector
• HCL Technologies
• Infosys
• LTIMindtree
• TCS
• Tech Mahindra
• Wipro
⛓️ Steel & Metals
• APL Apollo Tubes
• JSW Steel
• Jindal Steel
• Tata Steel
• Hindalco
• L&T
🛢️ Oil & Gas
• Reliance Industries
• Gujarat Gas
• Indraprastha Gas (IGL)
• Mahanagar Gas (MGL)
• Tata Power
🏢 Realty
• DLF Ltd
• Godrej Properties
• Lodha (Macrotech Developers)
• Oberoi Realty
• Phoenix Mills
🛋️ Durables & Others
• Sona BLW (Sona Comstar)
• Amber Enterprises
• Bata India
• Crompton Greaves
• Dixon Technologies
• Titan Company
• ACC Cement
• Ambuja Cement
• Ultratech Cement
• Voltas Ltd
• Polycab India
• Mazagon Dock (Mazdock)
• Asian Paints
• Berger Paints
📝 Final Thoughts
This is not just a strategy — it’s a framework to reprogram your trading mindset. Use higher timeframes, respect structure, and focus only on high-probability setups. You’re not here for noise. You’re here for moves that matter.
If this helped you, prepare a trading journal based on this strategy. Stay focused. Be consistent. Trade less, but trade right.

PHG long position confirmed Monday 7/28/25Hello,
Ayrfolio posts stock trade ideas that can potentially soar up! Our strategy is based on weekly charts and momentum so you must be patient! No day trades here unless the stock soars up intraday! Today we’re covering:
STOCK SYMBOL: PHG
POSITION: Long
TP1 Risk-Reward Ratio: 1.99
TP2 Risk-Reward Ratio: 3.43
Stop Loss: must wait AFTER daily candle closes to exit trade (regular candle, NOT Heiken Ashi)
Ultimate Stop Loss: can exit IMMEDIATELY if price reaches this level during any trading hours
EXPLANATION: Weekly momentum increased and confirmed on Monday 7/28/25 at $26.46/share. Although the stop losses are listed on the chart, if momentum has been lost then we can exit before price reaches the stop losses.
DISCLAIMER: Please do your own due diligence before making any decisions.
P.S. - Stocks can soar. YOU can soar. Soaring is possible!
-Ayrfolio

ETH – Approaching Major Supply Zone⚠️ ETH – Approaching Major Supply Zone
Pair: ETH/USD
Timeframe: 3D
Structure: Order Blocks (OB) + Fair Value Gaps (FVG)
Momentum: RSI nearing historical reaction levels
📊 What’s happening?
ETH has rallied strongly into a multi-year supply zone between $4,200 – $4,500, overlapping with prior distribution phases. The zone aligns with a major Order Block (OB) from the last market top, making it a high-risk area for rejection.
🛑 Caution Zone:
OB resistance: $4,200 – $4,500
RSI approaching overbought region on the 3D timeframe
📌 Bearish Signals to Watch:
Bearish candle formations inside OB
RSI bearish divergence
Failure to close above $4,500
Bias: Possible short-term correction before any attempt at ATH retest.
✅ Bullish Confirmation:
Strong volume breakout above $4,500
Retest of OB as support holding
RSI maintaining bullish momentum without sharp divergence
🎯 Upside Targets:
$4,868 (ATH)
$5,200+ (extension target)
Bias: Highly bullish if price closes and sustains above $4,500.

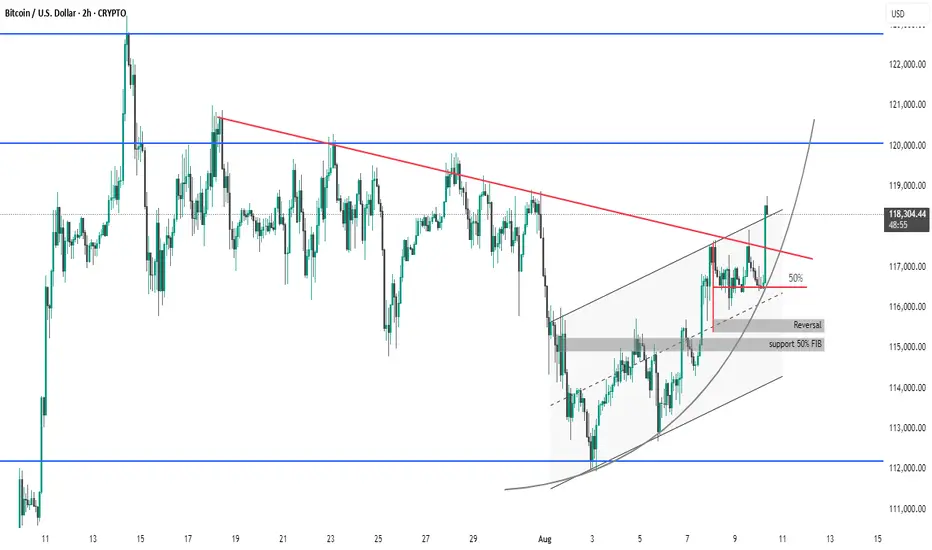
BTC #Bitcoin (BTC/USD) 2-hour chart presents several key technicBitcoin (BTC/USD) 2-hour chart presents several key technical observations:
Breakout Confirmed: Price has successfully broken above the descending red trendline, signaling a potential bullish breakout.
Ascending Channel: BTC is trading within an upward-sloping channel, indicating a strong short-term uptrend.
Support Zones: Multiple supports around $115,000 are identified, including:
50% Fibonacci retracement
Previous reversal zone
Momentum: The current price action has surged past the 50% midline of the channel and is targeting higher resistance levels around $120,000.
Curved Trendline: An upward parabolic curve suggests accelerating bullish momentum.
Summary: Bitcoin is showing strong bullish momentum after breaking key resistance. Watch for a potential retest of the breakout level (~$117,000) before a move higher.
thanks you
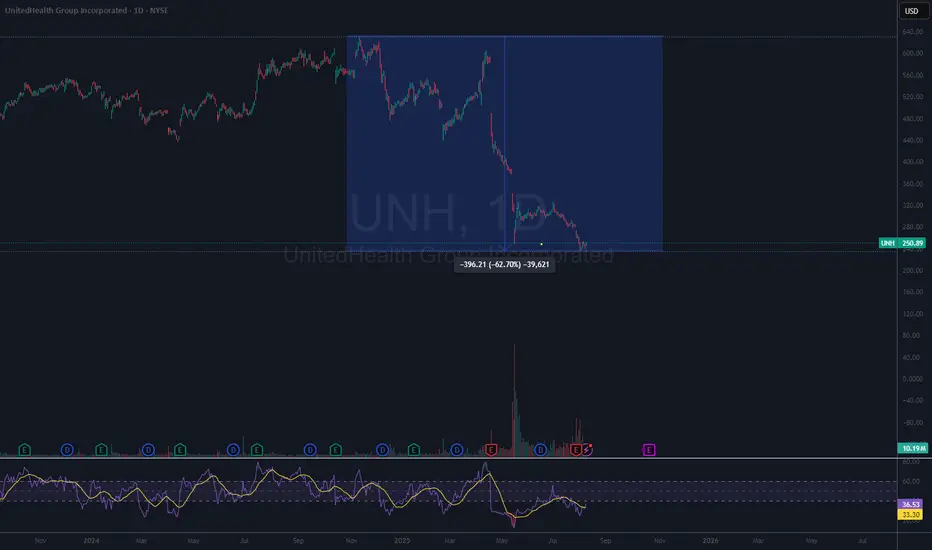
UNH a dead stock?After a 63% drop this year from its high, the stock has started seeing rebound.
- UNH's trailing P/E is near 10–11×, while forward P/E is compressed to ~15×
- The RSI had dropped to extreme oversold levels (~20) before rebounding above 39
- Despite current headwinds, UNH raised its dividend by 5%—marking 15 consecutive years of increases. Their current yield (~2.9%) is well above S&P 500 average.
- Q2 operations generated strong cash flow ($7.2B) and delivered a 20.6% return on equity, signaling disciplined capital allocation.
- High upside potential if earnings and sentiment recover.
- according to the quarterly call, New metrics set clearer expectations and reflect internal control.
This is a good stock to get into if you are looking at a 1-2 year horizon.
When Ego Takes Over, Your Account Pays the Price Revenge Trading – When Ego Takes Over, Your Account Pays the Price 💔
Traders, be honest…
How many times have you taken a painful SL, and before you could even breathe, your finger was already clicking “Buy/Sell” without a second thought?
In your head: “I’ll get it back right now… the market can’t do this to me!”
And then…
🔻 A candle goes straight against your position.
🔻 SL beeps again.
🔻 Your account balance drops faster than your mood.
That’s Revenge Trading – it sounds fierce, but in reality, it’s just an emotional storm pulling you further away from shore.
1️⃣ The Sweet but Deadly Psychological Trap
After a loss, your brain refuses to accept reality. It pushes you into the “must recover immediately” mode.
You throw discipline out the window – no setup, no plan.
You increase your lot size recklessly – “Just one win and I’ll be back.”
And… the market doesn’t care if you’re mad or not.
The danger is, at that moment, you’re no longer trading with logic — you’re trading with a wounded ego.
2️⃣ The Downward Spiral
Lose one trade → frustration.
Jump into a revenge trade → bigger lot size.
Lose again → account drains faster.
Emotions spiral out of control → random clicking.
Account blown.
It’s like standing at the edge of a cliff — you could step back and be safe… but you jump, thinking there’s a cushion down there.
3️⃣ How to Cut the Revenge Trading Cycle Before It Eats You Alive
Step away from the charts immediately after a losing streak — go for a walk, exercise, do something unrelated to trading.
Set a daily/weekly loss limit (e.g., -2R) and stick to it.
Journal your emotions after each trade to spot when revenge impulses start creeping in.
Trade smaller when you return — the goal now is to recover your mindset, not your money.
Remind yourself: “The market will always be here. My capital and mental state won’t wait for me.”
4️⃣ MMF’s Note to You
Revenge trading is not strength — it’s weakness in disguise.
It doesn’t help you beat the market; it just helps the market beat you faster.
Keeping a cool head is what keeps a trader alive in the long run.

XRPUSDT - Time to be bearish!!Did you know that the XRP chart has turned bearish and is looking pretty grim?
A lot of indicators are pointing in that direction right now.
It recently formed a triangle pattern, broke out, rallied, and hit a new ATH — which coincided with the fifth and final wave of the Elliott Wave impulse.
Now it has shifted into an ABC corrective structure, and wave B seems to have completed, setting the stage for the main corrective move with wave C, which is expected to deliver around a 30% pullback from this point.
Another red flag for me is that XRP barely managed to break into a new ATH, only to quickly reverse and is now retesting the previous ATH, which lines up with the 1.00 Fibonacci level. Based on this, I strongly expect a major correction in XRP from here.
Sure, a lot of die-hard XRP believers won’t like this take — but let them ride it down. You can always buy back cheaper, my friend.
take a look to this post
As I told you earlier in a previous post, I recommended buying it at that time(3 months ago), which was the perfect entry. It has now risen by 50%, so I’m telling you to sell if you still hold it.
Best regards:
Ceciliones🎯

Gold price continues to increase above 3400, next week✍️ NOVA hello everyone, Let's comment on gold price next week from 08/11/2025 - 08/15/2025
⭐️GOLDEN INFORMATION:
Spot gold held steady on Friday, while futures surged to a record high of $3,534 following reports that the United States will impose tariffs on imported gold bars. Traders also continued to digest recent U.S. economic data as they looked ahead to next week’s key inflation release. XAU/USD last traded near $3,397, little changed on the day.
Overnight, the price spread between New York COMEX futures and spot prices widened by more than $100, Reuters reported, after the Financial Times revealed that the U.S. had levied tariffs on one-kilo gold bars, citing a letter from U.S. Customs & Border Protection.
⭐️Personal comments NOVA:
Gold price accumulates around 3400, buying power remains good as interest rate cut expectations approach
🔥 Technically:
Based on the resistance and support areas of the gold price according to the H4 frame, NOVA identifies the important key areas as follows:
Resistance: $3418, $3437, $3500
Support: $3344, $3310
🔥 NOTE:
Note: Nova wishes traders to manage their capital well
- take the number of lots that match your capital
- Takeprofit equal to 4-6% of capital account
- Stoplose equal to 2-3% of capital account
- The winner is the one who sticks with the market the longest
