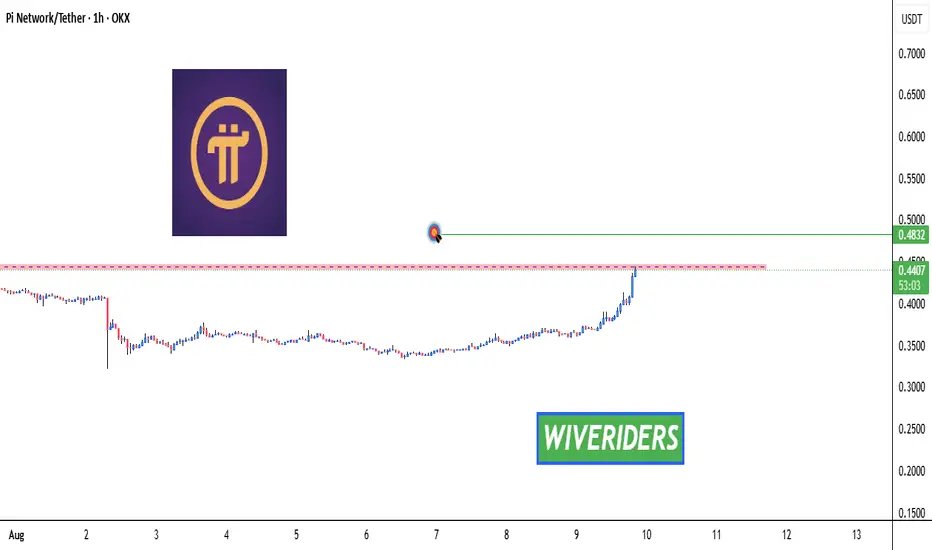
PI Breakout Watch – Red Resistance Being Tested!🚨 NASDAQ:PI Breakout Watch – Red Resistance Being Tested! 🔴⏳
NASDAQ:PI is testing the red resistance zone.
📊 If breakout confirms, next move could target:
🎯 First Target → Green line level
A breakout could trigger bullish continuation and upside momentum.
Beyond Technical Analysis
ETH/USD – Key Reaction Zones AheadETH/USD – Key Reaction Zones Ahead 📊
Price has pushed into a new resistance near 4,210 after a strong bullish run. From here, we’re watching two potential plays:
1️⃣ Bullish Breakout – Clean move above resistance could extend the rally further.
2️⃣ Deeper Pullback – Rejection could send price back towards the 4,003 OB for liquidity grab before bouncing from RBS.
Key Levels:
Resistance: 4,210 (New Resistance)
RBS: 4,160
Support Zones: 4,003 OB / 3,880 POI
Bias: Bullish unless 3,880 breaks
📌 Wait for confirmation at resistance — breakout or rejection will decide the next move.

ENA Breakout Alert – Red Resistance Cleared! 🚨 MIL:ENA Breakout Alert – Red Resistance Cleared! 🔴✅
MIL:ENA has finally broken out of the red resistance zone.
📊 This breakout signals bullish momentum with potential for further upside.
🔥 Buyers stepping in strong —

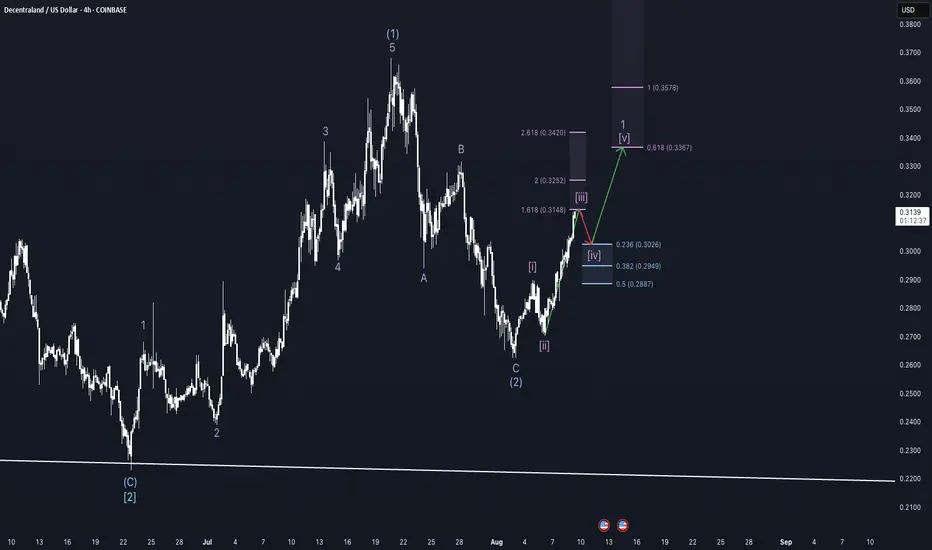
Third-Tier action - MANA weekly update August 9 - 15thDecentraland (MANA) is currently advancing within a strongly aligned Elliott Wave structure. At the Cycle degree, the market is in Wave 1; at the Primary degree, it is in Wave 3; at the Intermediate degree, also in Wave 3; and at the Minor degree, in Wave 1. At the Minute degree, price is in the late stages of Wave 3. This smaller Wave 3 is approaching a bearish Fair Value Gap (FVG), which could act as resistance and mark the short-term top of this wave. Interestingly, the projected target for Wave 5 also aligns with a higher-level bearish FVG, adding structural confluence to the broader setup.
While the overarching wave alignment remains bullish, there are a few elements to monitor closely. Funding rates are positive but leaning slightly toward the negative, suggesting a mild sentiment shift, while open interest continues to rise, indicating stronger market participation. However, the liquidity heatmap reveals a significant concentration of liquidity below the current price, which weighs against the immediate bullish continuation, as such liquidity often attracts short-term sweeps before the trend resumes.
Market psychology could also play a major role in the next move. With Ethereum currently rallying strongly, there is a plausible rotation scenario: once ETH reaches a key resistance level and slows down, capital may rotate into second- and third-tier altcoins like MANA, accelerating their upside moves. Such rotations often coincide with euphoric retail behaviour, which can amplify both gains and volatility.
From a macroeconomic perspective, this setup is further supported by expectations surrounding the upcoming September FOMC meeting. The CME FedWatch Tool currently shows a 88.9% probability of a Federal Reserve rate cut. Markets tend to front-run such events, and this expectation could fuel bullish momentum into Wave 3 moves across the crypto sector. However, with sentiment leaning heavily bullish, there is also the risk of a “sell-the-news” reaction, especially if leveraged longs pile in too aggressively ahead of the announcement.
Institutional positioning appears to have taken place earlier in the cycle, as evidenced by order block formations near the end of prior corrective waves, leaving retail traders to drive the next leg higher. This dynamic often defines the acceleration phase of a third wave.
As long as key support levels hold and the structure remains intact, MANA’s multi-timeframe alignment suggests that the next impulsive rally could be substantial — though traders should remain mindful of the liquidity resting below, which could trigger a temporary shakeout before continuation.
BTC/USD – Double Scenario PlayPrice is now testing the Day High supply zone (117,644). Two possible plays from here:
1️⃣ Bullish Continuation – Clean breakout above 117,644 could fuel a rally straight into the 118,800 OB.
2️⃣ Deeper Retracement – Rejection at supply could send price back into the 116,660 OB Buy Zone for liquidity grab before a major push up.
Key Levels:
Resistance: 117,644 / 118,800 OB
Support (Buy Zone): 116,660 – 116,400 OB/POI
Bias: Bullish as long as 115,907 (Day Low) holds
📌 Plan your entries based on reaction at the supply zone — breakout or rejection will set the tone for the next big move.

BTC/USD – Eyes on the Next Breakout BTC is holding strong bullish momentum above 116,660 📈. Liquidity is building, and a quick pullback into the OB buy zone could be the last chance before we push towards Day High (117,644) and beyond to the 118,800 supply zone.
💡 Smart money loves this setup: grab liquidity, load positions, and ride the breakout.
This is where the big moves happen — don’t blink or you’ll miss it.
🎯 Buy Zone: 116,660 – 116,000 OB
🎯 Targets: 117,644 / 118,800 OB
⚠️ Invalidation below 116,000
🔥 Get ready — the market’s about to move fast.

ETH Continues Bullish Momentum Above Broken TrendlineHello guys!
Ethereum has shown a strong bullish rally, breaking through a long-standing descending trendline with significant momentum. Currently, price action is consolidating above the broken trendline, which may now act as a support zone.
🔹 Scenario 1 (Bullish Continuation): If ETH holds above the current range and confirms the broken trendline as support, we could see a continuation toward higher resistance levels around $3,500 and beyond.
🔹 Scenario 2 (Deeper Retest): Alternatively, a pullback toward the $2,200–$2,300 area (highlighted zone) could offer a better accumulation point before the next bullish leg resumes.
This setup suggests that as long as ETH remains above the key support levels, the bullish structure remains intact.

Doge...Is a 50% Pump Coming?Hello guys!
Trend Structure:
The price is moving within a broad ascending channel, with both upper and lower boundaries acting as dynamic resistance and support. The midline (dotted blue) appears to function as a short-term pivot zone.
Recent Movement:
After a mid-July decline from around $0.29, the price found support just above $0.17 and has since rallied sharply, now trading around $0.2367.
Projection Shown in Chart:
The drawn black curved arrow suggests a potential short-term pullback from the current levels before resuming the uptrend toward the $0.314 resistance, which corresponds to the upper boundary of the channel.
Key Levels:
Immediate resistance: $0.24 – $0.25 zone
Major resistance target: $0.314
Immediate support: Around $0.21 (midline of channel)
The outlook here is bullish, assuming that the midline support holds during any pullback. A break and close above $0.25 would strengthen the likelihood of a move toward $0.31.

Trading Ideas For PSE Stocks, FX, Crypto, US Stocks And OilI will try and post more trading ideas here in tradingview for forex, crypto, US stocks, Philippine Stocks, Metals, And Oil.
My trading principle is all about keeping your losses small. You take small losses to get to your wins and let the game of probability do its work. No prediction. Let the price move and react.

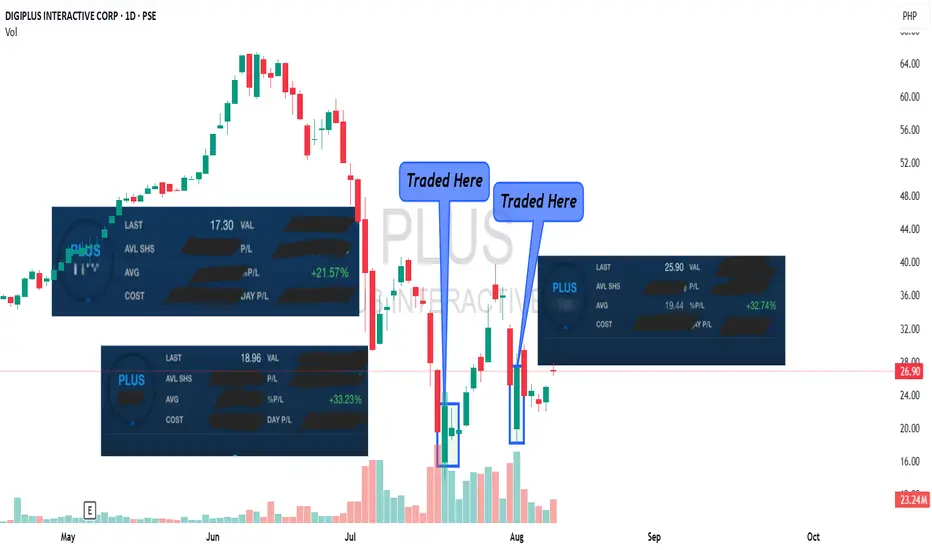
Momentum Trade On PLUS (The Why And The How)I managed to trade PLUS twice due to its Momentum.
Let me share an insight on how I did it and why.
My first trade was on July 18. PLUS has been on a downtrend for almost two weeks prior to that. From 65 pesos (1.15 usd) down to 19 pesos (0.33 usd). There was a steady decline in its price when it was on a downtrend. There was no volatility. The price was just steadily decreasing. Sellers just overwhelmed buyers. There was just to much selling pressure. July 18 came and there was volatility on that day. The price did not just steadily decrease. It went up and down. It went down to 15 pesos at open then pushed back up to 20 pesos then down again to 16 pesos then up again. There was momentum. At the first hour of the market opening, PLUS set a range. The bottom was 15 and the top was 22. As soon as the range was established, I bought near the bottom. I sold near the top for the price was still going up and down. I closed my computer and called it a day that time.
For a few days, PLUS was on a steady climb. Buyers kept overwhelming sellers. The buying pressure was there. The price climb was steady. There was no volatility. There was no momentum. I stayed away from PLUS.
On the 1st of AUG, the price of PLUS went volatile again. It went up and down. It made a range of 28 pesos as top and 18 pesos as the bottom. It went up hard then it went down hard. On and on and on. There was volatility. There was momentum. I bought near the bottom of the range again and sold it above 25 pesos.
I made two very successful trade on PLUS.
I gave you and idea on how I traded it and why. Philippine market is illiquid. There is no liquidity. You seldom see volatility and momentum on a Philippine stock. Its so illiquid that when one stock managed to have momentum then almost everyone takes notice. Everyone joins in. That makes the stock price even more volatile. Everyone is hungry for that scalping or day trade.
When I talk about momentum and volatility, most traders misunderstood it as "explosive" or high volume. Momentum and volatility is the rate of the price change. It has very little to do with volume. There are volume-less volatility and volume-less momentum. Think about a stock going from 1 dollar to 10 dollars in a year. That steady rise in price is called an uptrend. Its steady. It takes a lot of days. Its takes a lot of candles. Now, think about a stock that goes from 1 dollar to 10 dollars in one day. That is momentum.
Trend is a direction. Momentum is a rate of price change.
If you want to follow a trend then you use trend-following tools like moving averages,Williams Alligator, etc.
When you are looking for momentum then you use tools like bollinger band, RSI, etc. These are tools that will not tell you which direction the price is going yet it tells you that there is an unusually high momentum going on.
Volume is a product of volatility and momentum. The more traders get in, the more volatile the price swings become then the more volume is registered. It is not a predictor of which price will have momentum. The same way that the volume is not a predictor of which price will have a successful breakout and which price will have a failed breakout. There are volume-less
successful breakouts and there are high-volume failed breakouts.
I hope you learn a little on my post. I will try to post more here.
I apologize if my post do not have that proper structure yet. I seem to be jumping from one idea to the next. I'm just typing as i recall the trade. I will try to post better on my next posts.
Thank you.
Bitcoin analysisBitcoin tapped in weekly FVG and we had rejection from it, so we can clearly see no bearish signs on Bitcoin
My target is long towards the untaken liquidity

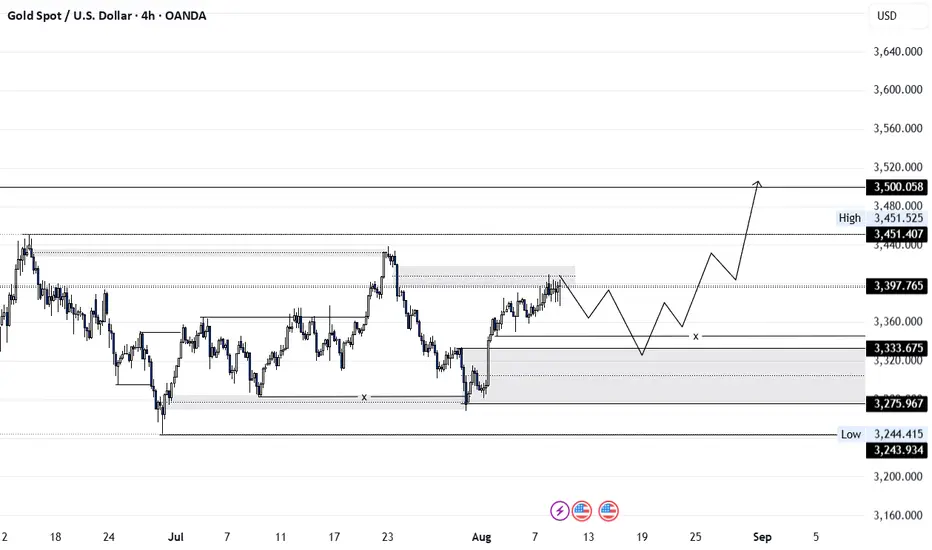
XAUUSD – Sweep the Lows, Target the HighsGold is currently trading near 3,397 after a sustained bullish leg, holding just above an ascending trendline that has acted as a structural support base. Price action indicates the potential for a deliberate liquidity sweep below the trendline, targeting stops positioned under recent higher lows. This corrective leg is expected to extend toward the 3,300–3,325 daily demand zone, an area of prior accumulation that remains unmitigated and aligns with the 61.8–65% Fibonacci retracement of the latest impulse leg.
This demand zone is further reinforced by an H4–Daily imbalance (FVG) and high-volume node on the volume profile, suggesting significant institutional interest. A strong bullish reaction from this level could confirm the continuation of the macro uptrend. Upside objectives remain the prior swing high at 3,451, followed by the 3,500 psychological level — both of which hold notable resting liquidity.
Gold is showing signs of a trendline breakdown to capture liquidity beneath recent lows. A drop into the $3,300–$3,325 daily demand zone — backed by Fibonacci, imbalance fill, and volume profile confluence — could set up the next impulsive rally. Upside targets remain $3,451 and $3,500 once demand is validated.
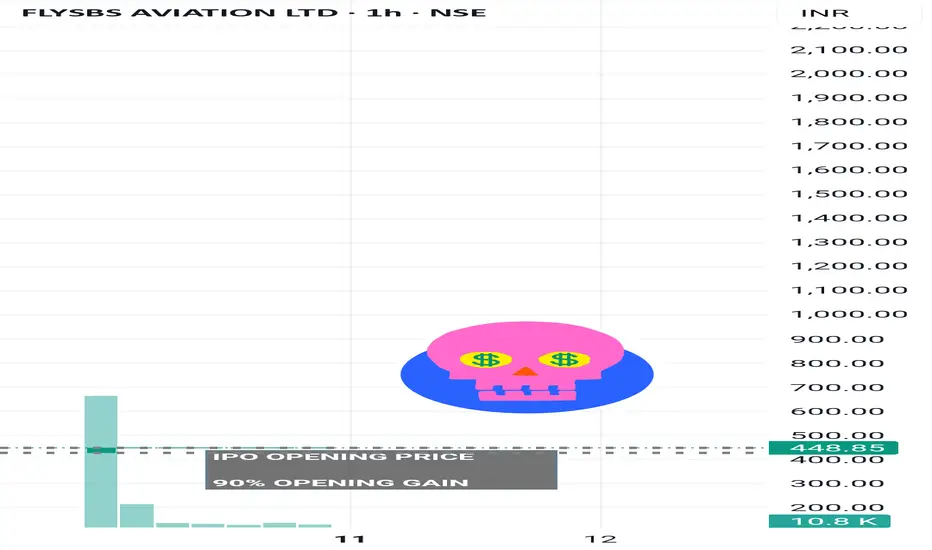
FlySBS Aviations –" Next decade "NSE:FLYSBS 🫰🏻 CONCLUSION 🫰🏻
With strong sector tailwinds, rapid fleet expansion, and clear operational scale-up plans, FlySBS Aviation is well positioned to deliver sustainable positive cash flows and attractive long-term returns, offering meaningful upside for investors as industry demand accelerates
🌸 Company Overview & Industry 🌸
-FlySBS Aviation is a private non-scheduled air charter operator serving B2B & B2C clients including corporates, HNIs, celebrities, and diplomats.
-Operates a fleet of 3 owned private jets plus dry/wet lease options to meet demand surges.
-The Indian private aviation market is growing rapidly, with an expected CAGR of 8–15% over the next decade
🌸FY2025 Sales (Total Revenue: ₹193.9 Cr)🌸
Private Jet Charters: 94% (₹182 Cr)
International Missions: 77% (₹149 Cr)
Domestic Charters: 23% (₹44.7 Cr)
Medical/Security Operations: 4% (₹8 Cr)
Subscription/Leasing: 2% (₹3 Cr)
🌸Financial Highlights (FY21–25)🌸
Revenue CAGR: ~63%
Net Profit CAGR: ~70%
Operating Margin: 21%
Net Profit Margin: 14.7%
ROE: 18.9%
EPS (FY25): ₹25.47
🌸DCF Valuation Insight🌸🫰🏻
Intrinsic Value: ~₹220 per share
Justification:
The valuation captures the expected transition from a heavy investment phase with negative free cash flow toward stable and positive cash flow generation.
The reliability is moderate, contingent on effective execution of growth plans and capital management aligned with market trends
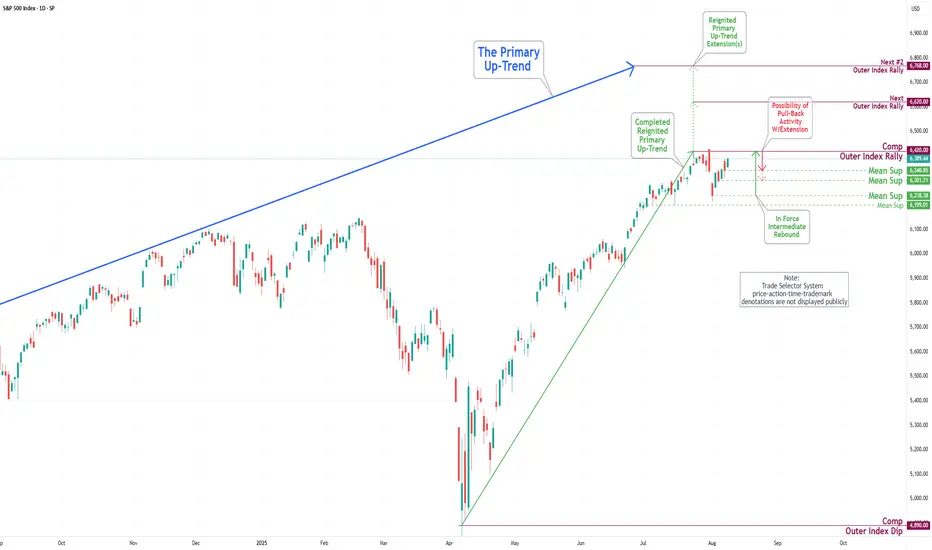
S&P 500 Daily Chart Analysis For Week of August 8, 2025Technical Analysis and Outlook:
During the trading activity of the previous week, the S&P 500 Index exhibited a predominantly bullish trend and is poised to retest the completed Outer Index Rally target of 6420, as outlined in last week’s Daily Chart Analysis. The primary objective now is to target subsequent levels, specifically the next Outer Index Rally target of 6620 and beyond.
It is crucial to recognize that the current price movement may initiate a substantial pullback from the present price action, either before or following the attainment of the Outer Index Rally peak at 6420.
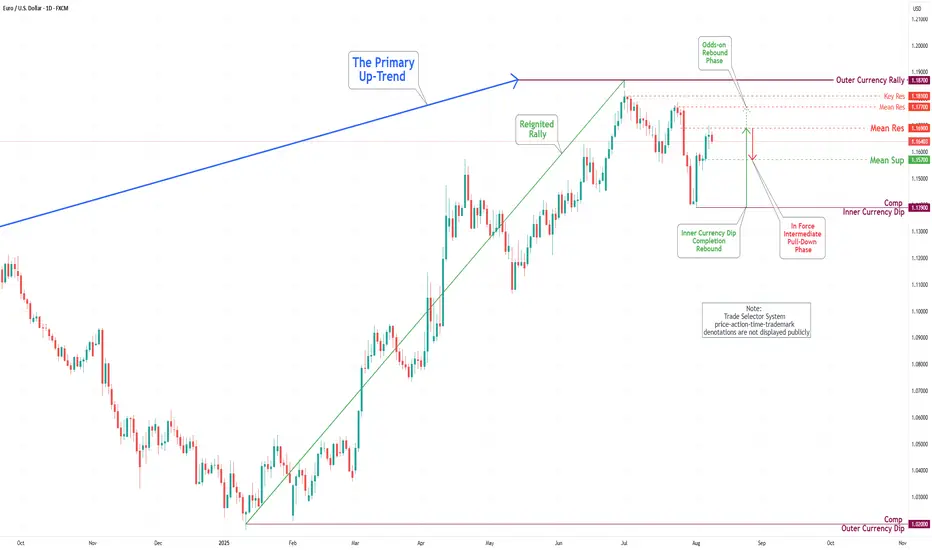
EUR/USD Daily Chart Analysis For Week of August 8, 2025Technical Analysis and Outlook:
During the current trading session, the Euro has exhibited notable volatility, marked by both a significant increase and subsequent decrease in value. Presently, it is approaching the Mean Support level of 1.157. Recent analyses suggest that the Euro is poised for a dead-cat bounce, potentially reaching the Mean Support level of 1.157, and revisiting the target set at the Mean Resistance of 1.169. Additionally, it is essential to assess the likelihood of continued upward momentum towards the Mean Resistance level of 1.177 and the Key Resistance level of 1.181. Such movements could instigate a substantial rebound and contribute to achieving the Outer Currency Rally target of 1.187.
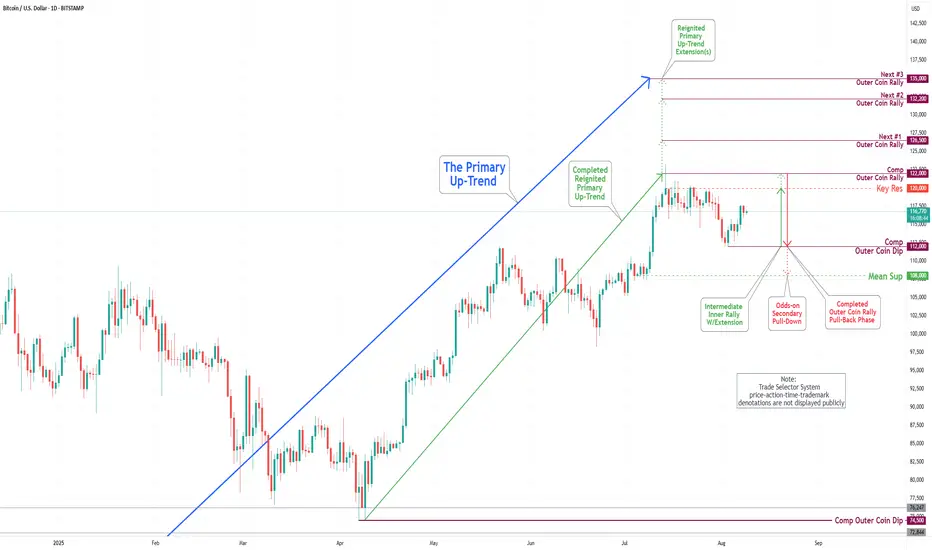
Bitcoin(BTC/USD) Daily Chart Analysis For Week of August 8, 2025Technical Analysis and Outlook:
During this week's trading session, the Bitcoin market demonstrated significant resilience, recovering from our Mean Support level at 113,000 and completing the Outer Coin Dip at 112,000. Current analysis also suggests that the cryptocurrency is attempting to retest the completed Outer Coin Rally at 122000 and the critical Key Resistance level at 120000. Conversely, on the downside, Bitcoin may seek to revisit the completed Outer Coin Dip at 112000, with the potential to extend toward the Mean Support level of 108000 before continuing its bullish trajectory.
EURUSD : Status @ 8/8Just a weekly update.
There is no change since status @ 1/8. Buyer still in control. Looking into the future, it seems buying interest is still strong.
No sign of the SELL signal yet. Will keep exercising patience and wait.
Good luck.

DOGE1. The moon is 99.99% full
2. July swing high next
3. An extension above July swing high that is equal in size to the correction from July swing high to the retest of broken diagonal resistance
4. Above yearly open and into its mid of the whole move, probably tests diagonal resistance of the whole move (with respect to 2021 highs), which happens to be around .4269
5. Starts closing above .4269 and teleports to highs
6. True "Bull market" starts above highs

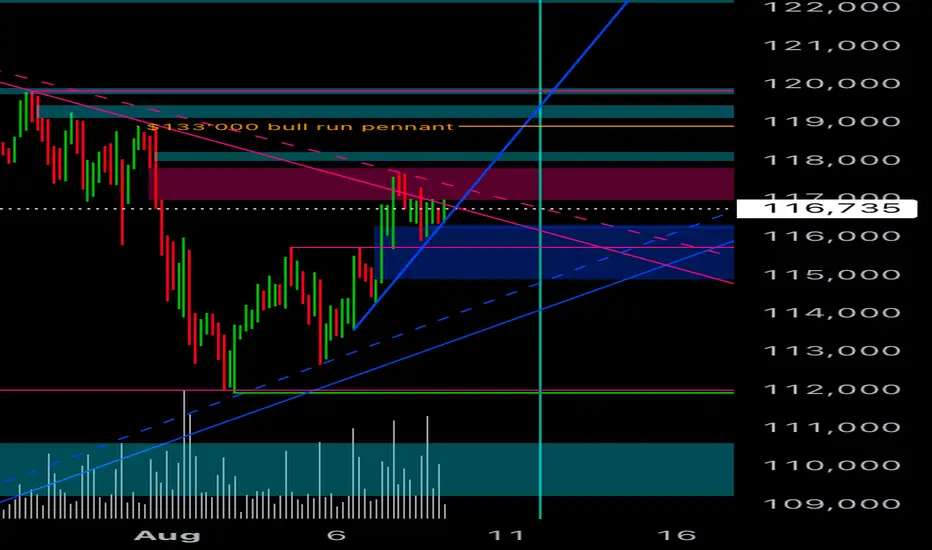
Highway Star$133’000 bull run pennant above $119’000.
Shift above all time accurate trend lines. We are at the beginning of exponential vertical segment. Strong rising front at $115’700.
Bitcoin institutional demand continues to outpace new supply, with 545,579 CRYPTOCAP:BTC purchased year-to-date compared to only 97,082 CRYPTOCAP:BTC in new supply.
The volumes were bought on July 15 and 25 for 116,000 and 115,000 respectively. So I think we are waiting for 119,000 to launch above all time high.
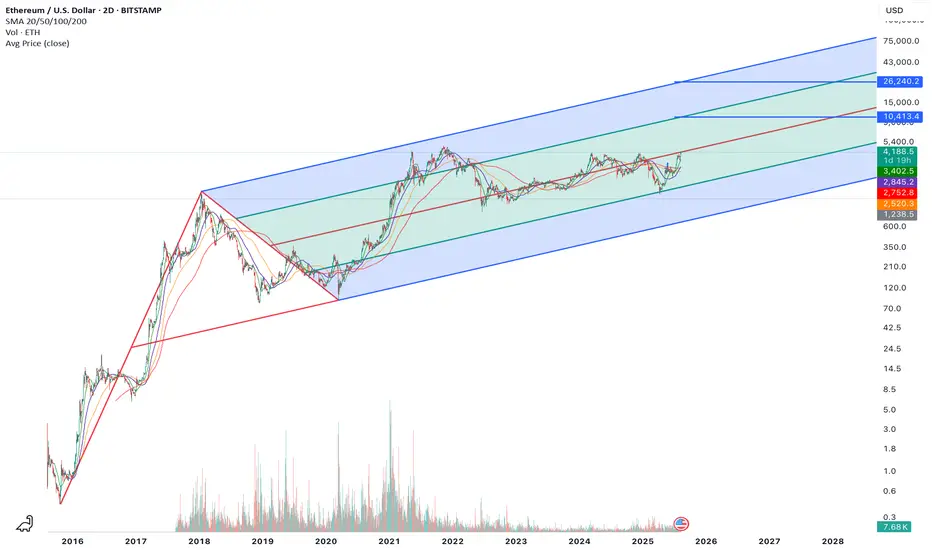
Ethereum’s $26K Path: Pitchfork Precision Meets 401(k)🚀 Ethereum’s $26K Path: Pitchfork Precision Meets 401(k) Mega Capital Inflows
Ethereum’s long-term pitchfork structure — stretching back nearly a decade — has been an uncannily accurate roadmap for the asset’s entire price history. Every major bull run and retracement has respected these channel boundaries with surgical precision. And now, the math points to a euphoric cycle peak near $26,240.
But here’s what’s different this time: a perfect storm of structural, macro, and legislative catalysts could fuel the most explosive Ethereum rally in history.
1️⃣ The Technical Blueprint: ETH’s Pitchfork to the Moon
The chart above speaks for itself:
Multi-cycle median line respect → Every parabolic move in ETH has peaked near the upper bound of this pitchfork.
2025 setup mirrors 2017 & 2021 → Both prior cycle expansions occurred from near the lower channel up to the upper band within 12–18 months.
Current positioning → ETH is breaking away from the midline, with momentum building toward the $10.4K resistance area before a final euphoric move to the $26K upper band.
2️⃣ The Game-Changer: Trump’s 401(k) Executive Order
On August 7, 2025, President Trump signed an executive order allowing 401(k) retirement plans to invest directly in private equity — and by extension, in private tokenized assets and alternative vehicles that can include crypto exposure.
Why this matters for Ethereum:
$7.3 trillion 401(k) market in the U.S. alone.
Even a 1% allocation into ETH through tokenized or pooled products equals $73 billion in demand — over 25% of ETH’s current market cap.
Coupled with upcoming Ethereum-based private market tokenization rails, this could create persistent retirement-driven demand that never existed before.
3️⃣ Ethereum’s Unstoppable Macro Tailwinds
Beyond the 401(k) shockwave, ETH’s macro positioning has never been stronger:
BlackRock’s Ethereum staking ETF pending SEC approval — opening the floodgates for institutional inflows.
Ultra-sound money supply mechanics — ETH’s burn rate has outpaced issuance in multiple months, meaning supply is shrinking while demand is about to accelerate.
Tokenization megatrend — Real estate, private credit, and commodities are increasingly issued on Ethereum rails, boosting transaction demand and fee burns.
Layer 2 explosion — Rollup adoption is pushing more economic activity onto Ethereum, while fees and settlements still flow to ETH validators.
4️⃣ The Cycle Anatomy: How $26K Happens
If history rhymes, here’s how the final leg could unfold:
Breakout to $6K–$7K as ETF approval and 401(k)-related flows kick in.
Acceleration to $10.4K — the mid-pitchfork resistance — as retail and media hype return.
Parabolic blow-off into the $20K–$26K zone as institutional + retirement inflows collide with ultra-low liquid supply.
5️⃣ Why This Time Could Overshoot
Unlike past cycles, Ethereum now sits at the intersection of:
Institutional-grade adoption (BlackRock, Fidelity, JPMorgan)
On-chain structural scarcity (post-merge burn dynamics)
Legislative green lights (401(k) access to alternatives)
Global macro rotation into risk assets as interest rates pivot
If prior cycles were crypto’s “dot com era,” this one is the mobile internet + cloud migration phase — except ETH is the protocol on which everything runs.
Bottom line:
The $26K target isn’t just a chartist’s fantasy — it’s a mathematically reinforced roadmap now backed by the largest pool of retirement capital in the world.
Ethereum is no longer just “digital oil.” With this convergence of technical, macro, and legislative forces, it’s becoming the primary settlement layer for global finance — and this cycle could be the moment the market finally prices that in.
Nifty Analysis - WeeklyWith simple Monthly OHLC setup - Here is the Nifty's current support for the coming week.
23935 is the level where Sharks have laid their bet.
If 23935 falls for gaining support this time then the next level is at 22195 - 21965

Bitcoin : Stay heavy on positionsSame view as before. No change.
Bitcoin : Stay heavy on positions (2x)
For new Bitcoin entries, now is the time.
If you're using leverage, I’d wait for a scale-in signal before jumping in.

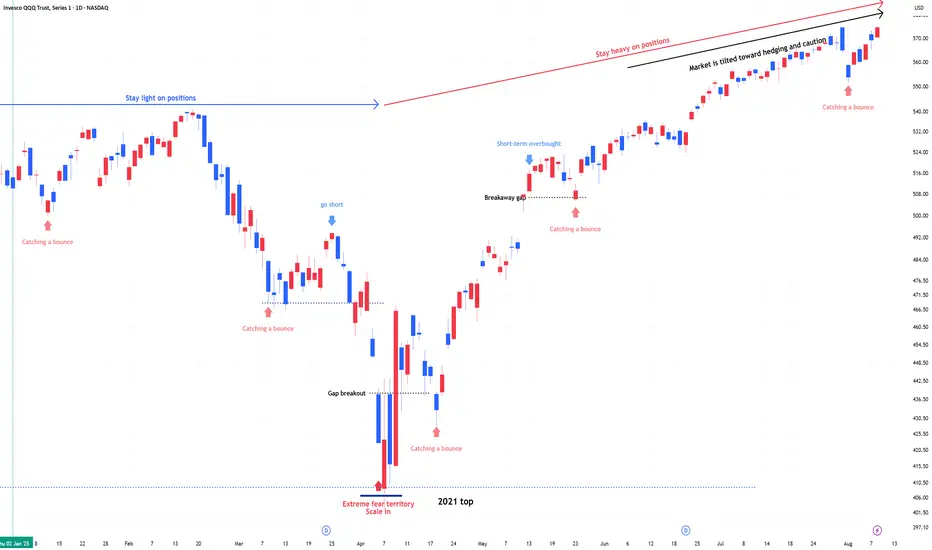
QQQ , Stay heavy on positionsQQQ , Stay heavy on positions. (QLD, TQQQ)
Despite the rebound, the market remains tilted toward hedging and caution.
In stay light on positions zones, I hold QQQ and reduce exposure.
In stay heavy on positions zones, I increase allocation using a mix of QLD and TQQQ.