GOLDA quick look at yesterday price action and our setup, then we did our normal ritual of daily analysis. we are totally bearish on Gold. we will wait on price movement and validation before we eventually jump on the train for a sell
Beyond Technical Analysis

DAILY TRADER’S PLANNER🌅 MORNING PREP
⏰ 6:00 a.m. – 6:45 a.m. | Ground the Mind
Light movement / stretching / walk
20–25 min mindfulness meditation
5 min breath journaling:
My emotional tone this morning
Any lingering bias, fear, or excitement from yesterday?
What does a calm, rule-following day look like?
🧠 Anchor Phrase:
“I will execute my edge with clarity, not with hope.”
🧠 MARKET PREP
🕕 6:45 a.m. – 7:30 a.m. | Systems First
Review open trades: still valid per system?
Check watchlist: any potential setups for today?
Pre-calculate entry, stop, and position size for each
If in drawdown: confirm size adjustment without changing rules
📚 PRE-MARKET NOURISHING TIME
🕖 7:30 a.m. – 8:30 a.m. | Detach Before the Storm
No charts, no news, no Twitter
Read non-market material (Zen, philosophy, biography)
Eat a light, mindful breakfast.
2-minute breath anchor before charts
📊 FINAL SCAN & ORDER PREP
🕣 8:30 a.m. – 9:15 a.m.
Check for overnight/pre-market price shifts.
Finalise trade orders: entries, stops, position sizes
Place limit/stop orders or set alerts
Mentally commit to no improvising.
🔔 NYSE OPEN – CONTROLLED EXECUTION
🕤 9:30 a.m. – 10:00 a.m. | First 30 Minutes
Monitor for order fills or open adjustments per rules
Avoid impulsive trades — wait for planned triggers
Log trades immediately if filled
⏳ MID-SESSION CHECKS
🕛 12:00 p.m. | Halfway Through
Scan for stops hit / targets reached
Adjust only per system rules
Breathing reset before clicking anything
📉 MARKET CLOSE REVIEW
🕓 4:00 p.m. – 4:15 p.m.
End-of-day close review for signals
Record trades and update journal (R-multiples, emotional state)
Note any pending setups for tomorrow
🛑 POST-MARKET DECOMPRESSION
After 4:15 p.m. – until next morning
All trading screens off by 6:00 p.m.
Movement or nature time
Dinner without market talk or news
Fiction reading or creative time
Gratitude journaling
🌀 WEEKLY REVIEW (Saturday Morning)
R-multiples gained/lost
Did I follow the system in all trades?
Any emotional overrides?
Any refinements needed for execution or prep?

GOLD - been waiting for 2 weeksTeam, I have been waiting GOLD for two week to short at 3404-3410
i just woke up and missed the short
Price current at 3401 - I am shorting NOW
Target 1 at 3386 - take 70% volume and BRING STOP LOSS TO BE
Target 2 at 3365
LETS GO

XRP Settlement August 15th, 2025 $33.00 & $1,031 May 23, 2026XRP is positioned for a major move on August 15th, 2025
when XRP reaches $30.00 - $33.00, it has two algorithmic delivery paths:
Path 1 (blue): Targeting $300 by August 23, 2026.
Path 2 (red): Parabolic extension to $1,031 by May 23, 2026.
“By the time you hear about it, it’s already too late.”
"News is the excuse for the moves."

XRP and 200% proif After a 100% gain in the previous signal, Ripple has a target of more than 200% ahead, and with a good buy, you can make a great profit.

Back to $4 - XRP weekly update August 7 - 13thXRP is currently advancing within a Minor Wave 3, which forms part of an Intermediate Wave 5 — itself completing a larger Primary Wave 1. This alignment across multiple degrees of trend suggests that XRP may be in the early stages of a broader bullish cycle with meaningful upside potential. The structure of the preceding Intermediate Wave 3 is clearly impulsive, which supports the idea of sustained continuation.
There is, however, some ambiguity in the early part of this current impulse — particularly in the development of Minor Wave 1. This leaves room for an alternative scenario that assumes a more complex correction may still be in progress. This would only be confirmed if the Wave 4 low is breached, thereby invalidating the current impulsive count.
Sentiment and market data currently favour the bullish outlook. Funding rates are positive, showing that the market is leaning long, and open interest is rising, indicating increased trader participation. Furthermore, the liquidity heatmap shows a notable cluster of liquidity above current price, which could serve as a magnet during a third wave — typically the most dynamic part of an impulsive move.
On a broader level, this anticipated momentum could also be fueled by macroeconomic developments. For much of the year, capital inflows into crypto were restricted by the Federal Reserve’s reluctance to lower interest rates. However, that could change soon: according to the CME Group’s FedWatch Tool, there’s a 93.6% probability of a rate cut at the upcoming FOMC meeting in September. Markets tend to front-run such events, and this expectation could trigger renewed retail buying — precisely the kind of sentiment shift that often fuels Wave 3 advances.
Importantly, institutional players appear to have already positioned themselves earlier, as evidenced by the formation of order blocks near the end of Wave 2. This suggests that what we’re witnessing now may be retail-driven momentum building on top of smart money accumulation — a classic dynamic in developing third waves.
As long as the current structure remains intact and the Wave 4 low holds, XRP is well-positioned for further upside — with the $3.50–$3.88 zone as a near-term target. The technicals, sentiment, liquidity positioning, and macro backdrop all point in the same direction: higher.

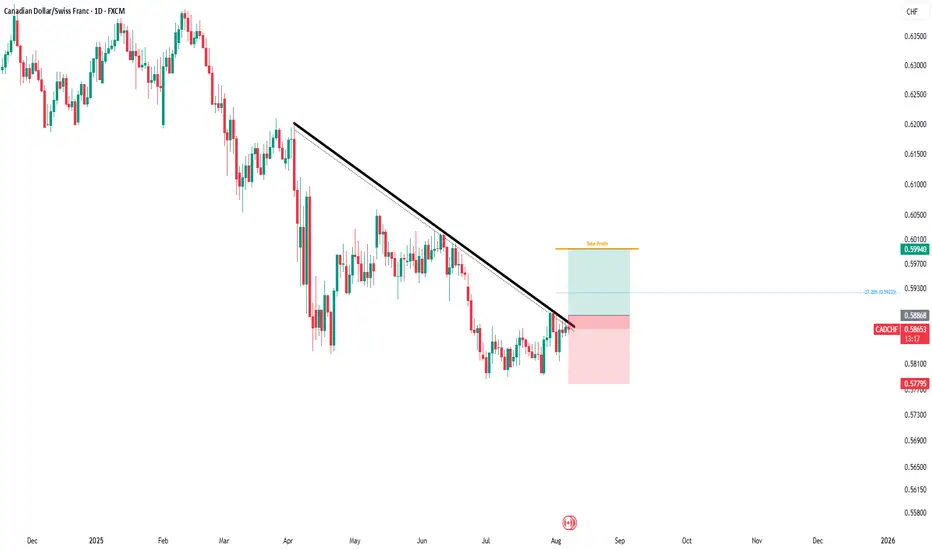
CAD/CHF - LongCAD/CHF has established a well-defined bullish channel, with price action suggesting further upside momentum. Technical projections indicate a probable advance toward the –27% Fibonacci extension level, which aligns with our breakeven target and serves as the immediate upside objective.
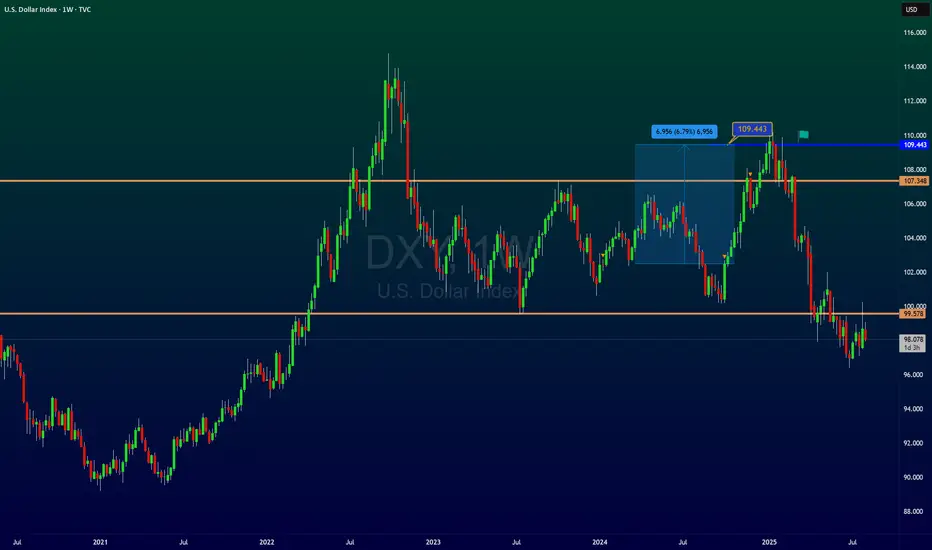
DXY and a huge profit Resault: &$& pips ProfitAfter a long time, I'm back with new and profitable analyses, but before that, let's take a look at the previous analyses and update them.
stay with me and support my ideas
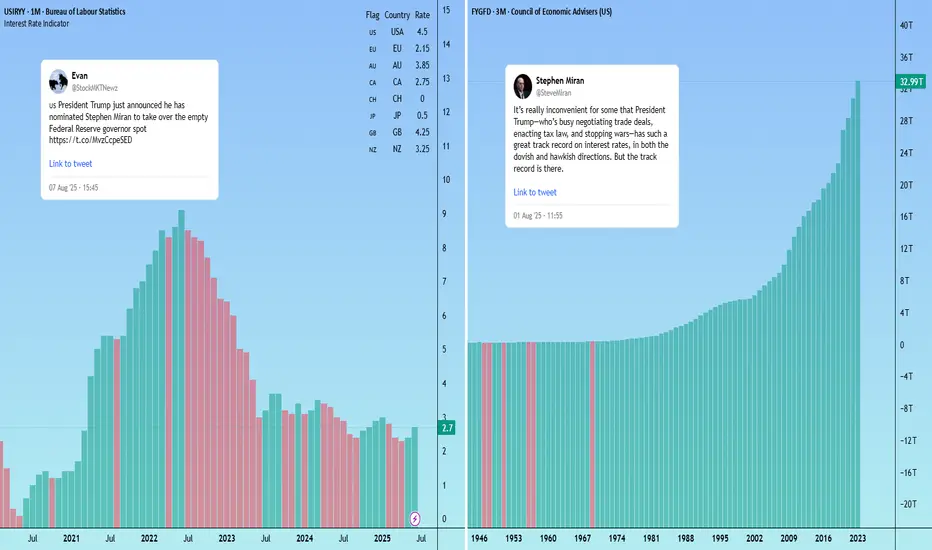
Trump’s Fed pick signals potential softer dollar US President Trump has named CEA Chair Stephen Miran as the temporary replacement for Fed Board member Adriana Kugler, serving until at least January 31, 2026.
As expected, Miran is closely aligned with Trump’s policy views, including support for tariffs and scepticism over the Federal Reserve’s independence.
Notably, Miran is a critic of the U.S. dollar’s current strength and is the author of the “Mar-A-Lago Accord” — a proposal to deliberately weaken the dollar to address the U.S. current account deficit.
The White House is also searching for a new Fed chair. If markets believe the next chair will prioritise Trump’s agenda over an independent monetary policy (a safe assumption at this stage) investors may demand higher yields on U.S. debt to hedge inflation risk. That could add volatility to US pairs.
NZDCAD higher bullish for expect
OANDA:NZDCAD price in PA, its make bounce on bottom line of PA, here after todays events expecting higher bullish continuation.
SUP zone: 0.81500
RES zone: 0.82600, 0.82850

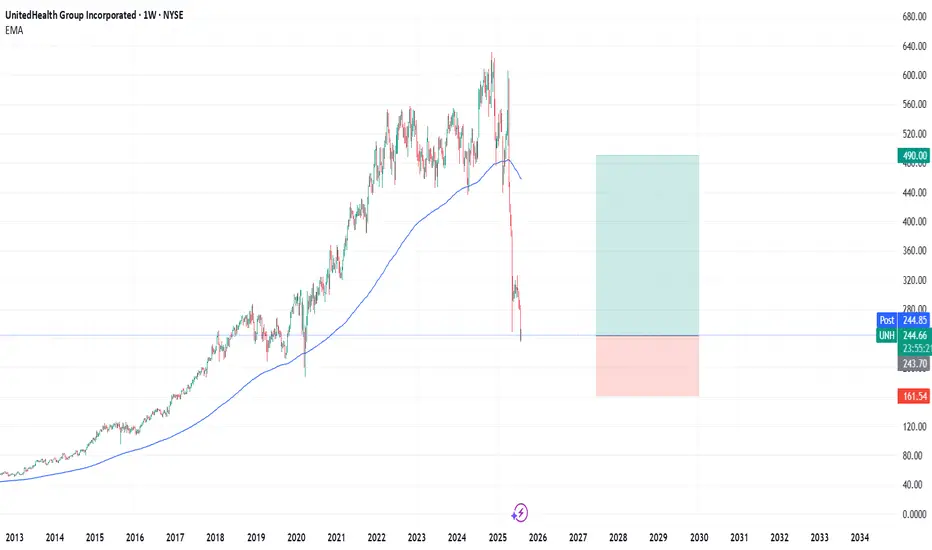
UNH : Stubborn is my First Name Hello friends,
While stubbornness and determination are very different concepts, "stubborn" is more meaningful for events whose outcome we cannot predict.
1- First of all, hedge amount for this trade should be allocated to very safe and more stable financial instruments, at least 6-7 times the position size of this trade.
2- This idea is a continuation of my opinion regarding UNH.
3- I defend the following general view:
This was a situation I carefully considered and formulated (holding UNH shares for the medium term).
Therefore, a price drop will not change my opinion in any way.
Increased costs are mentioned for some items, but their share of stock revenue is not stated.
4- Still valuable Risk/Reward Ratio
5 - Reasonable P/E Ratio and financials
Let's not forget item 1, because it will be necessary in three situations:
a- A major financial collapse in the stock
b- A global economic crisis.
c- Even if these are not the case, a gradual buyback (total x amount pos size) at 215 and 200
Parameters (for People who dont want to hold) :
Risk/Reward Ratio : 3.00
Stop-Loss : 161.54
Take-Profit Point : 490.00
Best Regards.
ETHUSDTPreferably suitable for scalping and accurate as long as you watch carefully the price action with the drawn areas.
With your likes and comments, you give me enough energy to provide the best analysis on an ongoing basis.
And if you needed any analysis that was not on the page, you can ask me with a comment or a personal message.
Enjoy Trading ;)

CRUDE OILPreferably suitable for scalping and accurate as long as you watch carefully the price action with the drawn areas.
With your likes and comments, you give me enough energy to provide the best analysis on an ongoing basis.
And if you needed any analysis that was not on the page, you can ask me with a comment or a personal message.
Enjoy Trading ;)

BTCUSDTPreferably suitable for scalping and accurate as long as you watch carefully the price action with the drawn areas.
With your likes and comments, you give me enough energy to provide the best analysis on an ongoing basis.
And if you needed any analysis that was not on the page, you can ask me with a comment or a personal message.
Enjoy Trading ;)

GOLDPreferably suitable for scalping and accurate as long as you watch carefully the price action with the drawn areas.
With your likes and comments, you give me enough energy to provide the best analysis on an ongoing basis.
And if you needed any analysis that was not on the page, you can ask me with a comment or a personal message.
Enjoy Trading ;)

EURUSDPreferably suitable for scalping and accurate as long as you watch carefully the price action with the drawn areas.
With your likes and comments, you give me enough energy to provide the best analysis on an ongoing basis.
And if you needed any analysis that was not on the page, you can ask me with a comment or a personal message.
Enjoy Trading ;)

USNAS100Preferably suitable for scalping and accurate as long as you watch carefully the price action with the drawn areas.
With your likes and comments, you give me enough energy to provide the best analysis on an ongoing basis.
And if you needed any analysis that was not on the page, you can ask me with a comment or a personal message.
Enjoy Trading ;)

EURUSD | Eyes on the 50EMA — One Bold Candle and I’m All InThe 1-hour chart has carved a beautiful bullish range from 1.1565 to 1.1696. A little 15-minute pullback tried to test our love, but I’ve got all the signs — the retracement is over, and the ride is calling again.
WHAT TO DO
Just one confident Marubozu closing above the 50EMA, and I’m jumping in — no hesitation, no second thoughts. Let’s ride this story back to the top.
TP1: 1.1696 (where the heart first skipped)
TP2: 1.1716 (where dreams begin)
SL: If that candle speaks loud and clear, my stop loss will be just below it — because love deserves a little risk, but never recklessness.
WHAT IF IT WONT CROSS?
This is day trading setup. While watching 15m candle to bear below 50EMA also I glance 1hr chart. This setup will be valid as long as 1hr chart is still in bearing range.
Wish me luck — this might just be the ride of the day! 💞📈

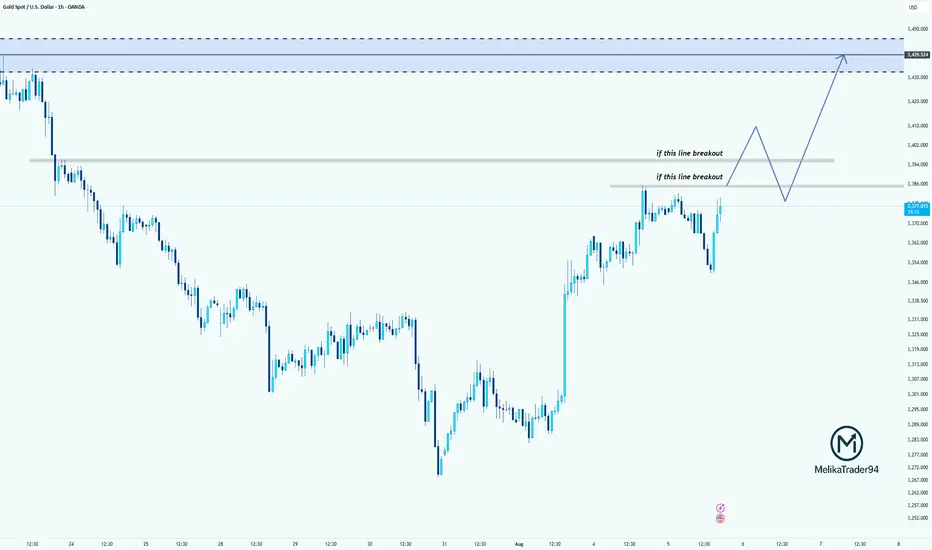
Breakout Levels in Focus for XAUUSDWhy did I say to cancel the last position? because gold is in the critical area!
Price is testing a key resistance area around 3374.
If it breaks above the first resistance level, we may see a bullish continuation toward the second breakout line.
If both levels are broken and retested successfully, the path toward the supply zone at 3430–3440 opens up.
Patience and confirmation are key here!
EUR/USD Bullish Outlook – Why the Euro Could Strengthen📈 EUR/USD Bullish Outlook – Why the Euro Could Strengthen
EUR/USD is showing signs of a potential rebound, supported by both technical setups and shifting fundamentals.
1. Dovish Fed Expectations:
Markets are increasingly pricing in Fed rate cuts as U.S. inflation cools and economic growth shows signs of slowing. A more dovish Fed stance puts downward pressure on the dollar, offering support to the euro.
2. ECB Less Dovish Than Expected:
While the ECB has started easing, recent comments suggest a cautious approach to further cuts. If inflation remains sticky in the Eurozone, the ECB could pause or slow future rate reductions, which would support EUR.
3. Technical Support & Reversal Patterns:
EUR/USD has bounced off strong support forming a bullish reversal pattern (e.g. double bottom / bullish engulfing candle). Momentum indicators like RSI and MACD are turning upward, signaling potential continuation of the move.
4. Improving Eurozone Data:
Recent Eurozone data has surprised to the upside, especially in manufacturing and services PMIs. If this trend continues, confidence in the euro could rise.
📌 Conclusion:
With growing expectations for a Fed pivot and signs of stabilization in the Eurozone economy, EUR/USD could push higher.

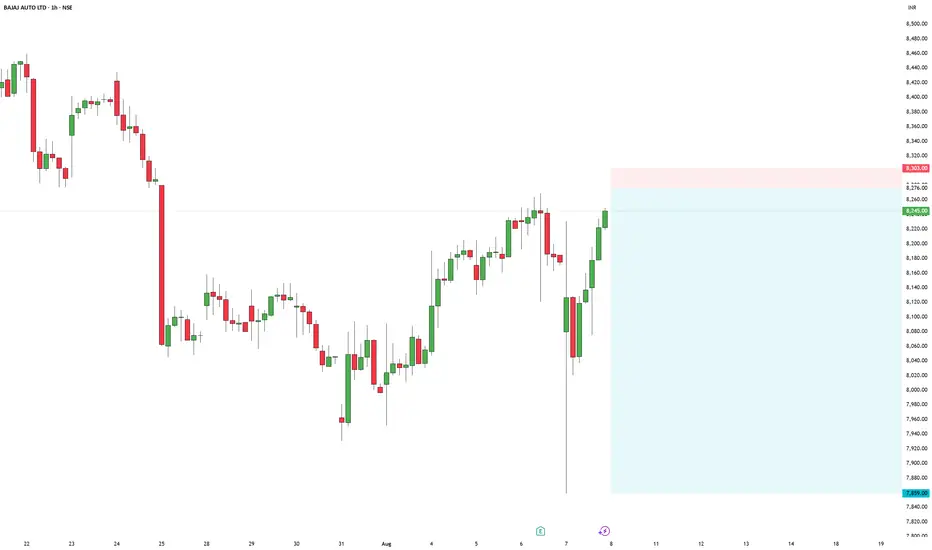
BAJAJAUTO short setupBajaj-Auto short setup
CMP - 8245
Entry - 8276
Stop loss - 8303
Target - 7859
Risk Reward - 1:15.44
NAS100 - LONGPrice pushed down a lot lower than I thought it would but sentiment still remains the same. Waiting for bullish confirmation for price to reach today's highs.
