GOLD Potential Bullish Fallowing the PullbackGold is currently forming a trading range, with recent price action indicating a test of support, which may mark the end of the recent pullback. Yesterday, gold retraced toward the 3391 level, showing signs of short-term recovery.
Key Market Focus
The market is closely watching developments around the Federal Reserve appointment, including the potential replacement of Chair Powell. Trade-related comments from Donald Trump are also creating uncertainty. These geopolitical and macroeconomic factors may trigger a new correction or volatility phase in gold.
Resistance: 3400 / 3425
Support: 3355 / 3350
Price action confirmed a false breakout to the downside, with strong buying interest near the 3350–3355 support zone. If the price holds above this support, it strengthens the case for a bullish continuation. A break and close above 3400 could pave the way toward 3425 and potentially higher Growth.
You may find more details in the chart.
Trade wisely Best of Luck Buddies.
Ps: Support with like and comments for better analysis Thanks
Beyond Technical Analysis

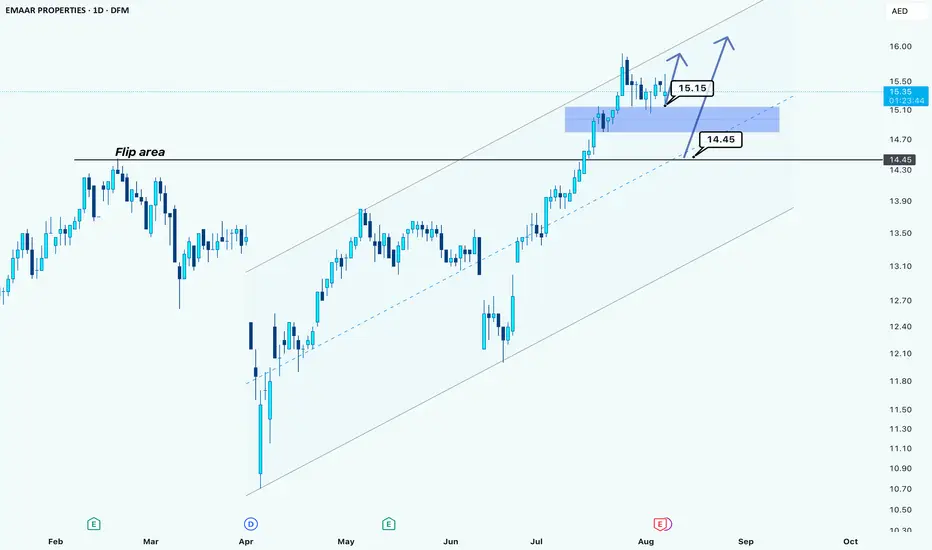
Emaar is Screaming Bullish – Daily Analysis Hello guys!
We're currently seeing strong bullish momentum on EMAAR, trading around the 15.35 zone.
🔎Key Zones to Watch:
✔Former Supply & Demand Area (15.15 - 15.00)
This zone is now acting as a strong support. Price dipped into it and showed clear signs of buyer pressure, a solid area to consider long entries if price revisits.
✔ Flip Area (14.45)
Previously a resistance, this level has now flipped into potential support. If the price breaks below the first zone, this becomes a second entry point to go long. Expect a strong buying reaction here if tested.
👉The bullish channel remains intact, and both zones are backed by structure and momentum. The buying pressure is clearly dominating.
🎯Target: Upside potential remains towards 16.00 + in the coming sessions if the bullish structure holds.
Based on the last P&L: Emaar posted strong 2025 results with revenue up 38% YoY to AED 19.83B!
GBP/JPY - Full Trade Plan📉 GBP/JPY Short Setup – Structure Cracking Below
Pair: GBP/JPY
Timeframe: 4H / Daily
Bias: Bearish
Entry Zone: 196.900 - 197.100 (71% + EMA Retest)
Target Zones:
🔹 TP1: 195.00
🔹 TP2: 190.00 (W-Target)
🧠 Technical Breakdown:
✅ 4H Structure Shift Confirmed
Price has broken and shifted structure on the 4H timeframe.
Multiple BOS (Breaks of Structure) confirm a weakening bullish trend.
✅ Daily Still Holding – But Weak
Daily structure hasn't fully flipped yet, but bullish pressure is cracking.
This gives us a high-risk-reward opportunity before full higher-timeframe confirmation.
✅ Breakout & Retest + 71% Retracement
Classic breakout and retest pattern from the high.
Price has pulled back into the 71% Fib level, providing a premium entry.
✅ Retest of EMA + Contested POI
Price also tested the 4H EMA, acting as dynamic resistance.
This zone overlaps with a previous point of interest (POI) – heavy confluence for sell pressure.
📌 Sell Plan:
Sell Zone: 196.900 – 197.100 (watch for rejection candles or LTF structure breaks)
Stop Loss: Above the last swing high or EMA
Take Profits:
TP1: 195.00
TP2: 190.00 (Weekly Target)
⚠️ Risk Management
Only execute once LTF confirms entry (M15/M5 BOS or bearish engulfing rejection).
Position size with R:R in mind; this setup offers a potential 1:4+ move.
🗓️ Market Outlook:
GBP/JPY is showing early signs of rolling over. The 4H shift, combined with a premium retest and EMA rejection, creates a clean short window. Watch the daily close for full confirmation.
🔔 Like and follow for more clean smart money & structure-based setups.

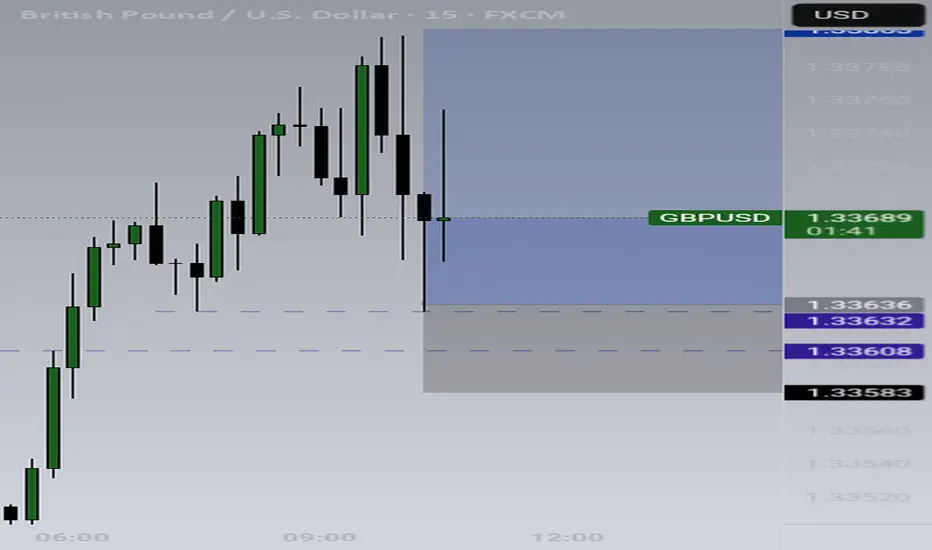
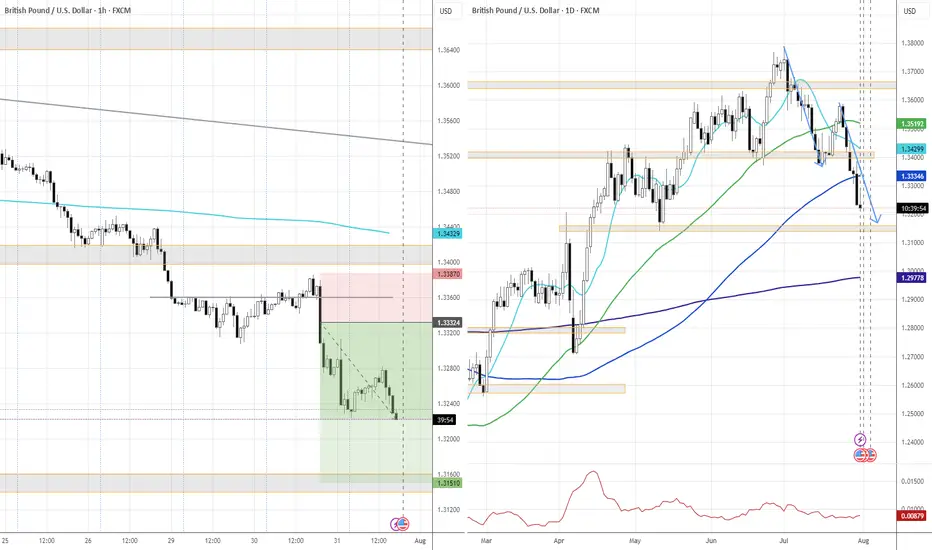
GBP/USD - Daily Bearish movement inbound📉 Long-Term Sell Plan – Major Bearish Reversal in Play
Pair/Asset:
Timeframe: 4H / Daily / Long-Term Outlook
Bias: Strong Bearish
Entry Zone: 71% Premium Level Retest
Target Zones:
🔹 3M Target (1.21000)
🔹 Monthly Imbalance Zone (1.16000)
🧠 Technical Breakdown:
✅ Head & Shoulders Formation
Classic reversal structure at the top of the range.
Neckline has been broken, confirming loss of bullish momentum.
✅ Break of Daily Structure (D-BOS)
Multiple structure breaks confirming a full bearish market shift.
Price is no longer respecting previous higher lows.
✅ Retest of 71% Premium Level
Price has pulled back precisely into the 71% Fibonacci retracement zone, aligned with:
The broken neckline
Previous external range high
Overlapping Supply Zone
✅ Breakout & Retest Setup
The market has broken down and is now in a classic retest phase, offering optimal entry for continuation shorts.
✅ EMA Rejection + Trendline Break
Price rejected the EMA during the retest – a strong dynamic resistance confirmation.
Long-term trendline has also been decisively broken.
📌 Sell Plan:
Sell Zone: Around the 71% level after confirmed rejection
Stop Loss: Above the right shoulder / supply zone
Take Profits:
TP1: 3M target zone
TP2: Monthly imbalance target
🚨 Risk Management
Trade with confirmation. Watch for rejection candles or lower-timeframe BOS around the 71% level before executing.
🗓️ Market Outlook:
With structure shifting, liquidity taken, and premium pricing retested, we’re in a prime position for long-term distribution. Keep an eye on key zones and trail stops accordingly.
🔔 Like and Follow for more clean structure-based trade setups!

Bullish Flag Pattern.
Bullish Flag Pattern.
Crossing 435 with Heavy volumes will
trigger more positivity & will expose
New Highs targeting 700+
On flip side, breaking 300 now, will
bring more selling pressure.

XAUUSDHaving some SMC tecs counting with, Also with a harmonic pattern present, we'd say that it's time for the trend ends up.


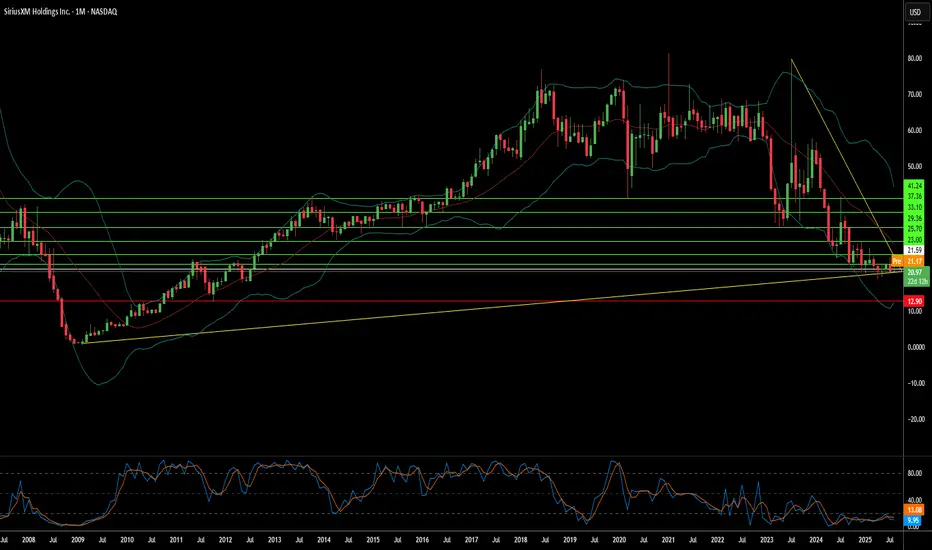
Why Does Buffett See Gold in a Declining Satellite Empire?Warren Buffett's Berkshire Hathaway has significantly increased its stake in Sirius XM Holdings to 37%, valued at approximately $2.6 billion, despite the company facing declining subscriber numbers and revenue challenges. This substantial investment reflects Buffett's confidence in the satellite radio company's long-term potential, driven by its stable subscription-based revenue model that generates over $1 billion in annual free cash flow from 34 million subscribers. The company's predictable cash flows and 5% dividend yield align with Buffett's preference for businesses with consistent earnings during economic uncertainty.
Sirius XM is actively adapting to the digital media landscape through technological innovations and strategic acquisitions. The company has introduced new offerings, including an ad-supported free version, acquired Pandora to strengthen its digital presence, and launched the 360L platform, integrating satellite and streaming content. These initiatives, combined with exclusive content deals such as high-profile podcasts, aim to differentiate Sirius XM from competitors like Spotify and Apple Music while attracting younger demographics and diversifying revenue streams.
The company faces several macroeconomic and geopolitical challenges that could impact its performance. Its close ties to the automotive industry make it vulnerable to fluctuations in car sales driven by interest rates and consumer confidence, while potential trade tariffs could increase vehicle prices and reduce subscriber growth. Additionally, as a satellite technology company handling vast amounts of personal data, Sirius XM must navigate international telecommunications regulations and heightened cybersecurity risks in an increasingly volatile geopolitical environment.
Despite these challenges, Sirius XM's strategic position appears compelling to value investors. The company's cost-cutting initiatives, targeting $200 million in annualized savings, combined with its established satellite infrastructure and focus on exclusive content, provide a solid foundation for a potential turnaround. With Buffett's backing and strategic support, Sirius XM's emphasis on operational efficiency, subscriber retention, and innovation could deliver significant value for shareholders as it transitions through the evolving media landscape.
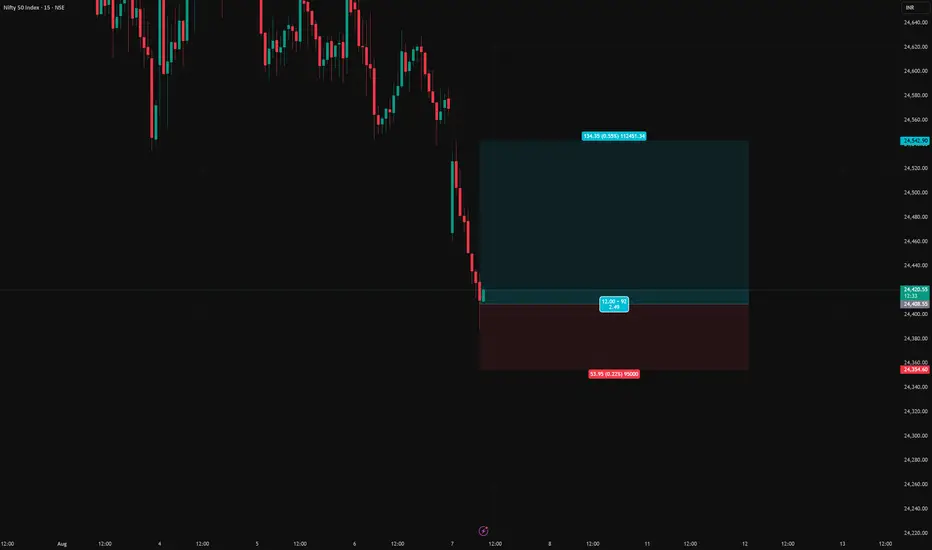
NIFTY long setupNifty long setup
Entry price - 24408.55
Stop loss - 24354.60
Target - 24542.90
Risk Reward - 1:2.5
Nifty !!Nifty at the deciding point. I cannot write my view but some people will get an idea what I am talking about.

GOLD TRADE ANALYSIS – MISSED ENTRY & NEW OUTLOOK📈 GOLD TRADE ANALYSIS – MISSED ENTRY & NEW OUTLOOK 💡
07 August 2025 | XAUUSD | 15m TF
In the recent price action on Gold, I spotted a clean mSS (market structure shift) confirming bearish intent after liquidity sweep. Unfortunately, my first ideal entry near the supply zone was missed as price barely tapped the POI before delivering a significant drop.
However, the market offered a second chance — forming another bearish order block before diving into the discounted zone (demand area). This ultimately led to a strong bullish reaction, confirming accumulation and paving way for the rally we've just seen.
🔍 Current Expectation:
Price has now cleared internal liquidity and is pushing toward $3,396 — an important external liquidity level. I'm watching for:
A possible reaction/rejection from this high
Or a clean break and retest for continuation to $3,410+
🧠 Lesson:
Always remember, missed entries are part of the game. The key is not chasing — but re-aligning with the structure and waiting for fresh confirmations. Gold continues to respect key imbalances and reacts well around session opens.
📊 Let’s see how price reacts around this high. Any signs of weakness could offer a new intraday short opportunity.
#XAUUSD #GoldAnalysis #SmartMoneyConcepts #OrderBlocks #MarketStructure #ForexTrading #LiquiditySweep #TradingPsychology #RiskManagement #PriceAction #ForexNigeria #GoldTraders #FXSetup

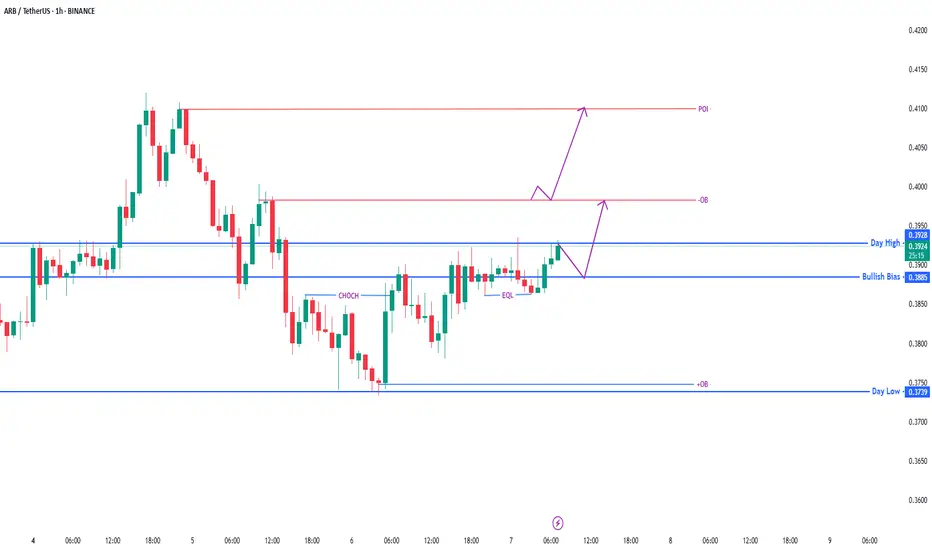
ARB/USDT 1H – Clean Breakout, OB Retest & Push to POI CHoCH confirmed bullish intent, and price now breaking above Day High. Eyeing retest around Bullish Bias before a push to the upper OB and POI.
🔹 Clean EQL formation before breakout
🔹 OB + POI above offer next liquidity targets
📌 Watching for reaction on pullback near 0.3885
Smart entry comes from smart patience — let the market come to you.
Tesla Stock Gains After Musk Gets $30 Billion Award — What Now?Tesla board is hoping that the pile of shares would be enough to pin down the CEO and lock down his focus. But challenges are there. Here’s one — $30 billion might not be enough to keep Musk around.
💰 $30 Billion Retention Bonus
Tesla stock NASDAQ:TSLA is up about 4% since the start of the week after the board of directors handed Elon Musk a gift-wrapped, legally-contingent $30 billion stock package .
What’s inside? A cool 96 million shares — nearly enough to buy a small country or, at the very least, keep Musk’s wandering focus in the Tesla lane.
In a letter to shareholders, the board didn’t mince words: “We are confident that this award will incentivize Elon to remain at Tesla. Retaining Elon is more important than ever.” Translation: “Please don’t leave, here’s money.”
This isn’t just about stock awards or executive compensation. It’s about bringing back lost focus and whether the most famous CEO on the planet can be convinced to stop juggling a handful of companies and pay full attention (ok, more attention) to the one that’s public, highly volatile, and still kinda trying to figure out self-driving and robotaxis .
🎢 If the Stock Could Talk
The market’s response? Pretty bullish. Traders seem to like the idea of Musk staying inside the Tesla factory gates — or at least not moonlighting in so many side quests.
After all, Elon’s presence — erratic tweets, spontaneous product reveals, and all — is a core part of Tesla’s brand value. The stock has often behaved more like a crypto coin than a traditional automaker.
Musk already owns over 400 million shares, around 13% of Tesla, worth roughly $125 billion. But he’s gunning for more: his long-stated ambition is 25% voting control (equal to $250 billion in shares based on the current $1 trillion market valuation. This new package edges him closer to that goal. If he can’t own a country, a quarter of Tesla might do.
⚖️ A Legal Complication Worth $56 Billion
There’s one tiny footnote here: if Elon wins back his 2018 $56 billion pay package — the one struck down by a Delaware court — he might have to forfeit this new batch.
So yes, Tesla may have just given the richest man in the world a “Plan B” golden parachute. Or a “Plan A” depending on how Delaware judges are feeling when they decide on it.
🤖 AI, Robots, and Attention Deficits
Let’s not forget what lit the fire under this latest move. Back in January, Elon posted on X that he was “uncomfortable growing Tesla to be a leader in AI & robotics” without more control. It was a public shakedown — and apparently it worked.
Tesla’s ambitious AI goals — full self-driving software, Optimus the humanoid robot, and a suite of other sci-fi-sounding visions and promises — are largely tied to Musk’s personal involvement. Investors know that without him, these projects could end up shelved… or sold to xAI, his other pet project and owner of X (former Twitter).
🧮 The Math of Mega-Pay
Tesla says the accounting value of the package — after subtracting what Musk would have to pay to exercise the options and adjusting for restrictions — sits at about $23.7 billion. That's about the GDP of Malta and only slightly smaller than the SEC’s collective headache every time Musk tweets.
In return, Musk has to stick around for five years — or at least not officially leave. The board hopes that’s enough to keep him engaged. But the question is: How much is enough to counteract everything else going on?
The man’s worth $350 billion to $400 billion (depending on volatility) and if he wants to build Martian houses or dig tunnels under Paris, a few billion dollars aren’t going to make a difference.
🔀 A Shifting CEO, A Shaky Business?
It’s not just about Elon’s attention span. Tesla’s business hasn’t exactly been smooth sailing. The EV market is more crowded than ever. Sales are dropping in Europe. Tariff threats are buzzing in the background.
On top of that, it’s the earnings season and the Earnings calendar is hot to the touch. In recent quarters, Elon’s perceived absence from the factories have coincided with slumping revenue and nervous investors.
Add in the fact that Elon just exited the Trump administration after a brief stint and dramatic fallout — yes, that happened — and Tesla investors are understandably hoping for a little more focus in the months ahead. Not to mention his new Washington gig — his “America party” political party .
🚗 Is Tesla Still a Growth Story?
Tesla is still the largest EV maker in the US, but the shine has worn off a bit. The Cybertruck’s still not mainstream, Model 3s are getting old, and margins are being squeezed by global competition and pricing wars.
If Musk is serious about staying and building, this could be Tesla’s opportunity to pivot — from hype-driven volatility to sustained, AI-powered growth. But if not, well... there’s SpaceX. Or xAI. Or Neuralink. Or The Boring Company. Or the next startup he tweets into existence.
Off to you : Do you feel like Tesla is paying Elon to stay interested — or rewarding him for prior (and future?) performance. And is that the way to buy loyalty and dedication? Share your thoughts in the comments!

USDCHF 30.07.2025~+ Pressure on Powell, Waller is dovish
~+ Anticipation of the Trade deals deadline

Is the US Central Bank Going to Cut Interest Rates At All?After the US announced fresh tariffs globally on 1st of August, the markets experienced a meltdown, followed by a rebound the next trading day.
The reason cited: traders are anticipating that the Fed to cut interest rates soon with the 30 day Fed fund moving much higher.
We will track the traders’ sentiment behind this anticipation, and learn how we can access to its fund flow.
30 Day Federal Funds Futures and Options
Ticker: ZQ1!
Minimum fluctuation:
1/2 of one basis point (0.005) = $20.835
Disclaimer:
• What presented here is not a recommendation, please consult your licensed broker.
• Our mission is to create lateral thinking skills for every investor and trader, knowing when to take a calculated risk with market uncertainty and a bolder risk when opportunity arises.
CME Real-time Market Data help identify trading set-ups in real-time and express my market views. If you have futures in your trading portfolio, you can check out on CME Group data plans available that suit your trading needs www.tradingview.com

BTCUSD 1H – Liquidity Hunt & Bullish Reversal from POIBTC currently sits under key resistance near the OB (Order Block) zone. After a short-term CHoCH, price is expected to seek liquidity below Day Low and into the marked POI zone.
Here's the potential setup:
🔻 Price may dip below intraday support to clear weak lows
🔄 From POI zone, bullish reversal expected with targets at upper OB
🔹 Bearish Bias remains valid unless structure breaks cleanly above Day High
📌 Ideal trade path: liquidity sweep → reaction from POI → push to Day High or OB
High probability reversal setup forming for short-term bullish play if POI holds. Monitoring price action closely for confirmation triggers.

Gold May Pull Back Ahead of Fed Decision📊 Market Dynamics:
Spot gold is trading around $3,376.69/oz, down approximately 0.1%, as the US dollar strengthens and investors await Federal Reserve appointments, with continued rate-cut expectations for September
📉 Technical Analysis
• Key Resistance: ~$3,400 (analysts expect a test around this level)
• Nearest Support: ~$3,370 (near current trading range)
• EMA 09 (assumed): Price below EMA 09 → suggests short term bearish or consolidating momentum.
• Candlestick / Volume / Momentum: Mild selling pressure as USD gains, creating short term resistance for gold.
📌 Outlook:
Gold may experience a mild pullback or trade sideways in the short term if the dollar remains firm and no new catalysts strengthen rate cut expectations.
💡 Suggested Trading Strategy:
SELL XAU/USD : ~$3,395–3,398
o TP: 40/80/200 PIPS
o SL: ~$3,401
BUY XAU/USD : ~$3,365–3,370
o TP: 40/80/200 PIPS
o SL: ~$3,360

Markets in Rotation: Cyclical Stocks Take the Lead in 2025Markets in Rotation: Cyclical Stocks Take the Lead in 2025
Ion Jauregui – Analyst at ActivTrades
In a 2025 marked by tariff uncertainty, persistent geopolitical tensions, and stock markets that started the year at record highs, it seemed reasonable to favor defensive stocks. However, market behavior has made it clear that the rotation toward cyclical sectors has taken firm hold, leaving behind traditionally more stable segments. Since the imposition of reciprocal tariffs between the United States and China on April 2nd—an event known as "Liberation Day"—the indices experienced a brief correction that temporarily favored defensive sectors. Nevertheless, the swift rebound, led by U.S. equities, has returned the spotlight to cyclical stocks, which are now trading at historical highs relative to defensives, according to Bloomberg and Bank of America data.
According to MSCI classification, cyclical sectors include consumer discretionary, technology, industrials, financials, real estate, communication services, and basic resources. In contrast, defensive sectors consist of consumer staples, healthcare, energy, and utilities.
Leaders of the Rotation: Financials and Technology
In this context, two sectors have led the rotation: financials and technology. The former benefits from a high interest rate environment that boosts profit margins. In Europe, this backdrop has also fueled a rally in the banking sector, with the Stoxx 600 Banks index up 39% year-to-date. Meanwhile, the technology sector remains dominated by the “Magnificent Seven,” with Nvidia (+33%), Meta (+33%), and Microsoft (+27%) delivering strong gains thanks to the momentum of artificial intelligence and demand for digital solutions.
Lagging Sectors: Energy and Healthcare
On the other hand, the energy and healthcare sectors have weighed on defensive performance. Energy is suffering from bearish pressure on oil prices, driven by an oversupply led by OPEC. Healthcare has been hurt by former President Trump's proposals to lower drug prices in the U.S., directly impacting the margins of major pharmaceutical companies.
Rotation Reaches Europe: EuroStoxx 50 and DAX 40 on the Rise
Europe hasn’t been immune to this rotation. Both the EuroStoxx 50 and the DAX 40 have reflected this shift, especially benefiting banks, tech, and industrials, while leaving traditional defensive sectors lagging.
EuroStoxx 50: Boosted by Banking and Industry
The EuroStoxx 50, the eurozone’s benchmark index, is up 11.2% so far in 2025, thanks to strong performance in banking and industrials. Institutions like BNP Paribas, Santander, and ING have gained more than 30%, supported by high rates and share buyback programs. Industrial giants like Airbus and Siemens have also stood out, driven by increased investment in infrastructure and defense.
In contrast, defensive sectors like utilities and consumer staples have posted flat or negative returns, penalized by declining consumption in southern Europe and margin compression in energy.
DAX 40: Germany Aligns with the Cycle
Germany’s benchmark DAX 40 index has risen 13.8% year-to-date, strengthened by domestic recovery and exposure to cyclical sectors.
• SAP (+22%) and Infineon (+31%) lead the tech segment, benefiting from industrial digitalization and AI adoption.
• The automotive sector has also rebounded, with BMW and Mercedes-Benz gaining ground due to stabilization in the Asian market and the shift toward electric vehicles.
Conversely, healthcare companies such as Bayer and Fresenius have issued guidance cuts, reflecting global weakness in the sector amid regulatory pressure and legal challenges.
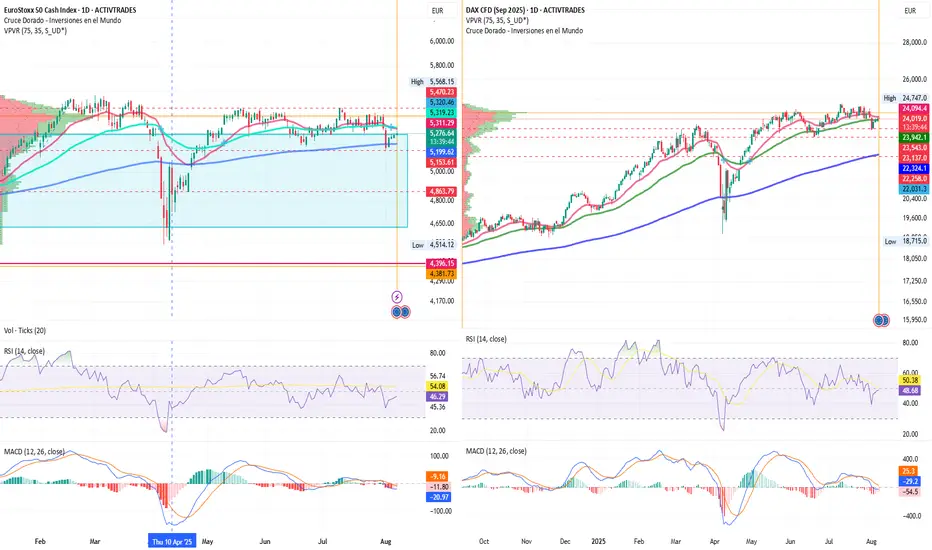
Technical Analysis – EuroStoxx 50
Current price (August 7, 2025): 5,288 points
YTD Change: +15%
Trend
• The index maintains a medium-term bullish structure, respecting an ascending trendline from the October 2023 lows.
• After the April correction driven by tariffs, the EuroStoxx 50 has regained ground and is now trading near its yearly high.
Key Levels
• Main Resistance: 5,470.23 → A breakout with volume could project a move toward the year’s high at 5,568.15
• Immediate Support: 5,153.61 → 100-day MA crossing above the 50-day may signal a corrective phase toward support
• Major Support: 4,863.79 and April lows at 4,514.12 → Technical and psychological level aligned with the April correction
Likely Scenario
• As long as the index holds above 4,570, the bias remains bullish
• A break below 4,400 would activate a correction toward 4,200–4,100
Technical Indicators
• RSI: 47% → recovering from oversold territory
• MACD: Negative and crossed downward since June, confirming a favorable correction
• Volume: Slight increase supporting the bullish trend
• POC (Point of Control): Located near the upper zone at 5,408, indicating a recovery direction
Technical Analysis – DAX 40
Current price (August 7, 2025): 24,098 points
YTD Change: +26%
Trend
• The DAX 40 also maintains a clear uptrend, with a structure of higher lows since the start of the year
• It is currently in a sideways-upward consolidation phase between 23,137 and the highs at 24,747
Key Levels
• Main Resistance: At highs → key level that has capped gains since the end of Q2
• Immediate Support: 23,359 → congestion area supporting the current rally
• Major Support: 23,137 → base of the congestion area
Likely Scenario
• The current consolidation suggests a healthy pause before a breakout, provided the 17,950 support holds
• A daily close below 23,000 would trigger a technical correction toward yearly lows
Technical Indicators
• RSI: 50 → in positive neutral territory
• MACD: Slightly flat entering positive territory; may signal renewed momentum
• Volume: MACD trend is bearish, approaching neutrality—typical of a congestion zone
• POC: Slightly below current highs, suggesting potential continuation of the uptrend
Technical Conclusion
Both the EuroStoxx 50 and DAX 40 maintain a clearly bullish bias, supported by the strength of cyclical sectors. However, they are near key resistance levels, so a technical pullback cannot be ruled out if global markets enter a profit-taking phase.
• Short-term traders should remain cautious unless breakouts are confirmed with volume
• Medium-term investors may view any pullbacks as buying opportunities, as long as key support levels hold
Is a Cycle Shift Coming?
Despite the strong performance of cyclicals so far this year, some analysts—including Morgan Stanley, Deutsche Bank, and Evercore—anticipate a 10% to 15% correction in the S&P 500 in the short term. Such a scenario could favor a return to defensive stocks, especially if volatility spikes or central banks adopt a more dovish tone.
Conclusion
2025 is undoubtedly the year of cyclical stocks. The recovery after the tariff shock has been swift, and sectors like banking, technology, and industry have taken the reins of growth. However, in rotating markets, trends can reverse as quickly as they emerge. The key will be anticipating the next turn.
*******************************************************************************************
The information provided does not constitute investment research. The material has not been prepared in accordance with the legal requirements designed to promote the independence of investment research and such should be considered a marketing communication.
All information has been prepared by ActivTrades ("AT"). The information does not contain a record of AT's prices, or an offer of or solicitation for a transaction in any financial instrument. No representation or warranty is given as to the accuracy or completeness of this information.
Any material provided does not have regard to the specific investment objective and financial situation of any person who may receive it. Past performance and forecasting are not a synonym of a reliable indicator of future performance. AT provides an execution-only service. Consequently, any person acting on the information provided does so at their own risk. Political risk is unpredictable. Central bank actions can vary. Platform tools do not guarantee success.
Transrail on Track: Electrifying Growth with Breakout PotentialTransrail Lighting Ltd is a leading EPC (Engineering, Procurement & Construction) player in the Indian power transmission and infrastructure sector. The company specializes in turnkey solutions for transmission lines, substations, and lighting infrastructure. With projects across India and global markets like Africa and the Middle East, it has emerged as a growing midcap infrastructure company with strong execution capabilities.
📊 Valuation Metrics & Multiples
The current Price-to-Earnings (P/E) ratio stands around 24–25x, indicating a reasonable valuation for a company with strong growth potential.
The Price-to-Book (P/B) ratio is slightly elevated at around 5x, but this is often justified by high return ratios and consistent earnings.
EV/EBITDA is approximately 13x, reflecting improving operational efficiency and healthy cash flows.
💰 Profitability and Returns
The Return on Equity (ROE) is approximately 24%, showcasing strong shareholder value creation.
Return on Capital Employed (ROCE) is even higher, around 35%, a sign of robust capital efficiency.
Net profit margins hover around 6.5%, which is commendable in the EPC space.
The Earnings per Share (EPS) stands at ₹29 (TTM), with consistent year-over-year growth.
📈 Recent Growth Highlights
Transrail reported a massive 81% YoY revenue growth in Q1 FY26, clocking ₹1,660 crore in revenue.
Net profit for the same quarter doubled to ₹106 crore, marking a 105% YoY rise in PAT.
The current order book stands strong at ₹14,654 crore, a 33% YoY increase, providing future revenue visibility.
New orders worth ₹1,748 crore were booked in Q1 alone, reflecting strong market demand and execution pipeline.
The company is also expanding manufacturing capacity to cater to both domestic and export requirements.
🧾 Financial Stability & Liquidity
The company has significantly reduced its net debt from ₹196 crore to ₹22.5 crore, improving its balance sheet.
Credit rating agencies like CRISIL have upgraded the company’s long-term rating to AA-/Stable, and short-term rating to A1+, reflecting improved creditworthiness.
The current ratio of ~1.31x indicates healthy liquidity.
Operating cash flow stood at ₹287 crore in the last financial year, reflecting sound internal accruals.
📰 Recent News and Developments
Transrail’s Q1 results surpassed expectations, with both revenue and profit witnessing robust growth.
The company bagged multiple large orders from power transmission and railway electrification sectors.
CRISIL’s rating upgrade has improved investor confidence and reduced borrowing costs.
Its expanding global footprint, especially in Africa and the Middle East, is expected to boost topline growth over the coming years.
📉 Technical Analysis
🔎 Price Structure & Trend
The stock is currently in a strong uptrend, forming a series of higher highs and higher lows.
A solid reversal demand zone was seen between ₹663.35 to ₹705.85, where the price bounced strongly.
The recent close at ₹794.65, up by 12.6% in a single day, indicates a bullish build-up ahead of a key breakout level at ₹810.
🧭 Key Technical Levels
Support is seen around ₹705, which acted as the base for the recent rally.
The immediate resistance lies at ₹810 – a breakout above this could accelerate the next leg of the rally.
The next target levels post-breakout are ₹905 (short-term), ₹1,165 (medium-term), and ₹1,400 (long-term trend continuation level).
🔋 Momentum and Volume
A spike in trading volume supports the current uptrend and indicates strong institutional participation.
The Relative Strength Index (RSI) remains in a bullish zone, although nearing overbought territory, suggesting strong momentum.
The uptrend remains intact as long as the price stays above ₹705 on a closing basis.
✅ Final View: Strong Fundamentals Fueling a Breakout Setup
Transrail Lighting Ltd presents a rare alignment of strong fundamentals with bullish technical structure. Backed by a growing order book, improving profitability, strong return ratios, and a deleveraged balance sheet, the company is fundamentally solid. On the technical side, a close above ₹810 could unlock significant upside potential.
Disclaimer: lnkd.in

GBPUSD 30.07.2025+ US data Beat (ADP Nonfarm, GDP QoQ, Core PCE)
~+ Timing: Pre-Fed Rate Decision
~+ Latest UK Retail Sales Miss
~+ BoE is in dovish tilt (MPC 6-3 vs 6-2 expected)
EURUSD UPTREND IS STILL INTACT
📊 Trend Analysis:
Primary Trend: Uptrend
From January to mid-July 2025, EUR/USD formed higher highs and higher lows — indicating strong bullish momentum.
Recent Correction:
After peaking around 1.18700, price retraced sharply to the 1.13800–1.14800 zone, testing previous structure support before bouncing.
---
🔍 Key Price Levels:
Level Type Notes
1.18700 Resistance Recent swing high (mid-July). Price rejected strongly from here.
1.17760 Resistance Intermediate high. May act as short-term cap.
1.15860 Support Previous consolidation area and key breakout zone.
1.13960–1.14800 Support Area of bullish reaction – demand zone.
---
🧠 Market Structure:
Break of Structure: The dip below 1.15860 suggests a temporary break in bullish structure.
Liquidity Grab / Stop Hunt: The aggressive sell-off followed by a fast recovery hints at institutional liquidity grab below 1.15000 zone.
Current Status: Price is rebounding after sweeping lows and is now retesting the 1.16700–1.17700 resistance zone.
Volume Observation:
Volume remains moderate—no extreme spikes, indicating no panic selling or aggressive institutional selling at this stage.
---
Conclusion:
Bias: Bullish
As long as price holds above 1.15860–1.14910 and the ascending trendline, the bullish structure remains intact.
A clean break below 1.14910 and the trendline would invalidate the bullish structure and may lead to deeper corrections toward 1.12060 or 1.10160.
---
Trade Idea (Example):
Entry: Around 1.15860 (on a successful retest)
Stop-Loss: Below 1.14900
Targets: 1.17760, 1.18710
NB
Hi Traders,Please let's take note that my previous analysis on EURUSD on SELL is no more valid, EURUSD is no more SELLING is now BUY does the new correction

EUR/USD Breakout Ladder — Targeting 1.20+
📊 EUR/USD Breakout Ladder — Targeting 1.20+
Strategy: Staggered buy stops every 5 pips
Executed Range: 1.15792 → 1.20000
Lot Size: 0.1 per rung average
Stops/TP: No SL / No TP — trailing begins above 1.2025
Status: All orders placed — waiting for price to do the work
⸻
🔍 Trade Thesis
EUR/USD is climbing cleanly through multi-week resistance levels with no exhaustion signs yet on H1/H4.
This is a precision ladder build, not a directional bet — letting price trigger into strength only.
Key Zone Ahead:
🟦 1.2000 = major psychological + historical structure
🔓 Trail logic activates only after confirmed close above 1.2025–1.2040
📈 If momentum holds, next macro levels are 1.2250 → 1.2500+
⸻
🌐 Macro Correlation Map (Live)
Asset Signal Implication for EUR/USD
DXY 98.12 (↘) ✅ USD weakness supports upside
VIX 16.77 (↓ 6%) ✅ Low fear = risk-on flow
SPX 6,345 (↑ 0.73%) ✅ Broad risk bid confirms trend
BTC/USD 114,514 (↓ 0.45%) ⚠️ Minor drag, but not dominant driver
GOLD $3,378.72 (↑ 0.28%) 🟨 Stable —
no conflict with EUR strength
US10Y Not shown, but yields soft ✅ Less USD appeal globally
→ Macro environment favors continued EUR/USD upside. No current red flags across equities, vol, or commodity safety flows.
⸻
⚠️ Risk Notes
• This is not a high-leverage bet — it’s a structure-following execution
• No guessing reversals, no trying to pick tops/bottoms
• Will scale out partials only on trail trigger, not emotional spikes
⸻
Bias: Bullish continuation through memory zones
Execution: Fully automated ladder — price leads, I follow
Objective: Let strength pay. No chase. No force.
