56This channel is not providing individualized trading or investment advice, nor is it a banking service, brokerage service, trading service, investment service or money management service
Beyond Technical Analysis

GBPNZD MARKET ANALYSIS AND PRICE PREDICTIONGBPNZD, has experienced a massive Bullish rejection, this rejection has produced Bearish orders for three times, meaning there is a confirmed Bearish Trend. Price Has retested the order block and there is a successful Liquidity Hunt for the Bearish Trend Continuation. The targets are the two unmitigated order block, Entry is now.
Entry. Stop loss And Take Profits are clearly stated on the chat.
GOOD LUCK GUYS!
DISCLAIMER
Any analysis can fail due to markets uncertainties. take full responsibility of your capital and manage your risk!

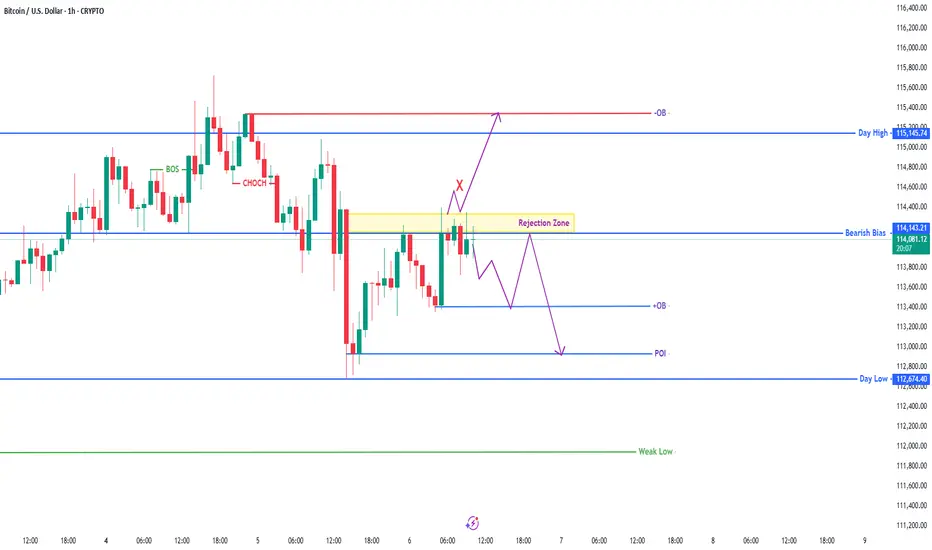
BTC/USD – 1H Smart Money Outlook | CoreLiquidity Labs🔹 Price: $114,014
🔹 Market Structure:
– CHoCH + Lower High confirms bearish pressure
– Price currently reacting to the Rejection Zone under Bearish Bias level ($114,143)
📉 Bearish Scenario (Primary Bias):
→ Rejection from zone
→ Target 1 = +OB zone near $113,400
→ Target 2 = POI + Day Low = $112,674
→ Final Target = Weak Low Sweep (Liquidity Grab)
📈 Invalidation (Bullish Breakout):
If price breaks above the Rejection Zone + Day High ($115,145), expect a shift toward upper OB levels.
🧠 Execution Tip:
Monitor lower TFs for MSS or CHoCH confirmation before executing short.
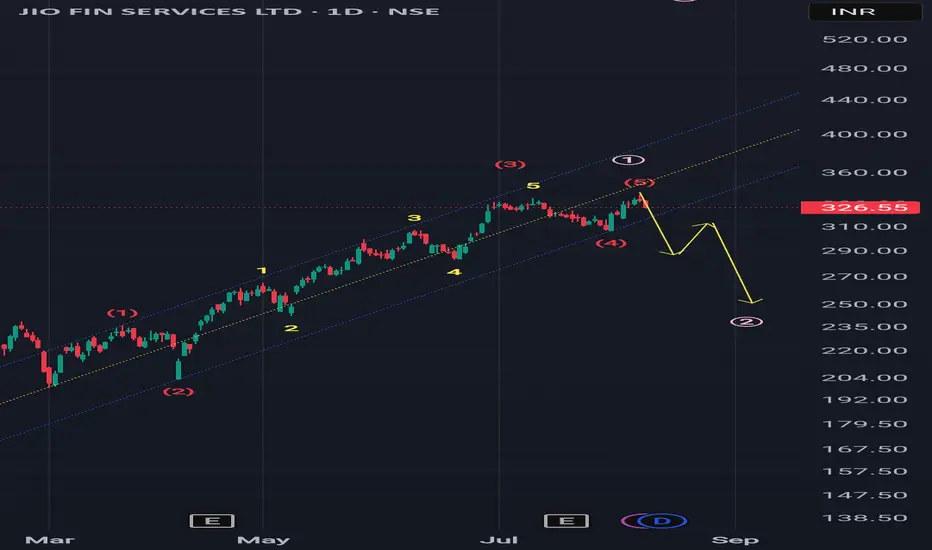
JioFinance - Short CandidateJio finance seems to have completed 5 waves advance on the upside which completes first impulse for this script. I am expecting prices to drop to 61.8% levels which is around 250 levels. One may wait for this price to come to go for long in this script for the upcoming impulse on the upside
XAUUSDHello Traders! 👋
What are your thoughts on GOLD?
Gold remains trapped below the key $3,390–$3,400 resistance zone, which has rejected price multiple times in recent sessions.
A short-term pullback toward the marked support level is likely.
From that zone, we expect buyers to step in, leading to another bullish push toward the resistance, and this time, a potential breakout above the $3,400 level.
As long as the price stays above support, the bullish outlook remains intact.
A confirmed break above $3,400 could open the path toward new highs.
Don’t forget to like and share your thoughts in the comments! ❤️

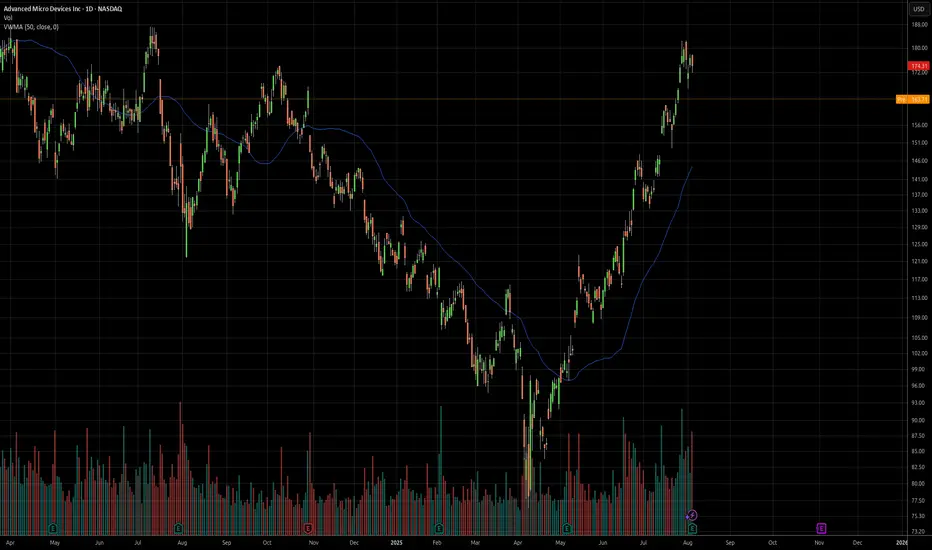
AMD Post-Earnings: Sharp Drop Despite Solid RevenueDisclaimer:
This content is for informational and educational purposes only and does not constitute financial, investment, or trading advice. All opinions expressed are based on current market conditions and are subject to change without notice. You are solely responsible for your own trading decisions. Always conduct your own research and consult with a licensed financial advisor before making any investment decisions. Trading involves significant risk of loss and is not suitable for all investors.
---
AMD reported Q2 2025 revenue of $7.7B (↑32% YoY, beat est.), but shares fell >5% after hours. EPS met expectations at $0.48, yet margins were hit by an $800M China-related inventory charge.
Data center growth disappointed at +14%, missing high AI-driven expectations. Despite strong Q3 guidance ($8.7B rev), investors reacted to lack of MI308 revenue from China and slower AI chip ramp.
Forward view: All eyes on MI350 deployment, MI400 launch, and export license clarity. Execution must now justify elevated valuation. Until then, volatility likely persists.
---
I'm looking at these 4 trading ideas based on AMD's current setup post-earnings:
1. Short-Term Reversal Play (Swing Long)
Setup: AMD dropped >5% on earnings despite solid guidance.
Idea: Enter long near $165–168 support zone (post-earnings low) for a rebound to the $175–178 gap fill.
Risk: Tight stop under $163.
Catalyst: Oversold bounce + dip-buyers reacting to bullish Q3 outlook.
2. Gap-Fill Fade (Short-Term Short)
Setup: If AMD rallies into $177–179 to fill the earnings gap.
Idea: Enter short into resistance if volume fades or rejection confirms.
Target: $168–170.
Risk: Stop above $180.
Catalyst: Sell-the-news flow, especially if macro/headwinds persist.
3. Mid-Term Accumulation (AI Growth Thesis)
Setup: Valuation reset + long-term AI roadmap (MI350 → MI400).
Idea: Gradual long build on dips below $170, targeting $200+ by H1 2026.
Timeframe: 6–12 months.
Catalyst: China export resolution, MI400 launch, AI GPU traction.
4. Options Strategy: Neutral-to-Bullish Bias
Setup: IV remains elevated post-earnings, possible consolidation ahead.
Idea: Sell cash-secured puts at $160–165 or deploy bull put spreads (e.g., Sep $165/$155).
Objective: Profit from time decay if AMD holds range.
Catalyst: Theta income with defined risk while waiting for next trend.
Target Locked: USDCHF Buy Trade with High ConvictionHey Guys,
I'm planning a buy trade on USDCHF from the pullback zone between 0.80028 and 0.80625. My target level is 0.83390.
I'm quite optimistic about this setup. But remember—forex markets do what they want; we simply make educated guesses.
That’s why risk management is key. Protect your capital.
And one more thing: every single like from you is my biggest motivation to keep sharing analysis. Huge thanks to everyone supporting me!

QNT/USDT 15m SETUP.QNT/USDT 15m Setup 🔥
Price made a strong Change of Character (ChoCH) to the upside, confirming bullish intent.
After the shift, price rallied and created a clean Demand Zone around $117.80–$118.50.
✅ Now waiting for a potential pullback to this zone for a high-probability long entry.
SMC-based setup — wait for confirmation before entry

CADJPY still bearish to expect
OANDA:CADJPY strong bearish fall in week behind us, for next week still having bearish expectations.
SUP zone: 108.000
RES zone: 105.900, 105.500

BTCUSD 8/6/2025Price has broken 4hr Bullish Structure & took 12hr Lows @ Daily TF Highs, which can induce the Daily TF Bearish Continuation targeting Lows. Let's see what Price does....
_SnipeGoat_
_TheeCandleReadingGURU_
#PriceAction #MarketStructure #TechnicalAnalysis #Bearish #Bullish #Bitcoin #Crypto #BTCUSD #Forex #NakedChartReader #ZEROindicators #PreciseLevels #ProperTiming #PerfectDirection #ScalpingTrader #IntradayTrader #DayTrader #SwingTrader #PositionalTrader #HighLevelTrader #MambaMentality #GodMode #UltraInstinct #TheeBibleStrategy

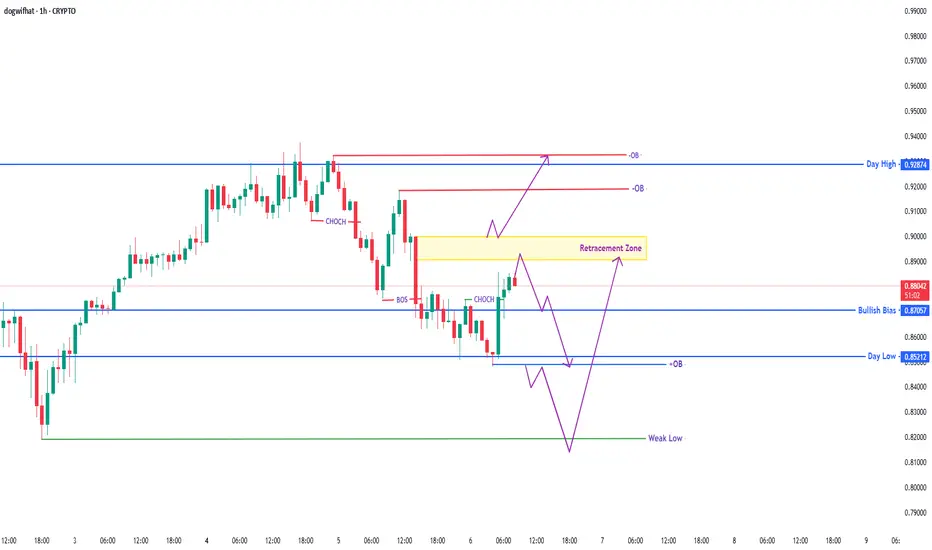
WIF/USDT – 1H Smart Money Outlook🔹 Current Price: $0.8829
🔹 Market Structure:
– Recent CHoCH indicates potential reversal
– Break of Structure (BOS) confirms bearish shift
– Current price approaching Retracement Zone (Potential Reaction Point)
🔻 Bearish Scenario:
If price reacts from the Retracement Zone, expect a move down targeting:
→ Bullish Bias Level at $0.8705
→ Then potential sweep of Day Low at $0.8521
→ Deeper liquidity grab near Weak Low
🔺 Bullish Scenario:
If price breaks and holds above the Retracement Zone, it could aim for:
→ Higher OB zone
→ Day High sweep at $0.9287
🟨 Key Zones:
– Retracement Zone = Watch for rejection
– OBs marked above as key liquidity targets
– +OB at $0.8521 acting as interim support
⚠️ Watch for CHoCH or MSS confirmations before entries.
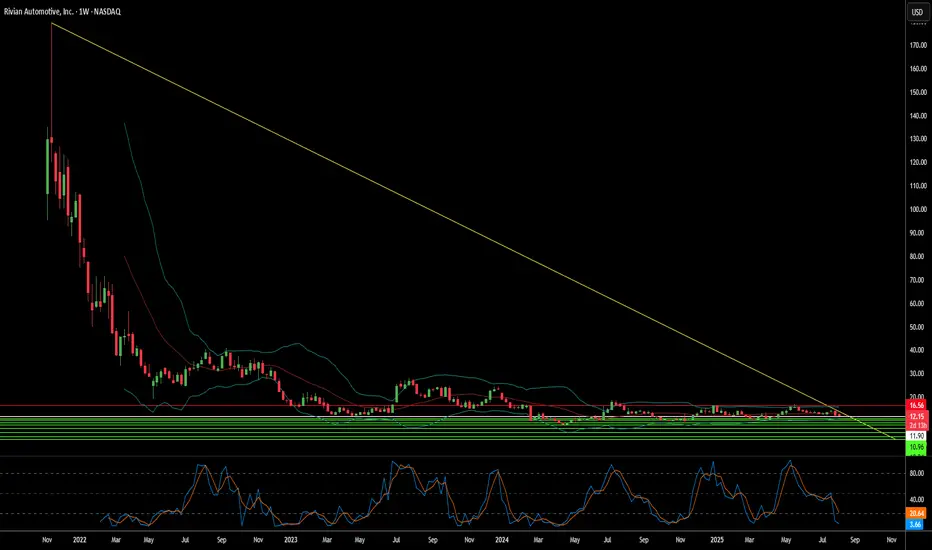
Can Rivian Survive the Perfect Storm of Challenges?Rivian Automotive reported mixed Q2 2025 results that underscore the electric vehicle startup's precarious position. While the company met revenue expectations with $1.3 billion in consolidated revenue, it significantly missed earnings forecasts with a loss per share of $0.97 versus the anticipated $0.66 loss - a 47% deviation. Most concerning, gross profit returned to negative territory at -$206 million after two consecutive positive quarters, highlighting persistent manufacturing inefficiencies and cost management challenges.
The company faces a confluence of external pressures that threaten its path to profitability. Geopolitically, China's dominance over rare earth elements - controlling 60% of production and 90% of processing capacity - creates supply chain vulnerabilities, while new Chinese export licensing rules complicate access to critical EV components. Domestically, the impending expiration of federal EV tax credits on September 30, 2025, combined with the effective end of CAFE fuel economy standards enforcement, eliminates key demand-side and supply-side incentives that have historically supported EV adoption.
Rivian's strategic response centers on three critical initiatives: the R2 model launch, the transformative Volkswagen partnership, and aggressive manufacturing scale-up. The R2 represents Rivian's pivot from niche, high-cost premium vehicles to mainstream, higher-volume products designed to achieve positive gross margins. The $5.8 billion Volkswagen joint venture provides essential capital and manufacturing expertise, while the Illinois plant expansion to 215,000 annual units by 2026 aims to deliver the economies of scale necessary for profitability.
Despite maintaining a strong cash position of $7.5 billion and securing the Volkswagen investment, Rivian's widened EBITDA loss guidance of $2.0-2.25 billion for 2025 and target of EBITDA breakeven by 2027 represent a high-stakes race against time and capital burn. The company's success hinges on flawless execution of the R2 launch, achieving planned production scale, and leveraging its software capabilities and patent portfolio in V2X/V2L technologies to diversify revenue streams beyond traditional vehicle sales in an increasingly challenging regulatory and competitive environment.
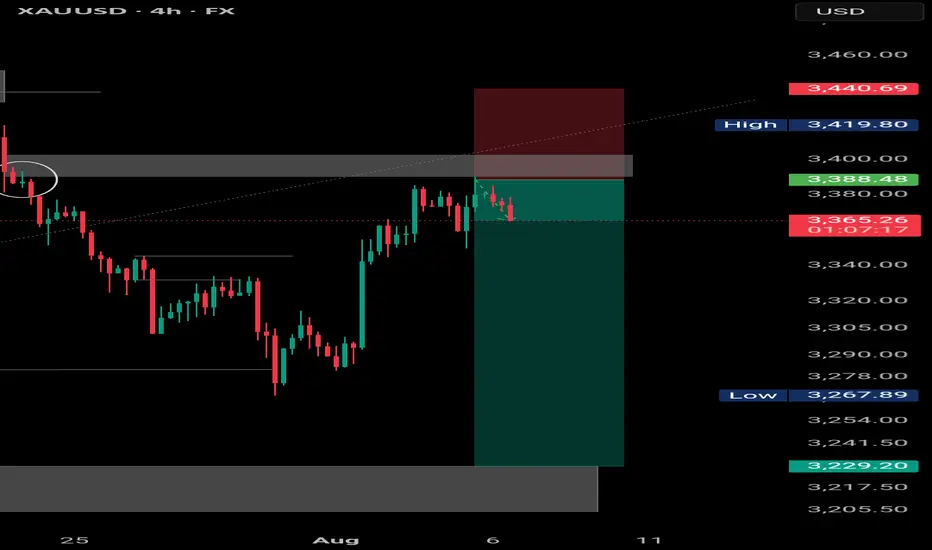
Gold Slightly Pulls Back – Awaiting Fed & Dollar Direction📊 Market Drivers:
Spot gold slipped ~0.1% to $3,376/oz, pressured by a firmer USD and caution ahead of Trump’s Fed chair and governor appointments
📉 Technical Analysis
• Key resistance levels:
o $3,390: previous session high – near-term ceiling
o $3,410: weekly high – stronger upside barrier
o $3,435: medium-term resistance – break above confirms strong bullish continuation
• Nearest support levels:
o $3,365: current Asian session low
o $3,345: strong support zone – EMA50 on H4 chart
o $3,305: last week's low – breakdown here may trigger deeper pullback
• EMA: Price remains above EMA09 and EMA50, suggesting a short-term bullish bias, though momentum is slowing.
• Candlestick / Volume / Momentum: Low volume in Asian session; H1 candles show indecision (doji with long wicks), signaling a tug-of-war between buyers and sellers.
📌 Outlook:
Gold may consolidate or dip slightly short-term unless it decisively breaks above $3,395 to confirm a new bullish leg.
________________________________________
💡 Suggested Trading Strategy:
SELL XAU/USD: ~3,392– 3,395
🎯 TP: 40/80/200 pips
❌ SL: ~3,398
BUY XAU/USD : ~3,366 - 3363
🎯 TP: 40/80/200 pips
❌ SL: ~3,360

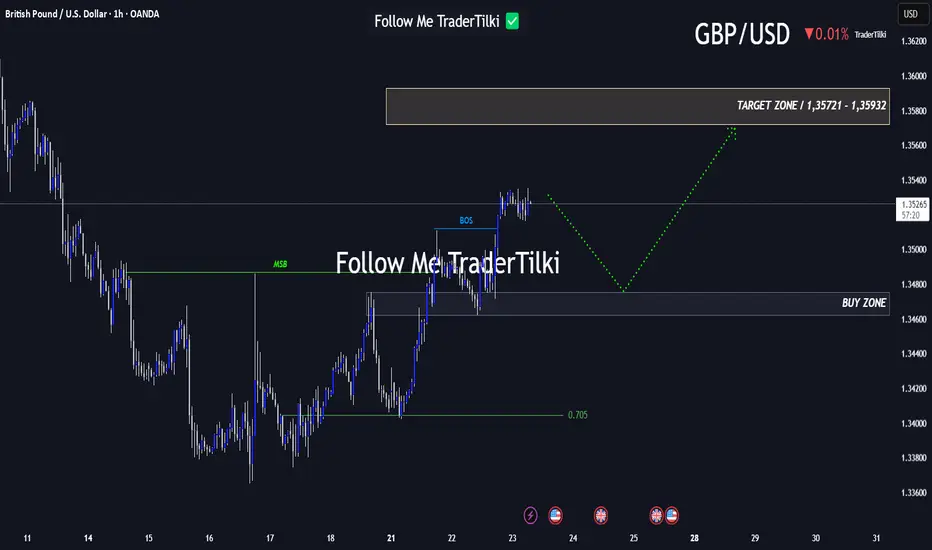
Every Like Is a Boost: This GBPUSD Analysis Is Just for You!Good morning, friends 🌞
Due to the recent shift in GBPUSD’s market structure, I plan to enter a buy position when price reaches the 1.34753 – 1.34623 range.
Target levels: 1.35721 and 1.35932 📈
Every like you send fuels my motivation to share fresh analyses. Thank you to everyone who’s supporting this journey ❤️
Palantir is a cult? Ticker: NYSE:PLTR
Current Price: $173
Market Cap: $380B+
P/S: 116x
P/E: 500x+ trailing, 234x forward
Bear Thesis:
Palantir is now trading at a level that makes even Nvidia look cheap. This is a classic parabolic AI play driven by retail FOMO, not by fundamentals. The company needs to maintain 30%+ annual growth for years just to justify today’s valuation. One miss, and the whole tower comes down.
Problems:
1. Valuation is insane, far above anything justified by cashflow or realistic comps. DCF and sum-of-parts models put fair value between $20 and $30. That’s up to 85% downside from here.
2. Analyst average price target sits at $108. Plenty call for $40–$75 if growth stalls or the hype fades.
3. Heavy reliance on US government deals. Any cut to defense budgets, a change in admin, or a headline scandal and half their contracts can disappear.
4. Competition is coming hard. Google, Amazon, Microsoft all pushing enterprise AI. Palantir’s moat is shrinking.
5. Stock acts like a meme: options-fueled squeezes, no connection to cashflow. If market sentiment turns risk-off, these multiples get crushed.
What could trigger the unwind:
• Any earnings miss, weak guidance, or margin compression
• Defense budget cuts or bad headlines
• AI trade rotation or a macro correction targeting high-flyers
• Commercial growth disappoints
Bear Targets:
• $108: analyst average (still aggressive)
• $40–$75: if narrative breaks, AI hype dies, or execution slips
• $20–$30: where most bear DCFs cluster, fair value based on realistic growth
Bottom Line:
PLTR is pricing in perfection in a market that rarely delivers it. If you’re long here, you’re paying tomorrow’s prices for today’s story. This is one of the most crowded trades in AI right now, and history says these always end the same way. Protect your capital.

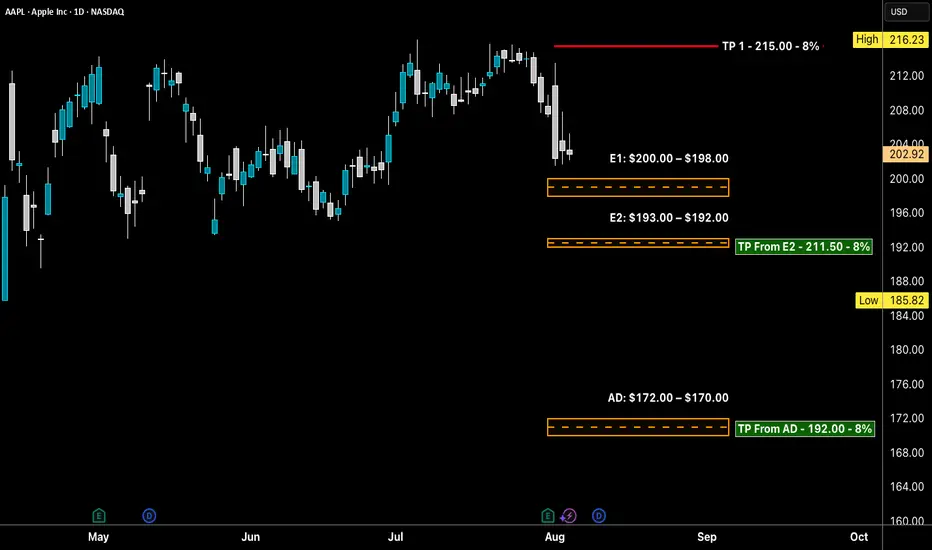
AAPL LONG Swing Entry PlanNASDAQ:AAPL LONG Swing Entry Plan
E1: $200.00 – $198.00
→ Open initial position targeting +8% from entry level.
E2: $193.00 – $192.00
→ If price dips further, average down with a second equal-sized entry.
→ New target becomes +8% from the average of Entry 1 and Entry 2.
AD: $172.00 – $170.00
→ If reached, enter with double the initial size to lower the overall cost basis.
→ Profit target remains +8% from the new average across all three entries.
Risk Management:
Stop Loss:
Risk is capped at 12% below the average entry price (calculated across all executed positions including the Edit Zone).
Position Sizing Approach:
Entry 1: 1x
Entry 2: 1x
AD Zone: 2x
→ Total exposure: 4x
→ Weighted average determines final TP and SL calculations.
______________________________________
Legal Disclaimer
The information provided in this content is intended for educational and informational purposes only and does not constitute financial, investment, or legal advice or recommendations of any kind. The provider of this content assumes no legal or financial responsibility for any investment decisions made based on this information. Users are strongly advised to conduct their own due diligence and consult with licensed financial advisors before making any financial or investment decisions.
Sharia Compliance Disclaimer: The provider makes no guarantees that the stocks or financial instruments mentioned herein comply with Islamic (Sharia) principles. It is the user’s responsibility to verify Sharia compliance, and consultation with a qualified Sharia advisor is strongly recommended before making any investment decisions
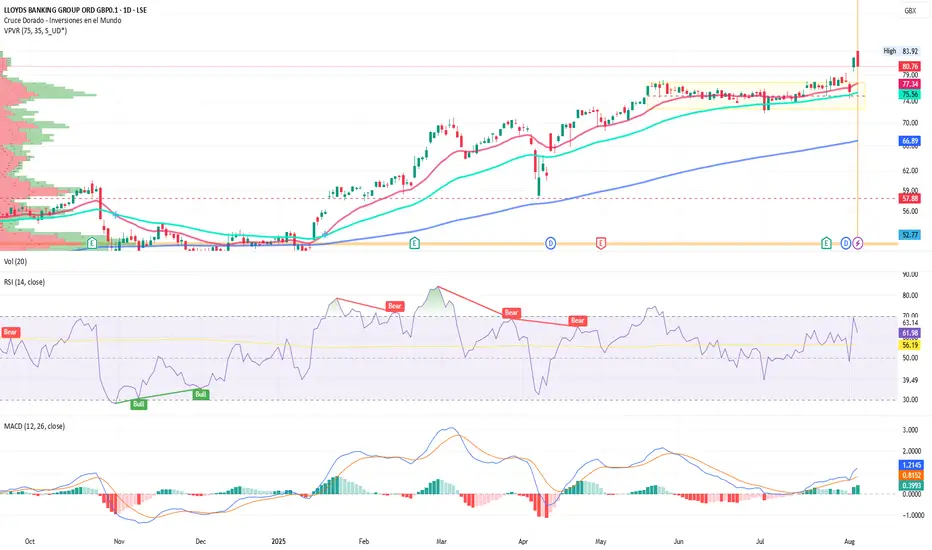
British Banks Dodge a Legal BulletBritish Banks Dodge a Legal Bullet, but Still Face Billion-Pound Costs
Ion Jauregui – Analyst at ActivTrades
The UK Supreme Court relieves financial institutions from paying up to £44 billion over the car finance scandal. The FCA is preparing compensation plans that could cost up to £18 billion.
British banks have narrowly avoided a legal blow that threatened one of the largest payouts in their recent history. The UK Supreme Court ruled against applying broad compensations for inflated commissions on car finance agreements—a case that could have cost the sector up to £44 billion.
The decision was met with relief by the market. Shares of Close Brothers Group, Lloyds Banking Group, Barclays, and Bank of Ireland, all with direct or indirect exposure to auto loans, posted significant gains following the verdict.
However, the legal outcome does not mark the end of the matter. The Financial Conduct Authority (FCA) has announced it is working on a more limited compensation plan, which could result in payouts between £9 billion and £18 billion. Lloyds, one of the most affected entities, currently holds a provision of £1.2 billion, which its management believes will not need to be significantly increased.
Moody’s has rated the situation as credit negative for the UK banking sector, warning that despite the favorable ruling, regulatory and reputational risks remain.
Fundamental Analysis of Lloyds
Lloyds Banking Group (LSE: LLOY) remains a cornerstone of the UK financial system. Backed by strong capital ratios and a diversified portfolio, the bank has managed to weather regulatory and macroeconomic challenges in the post-Brexit, inflationary environment.
In its latest quarterly report, Lloyds posted a net profit of £1.63 billion, beating market expectations. The bank reported a ROTE of 15.3% and a CET1 ratio of 13.9%, providing a solid buffer to absorb potential future shocks. Additionally, the board announced an interim dividend of 0.92 pence per share, underscoring its commitment to shareholder returns despite ongoing uncertainties.
Technical Analysis of Lloyds (LSE: LLOY)
Lloyds has shown remarkable technical momentum so far this fiscal year. After hitting lows of £49.93 in January and forming a base that led to a golden cross of moving averages, the stock experienced a temporary dip to £57.88 following the announcement of new US tariffs.
Since then, the share price has advanced steadily, recently touching a new all-time high of £83.92 after forming a clear accumulation zone between May and July. This week, the stock decisively broke out of that range, entering what appears to be a potential “blue-sky” scenario, with no defined resistance levels above.
The move is supported by a bullish MACD crossover and increased trading volume, signaling momentum strength.
On the other hand, the RSI, currently at 61.98, indicates a slight moderation in the trend, especially after Tuesday's bearish candle, which could hint at a short-term correction toward the point of control (POC) at £75.20.
Key Indicators:
• MACD: Expanding, confirming strong upward momentum.
• RSI: At 61.98, suggesting moderate overbought conditions and possible pullback.
• Moving averages: Diverging, reinforcing the bullish trend structure.
Levels to Watch:
• Support: £77.50 – a break below this level could trigger a return to the accumulation zone.
• Resistance: With no clear ceiling in place, a continuation of the current breakout could see the stock approach the £90 mark.
In summary, while a short-term pullback is possible if regulatory pressure intensifies, Lloyds' technical outlook remains firmly bullish, supported by growing volume and strong momentum signals.
Dodging the Bullet
The Supreme Court ruling provides short-term relief for the UK banking sector, but the financial impact of the car finance scandal remains unresolved. As the FCA outlines its compensation plan, Lloyds stands out for its solid fundamentals and bullish technical setup—albeit with room for short-term corrections. The UK banking industry, although momentarily having dodged a bullet, still faces unresolved regulatory challenges and market scrutiny. The case has reignited the debate around sales practices in the UK auto finance market, a segment that until recently had avoided the level of oversight applied to other financial products.
*******************************************************************************************
The information provided does not constitute investment research. The material has not been prepared in accordance with the legal requirements designed to promote the independence of investment research and such should be considered a marketing communication.
All information has been prepared by ActivTrades ("AT"). The information does not contain a record of AT's prices, or an offer of or solicitation for a transaction in any financial instrument. No representation or warranty is given as to the accuracy or completeness of this information.
Any material provided does not have regard to the specific investment objective and financial situation of any person who may receive it. Past performance and forecasting are not a synonym of a reliable indicator of future performance. AT provides an execution-only service. Consequently, any person acting on the information provided does so at their own risk. Political risk is unpredictable. Central bank actions can vary. Platform tools do not guarantee success.
135K COMING! Retrograde rallies!Heres a quick update on my take on Bitcoin reacting to Mercury retrograde, the moon cycles and our lunar eclipse in early September.
We are at our last stages in this bull market before BTC starts bleeding into September. It's critical to know how we are sitting technically, so please stay calm and observe the market neutrally.
- 112K Support is holding firm, this level is critical as Mercury retrograde enters Q3, which Quarter 3 has been historically bullish for Bitcoin.
- However, bearish energy could still linger until August 14th, as that date is within a 5 day window of a full moon. From now until the 14th will be a cooling zone and consolidation zone. Our RSI is sitting nice and neutral, not reacting to much to the recent drop, meaning more room for upside.
- From August 14th - 28th, we will start to see euphoria in the market. After we are supported on the 117.5K level a 15% rally could take us to the 1.618 FIB level, i'm taking profits at 135K.
- After that, we face the second lunar eclipse of this cycle on September 7th. Historically every Lunar eclipse has bearish energy, and I'm excepting to re accumulate after a 30 - 35% correcting from the recent top out.
This will be the end of the Bitcoin rally, naturally creating a bleed from BTC into the ALT's, Bitcoin will drop as well as dominance and ALT season will kick in. Bye Bye BTC until march for a little swing...

NG FUT long setupNG FUT long setup
Entry - 260.8
Stop loss - 260
Target - 267.4
Risk Reward - 1:11.3

Xauusd look Rise Direction Gold has started to rise from the key support zone of 3352–3350, as expected in our previous analysis. Price action indicates a bullish trend, suggesting a potential reversal from the 3350/3345 area.
According to Elliott Wave Theory, it appears that Gold has completed its 5-wave impulsive structure. We are now likely entering a corrective phase, which could still support upward momentum in the short term.
🔑 Key Levels:
Support: 3350 / 3345
Resistance 3400 / 3420

Is NZD/JPY the Next Bullish Vault Breach? Target: 89.000💰 NZD/JPY – Thief's Layered Strike Plan | Bullish FX Heist 🚀💹
🌍 What’s up, Market Bandits?!
Welcome to the Thief Trader Vault — where trades aren't guessed… they're executed with stealth 🕵️♂️💼. Today's blueprint? We're cracking into the NZD/JPY vault with a layered limit order raid – the perfect setup for real FX tacticians.
🎯 Plan: Full Bullish Operation – Precision Infiltration 🔥
The Thief Method hits different — we don't chase price, we trap it.
We’re placing multiple limit orders like laser tripwires, stacked and ready to ambush price movement on the way to our vault 💣.
💸 Entry: ANY Price Level — Layered Style 😎
This ain’t “wait for confirmation” talk — this is calculated chaos:
🔹 Multiple limit orders, like a sniper grid
🔹 Let price dip, retrace, or fakeout — we’re in regardless
🔹 Stack 'em like bricks and let price come to YOU
🔑 “Smart thieves don’t knock — they build secret doors.”
🛡️ Stop Loss: 86.500 – Guard the Loot 🎯
No games. No leaks.
Set your SL at 86.500 – below structural defense lines.
🔒 Capital protection is king. Hit, grab, bounce.
🎯 Target: 89.000 – Vault Exit Point 💎
When we hit 89.000, we unload the bag 💼
Optional: Trail your SL and squeeze more juice if momentum breaks high.
🧠 “Exit with impact. Leave no trace.”
⚙️ Strategy Style – For Real Ones Only:
👟 Scalpers:
Tap in on micro pullbacks. Hit & run style.
🎯 Ride with momentum — no shorts, no detours.
🛠️ Swing Traders:
You’re the long-haul vault opener. Stay locked in.
Use patience as your weapon — let the plan cook.
🧠 Market Backing – This Isn’t Just Hype:
🔸 JPY showing weakness across risk pairs
🔸 Global sentiment leaning risk-on
🔸 Cross-market confluence backing NZD strength
🔸 Liquidity voids above — ripe for targeting
⚠️ Risk Management = Real Trader Behavior
🚨 Avoid jumping during high-impact news
🧱 Trail your SL if you're already in profit
📉 This ain't gambling. It's probability warfare
💬 Final Words – Boost The Bandit Blueprint 📣
🔥 SMASH that ❤️ if this plan speaks your language.
🔁 DROP a comment if you’re layering up with the crew.
We don’t follow the herd — we rob the market 🥷💹
📌 Stay silent. Stay sharp. Stay rich.
— Thief Trader 💼⚡

BTC Top NFA, DYOR.
Food for Thought: Rate Cut - Geopolitical Tension - BTC is up how much from the bottom? - Coinbase App Store - Retail hopping on Solana.
Enjoy.
